bus-4
Mutants Produce Altered Mucins
Lisa M. Parsons1, Rahman M. Mizanur1¤, Ewa Jankowska1, Jonathan Hodgkin2, Delia O9Rourke2, Dave Stroud2, Salil Ghosh1, John F. Cipollo1*
1Food and Drug Administration, Center for Biologics Evaluation and Research, Bethesda, Maryland, United States of America, 2Genetics Unit, Department of Biochemistry, University of Oxford, Oxford, United Kingdom
Abstract
Caenorabditis elegans bus-4glycosyltransferase mutants are resistant to infection byMicrobacterium nematophilum,Yersinia pestisandYersinia pseudotuberculosisand have altered susceptibility to twoLeucobacterspecies Verde1 and Verde2. Our objective in this study was to define the glycosylation changes leading to this phenotype to better understand how these changes lead to pathogen resistance. We performed MALDI-TOF MS, tandem MS and GC/MS experiments to reveal fine structural detail for thebus-4 N- andO-glycan pools. We observed dramatic changes inO-glycans and moderate ones in N-glycan pools compared to the parent strain.Cecore-I glycans, the nematode’s mucin glycan equivalent, were doubled in abundance, halved in charge and bore shifts in terminal substitutions. The fucosylO-glycans,Cecore-II and neutral fucosyl forms, were also increased in abundance as were fucosylN-glycans. Quantitative expression analysis revealed that two mucins,let-653 andosm-8, were upregulated nearly 40 fold and also revealed was a dramatic increase in GDP-Man 4,6 dehydratease expression. We performed detailed lectin binding studies that showed changes in glycoconjugates in the surface coat, cuticle surface and intestine. The combined changes in cell surface glycoconjugate distribution, increased abundance and altered properties of mucin provide an environment where likely the above pathogens are not exposed to normal glycoconjugate dependent cues leading to barriers to these bacterial infections.
Citation:Parsons LM, Mizanur RM, Jankowska E, Hodgkin J, O9Rourke D, et al. (2014)Caenorhabditis elegansBacterial Pathogen Resistantbus-4Mutants Produce Altered Mucins. PLoS ONE 9(10): e107250. doi:10.1371/journal.pone.0107250
Editor:Frederique Lisacek, Swiss Institute of Bioinformatics, Switzerland ReceivedApril 3, 2014;AcceptedAugust 13, 2014;PublishedOctober 8, 2014
This is an open-access article, free of all copyright, and may be freely reproduced, distributed, transmitted, modified, built upon, or otherwise used by anyone for any lawful purpose. The work is made available under the Creative Commons CC0 public domain dedication.
Data Availability:The authors confirm that all data underlying the findings are fully available without restriction. All relevant data are within the paper and its Supporting Information files.
Funding:This work has been supported in part by Oak Ridge Institute for Scientific Education (ORISE), and the Center for Biologics Evaluation and Research (CBER) of the Food and Drug Administration (FDA). The work from JH is supported by Medical Research Council UK, Grant G0600238. The funders had no role in study design, data collection and analysis, decision to publish, or preparation of the manuscript.
Competing Interests:The authors have declared that no competing interests exist. * Email: [email protected]
¤ Current address: US Army Medical Research Institute of Infectious Diseases, Division of Molecular and Translational Sciences, Fort Detrick, Frederick, Maryland, United States of America
Introduction
Caenorhabditis eleganscan be infected by over forty microbial pathogens [1]. Among these are the nematode specific pathogen, Microbacterium nematophilum, and the human pathogensYersinia pestisandYersinia pseudotuberculosis.M. nematophiluminfects the anus, rectum and surrounding cuticle of the nematode causing localized swelling and constipation [2]. Y. pestis and Y. psudotuberculosis do not directly infectC. elegans. Rather these bacteria secrete an exopolysaccharide that adheres to the head region of the nematode, causing starvation [3]. Thebusandbah genetic screens have isolated mutants resistant toM. nematophilum and Yersinia spp. respectively, and there is significant genetic overlap between the screens demonstrating that a series of the same genes are required for both pathogenic processes.
Thebusscreens have yielded more than 20 complementation groups [4,5]. These were characterized by an absence of swelling in the tail region when exposed to theM. nematophilumleading to the bacterially unswollen (bus) phenotype. Included among the genes that have been cloned six (bus-2,bus-4,bus-8,bus-12, bus-17andsrf-3) encode a distinct gene required for, glycoconjugate
biosynthesis [6-8]. The bus-2, bus-4 and bus-17 genes encode homologs of glycosyltransferases [8]. Thebus-12[8] andsrf-3[9] genes encode nucleotide sugar transporter homologs and bus-8 encodes a mannosyltransferase homolog predicted to act in protein N-glycosylation [6]. A screen for altered susceptibility toYersinia biofilm attachment to the head region (biofilm absent on head, bah) identified eight genes. Five genes identified in these bah screens were also identified inbusscreens. These weresrf-2,srf-3, bus-4,bus-12andbus-17[7]. Thesrf-2andsrf-3mutants were originally selected in screens by their ectopic lectin binding srf (surface) [10,11] phenotype. That screening with bacterial pathogens and lectins identified the same genes infers similarities in the mutant phenotypes, namely a shift in glycoconjugate status at the cuticle surface. All of these screens identified genes required for glycosylation of the cuticle and these genes are expressed in the hypodermal seam cells demonstrating that these cells are required for surface coat and/or cuticle glycoconjugate production [5,8].
cuticle surface interactions with pathogens and other interactions as well.Bacillus pumilussecretes an adhesive that can trap wild typeC. elegans[8]. InB. pumilushurdle assaysbus-4,bus-8, bus-17andsrf-3pass over the adhesive zone without difficulty, while bus-2andbus-12have increased difficulty. In all of these mutants, male interaction with wild type hermaphrodites is defective. The bus-4,bus-8,bus-12and bus-17have a skiddy movement onE. colilawns and all butbus-12are fragile [7]. Additionally, thebus-4 mutants demonstrate altered susceptibilities to the Leucobacter isolates, referred to as Verde 1 and Verde 2 [12]. While Verde-1 is non-lethal to wildtype nematodes, it is lethal tobus-4 nematodes. Alternatively, Verde-2 is lethal to wildtype worms but non-lethal to bus-4 nematodes. All of these characteristics demonstrate that the cuticle of these mutants is altered through compromised glycosyl-ation affecting how they interact with their environment.
Previously we reported theN- andO-glycan structures of the srf-3 and bus-2 reference strains [13,14]. In srf-3 mutants we observed a dramatic decrease inCecore-IO-glycans and a marked loss of galactosylN-glycans consistent with the function ofSRF-3, a Golgi UDP-Gal/UDP-GalNAc multi- nucleotide sugar trans-porter [14]. Inbus-2mutants, deficient in a predicted galactosyl-transferase, we also found changes in O-glycosylation but no significant changes inN-glycosylation. TheCecore-II O-glycans were revealed in that study as they were more abundant in the bus-2 genetic background than wild-type or other strains previously examined. Ce core I glycans were also affected by the bus-2 deficiency. Lectin studies of acetone fixed bus-2 nematodes revealed a dramatic loss in Ce core-I O-glycoproteins over the cuticle surface as detected by ABA lectin staining. This glycocon-jugate loss was especially dramatic in the anal and rectal regions and surrounding cuticle, the areas infected byM. nematophilum. Mass spectrometry analysis showed that theCecore-I glycan pool compositions were also altered in distribution. Additionally, UEA-1 alpha fucose detecting lectin stained strongly in the distal intestine of bus-2nematodes. This signal was not susceptible to PNGase F treatment suggesting an aberrant or increased presence of fucosyl O-glycans in the hind gut, likely the Ce core-II O -glycoproteins. The evidence derived from the srf-3 and bus-2 studies strongly suggested that the infective processes of M. nematophilum,Y. pestisandY. pseudotuberculosisrequires proper O-glycosylation.
In the current study we investigate the glycosylation defect in the bus-4 reference strain. We have performed lectin binding studies of both fixed and live nematodes and detailed structural analyses of releasedN- andO-linked glycans. We also performed quantitative expression analyses of key pathway glycosylation enzymes. These studies reveal a uniquebus-4glycomics profile at the levels of glycan fine structure, tissue specific distributions and related expression levels. These changes impact interaction betweenC. elegansand its environment including the pathogenic interactions withM. nematophilum,Y. pestisandY. pseudotuber-culosis. The impact these changes have on these interactions is discussed.
Materials and Methods
Strains and culture maintenance
C. elegans wild type (N2 Bristol), which is sensitive to M. nematophilum infection, was used as control. The bus-4 strain (e2693) used in this study was generated by Ethylmethane Sulphonate mutagenesis [4]. It contains a missense mutation, Gly224Arg, which changes a highly conserved residue in the galactosyltransferase domain, and is therefore likely to be null or near-null for enzyme activity. A different allele,e2700, was used in
some rescue and lectin staining experiments; this allele is phenotypically similar toe2693and changes a residue (Gly58Asp) conserved between differentCaenorhabditis species. Both of the N2 andbus-4strains were provided by JH.C. elegansstrains were maintained at 16uC on NGM agar seeded withEscherichia coli OP50 according to the standard methods as described previously [15].
Bacterial strains and growth conditions
E. coli OP50 and M. nematophilum strains CBX102 were grown in Luria Bertani (LB) nutrient medium at 37uC for 24 h and 48 h, respectively. For assessment ofC. eleganssusceptibility to infection Nematode Growth Medium (NGM) agar plates were aseptically seeded with theE. colistrain OP50 containing 1%M. nematophilumCBX102 as described previously [4].
Transgenic rescue of bus-4
Construction of strain CB6817 is described in more detail elsewhere [16]. This strain is homozygous for abus-4mutation, allelee2700, and carries a transgene containing an operon fusion of wildtypebus-4with mCherry, together with sur-5::GFP as a transformation marker.
Quantitative RT-PCR (qRT-PCR) analysis
Transcript levels of gmd-2, osm-8, let-653, lipl-1, bus-2, gly-11and bus-8transgenes in N2 andbus-4strains, were measured by quantitative RT-PCR. The following primers were used: gmd-2 For AAAGCGAGCTGACCCCATT; gmd-2 rev ATACATC-TTGGCGACCGCATA; let 653 For CTGTCTCGTGAGAA-TATGTCC; let-653-Rev TTCCACGTCGTCGCATGT; osm-8 For AGAAGCCCCACCACTGATTG; osm-8 Rev TTGTTT-TTGCCACGGTTCAA, lipl-1 For GCGGATCCGGAGAT-GAAGA
lipl-1 Rev GGATATCCCCATCGCATGAT, bus-2 For AGTTTCCCGACGGATTCCA, bus-2 Rev AGGGCGATGA-GGCAACTG, 11 For GGACCTGCGGTGGAGAACT, gly-11 Rev GCGGAAAATGTGGCCAACT, bus-8 For CTCC-GGACCAGAAGCTAGGA, bus-8 Rev CGCCCTCCAATGA-AAGTCATTotal RNA was obtained from the biological triplicate of each strain. The cDNA was produced from the total RNA extracts using a random primer strategy and Superscript III reverse transcriptase. Primers were designed by the program primer 3, where amplicon size was restricted to 60 mer. Primers were ordered from IDT. Finally expression of the transgenes were determined quantitatively by the relativeCt method using SYBR green (from Applied Biosystem) as fluorescent detector in an applied biosystem 7900 HT instrument Results are the average of three biological replicates normalized to the geometric mean of one control gene (actin 4). Changes were determined by normalizing samples to a control sample (N2). Error bars represent one standard deviation.
Large scale C. elegans culture
TheC. elegansstrains were grown in 2.8 liter Fernbach Flasks containing 250 ml of M9 media (3 g/l KH2PO4, 6 g/l Na2HPO4,
5 g/l NaCl, 1 mM MgSO4), 5 mg/L cholesterol, and 7 grams of
E. coliOP50 to serve as a food source. Worms washed from three NGM plates (100 mm x 15 mm) were used to inoculate each culture which was gently shaken at 75 rpm at room temperature for 3-4 days until the worms were visible when the flask was tipped.
settled to the edge. Then the media was poured off. The remaining pellet was split into two 50 ml Falcon tubes and washed three times with cold 100 mM NaCl by centrifugation at 400 x g for 2 – 3 minutes in a spinning bucket centrifuge. The worms were rocked in 100 mM NaCl at room temperature for 30 minutes and pelleted to remove debris. The drops of worms were then flash frozen with liquid nitrogen and the pellets stored at 80uC. Cultures were processed in this manner until 10 to 12 grams (wet weight) of nematodes for each strain were collected.
Glycoprotein preparation
Flash frozen nematode pellets were processed for isolation of glycoprotein rich extracts as previously described [13].
Glycan release and derivatization
C. elegans glycoprotein enriched extracts were processed for sequential release of N- and O-glycans using PNGase F and PNGase A for the former and b-elimination for the latter as previously described [13]. PNGase F was used first to release the majority of N-glycans while PNGase A was used subsequently to release retainedN-glycans which are enriched for fucosyl forms in C. eleganspreparations. All released glycans were permethylated for structural analysis as previously described by Ciucanu et al. [17,18].
MALDI-TOF MS Analysis
Glycans were permethylated according to Ciucanuet al., The permethylated glycans [18] were suspended in 50% methanol/ water, spotted onto a MALDI plate, mixed 1:1 with 2,5-DHB matrix in the same solution plus 1 mM sodium acetate, and analyzed using a Perseptive Biosystems Voyager DE RF MALDI-TOF mass spectrometer. Samples were analyzed in positive ion reflectron mode in the 800-5500 m/z range in triplicate. Matched N2 and bus-4 glycan samples were analyzed. Three hundred individual scans were summed per analysis. The MS data were processed with DataExplorer (Perseptive Biosystems).
Reductive Amination
Oligosaccharides were dried in a Savant speed evacuation device and reconstituted in 15ml of dimethylsulfoxide (DMSO). To the reconstituted samples was added 100ml of 2 M cyanobor-ohydride and 35ml of 0.5 M 2-amino benzamide (2-AB), both of which were solubilized in DMSO. Glacial acetic acid (50ml) was then added. The reaction was performed at 65uC for 2 h. The reaction mixture was then diluted to one ml with 90% acetonitrile containing 0.1% trifluoroacetic acid (TFA) and was applied to a Amide-80 (HILIC, Tosoh, Japan) column that was preequilibrated with 90% acetonitrile containing 0.1% TFA. The columns were then washed three times with one ml 90% acetonitrile containing 0.1% TFA and finally the aminated glycans were eluted with one ml of 50% acetonitrile containing 0.1% TFA, dried and stored at -20uC.
Ion Trap LC/MS Analysis of Aminated Oligosaccharides The characterization ofN-glycans released fromC. elegansand labeled with 2-AB was carried out by LC/MS analysis on an LTQ XL linear ion trap mass spectrometer equipped with an ESI source (Thermo-Electron, San Jose, CA, USA). The mass spectrometry coupled liquid chromatography was performed using a Surveyor autosampler plus and MS pump plus (Thermo Scientific). The column used was a 1.0 mm x 15 cm, 5mm TSK gel Amide-80 column (Tosoh Bioscience LLC, PA, USA). Solvent A was 20 mM ammonium acetate (pH 6.9) and solvent B was 100% acetonitrile.
The flow rate was 40ml/min. Initial conditions were 20% solvent A/80% solvent B. After 5 minutes solvent B was decreased from 80% to 25% over 100 minutes followed by re-equilibration for 10 minutes at initial conditions.
Mass spectrometer conditions were a spray voltage of 5.0 kV and the capillary temperature was 170uC. The sheath gas flow was set to 20.00 units. For the generation of the MSn spectra, normalized collision energies were set to 35%. The method used was triple play operated by Xcalibur software, with second scan being Zoom MS and third scan was Dependent MS/MS of most intense ion from scan event 2. The isolation width was set to 2 amu. All experiments were performed in the positive ion mode.
Ion Trap MS Analysis of Permethylated Oligosaccharides Samples were dissolved in 40% methanol/10 % isopropanol/ 0.1 % FA. The Advion Nanomate (Ithaca, NY USA) source was used in direct infusion mode. The nitrogen gas pressure was set to 0.3 psi and spray voltage at 1.4 kV. Capillary temperature was maintained at 175uC. MSnspectra were collected at 50 scans each and normalized collision energy was set to 30%. Analyses were performed in triplicate.
Calculation of substructure abundances
The bus-4 and N2 glycans were analyzed under identical conditions allowing for direct comparison of spectral attributes. Based on relative abundances of compositions from MALDI-TOF MS and of unique daughter ion abundances from ion trap analyses produced from isomers within each composition an apparent abundance of each of the following substructures was calculated. Shown in parenthesis are the unique daughter ions used in the calculations: Glcb1-4,6 (m/z 463.3), Glc/Galb1-6GalNAc (m/z 502.3), Glcb1,4GalNAc (m/z706.5); GlcA1,4GalNAc (m/z720.5); Glcb1,3Gal (m/z681.4+m/z885.5). Analyses were performed in triplicate and overall standard deviations calculated. Results are reported in mol/mol of core-I saccharide.
GC/MS
O-glycans were aliquotted and dried with an internal standard of myoinositol in 2 ml heat resistant screw cap glass vials. Samples were prepared following the method of Kamerling et al.,(1975) [19]. In brief, 400ml 1N Methanolic-HCL (diluted from Supelco cat. no. 3-3051 with anhydrous methanol) was added to each sample under nitrogen and tightly sealed. The samples were incubated in a shaking (350 rpm) heat block for 24 hours at 80uC. Solid silver carbonate was added until the samples were neutralized as monitored by pH paper. Acetic anhydride (40ml) was then added and the samples were incubated at room temperature in the dark overnight. The next day, the samples were thoroughly mixed and the precipitates pelleted by centrifu-gation. The supernatants were saved and the precipitates were washed twice with 500ml anhydrous methanol. The supernatant and the washes from each sample were pooled and dried by rotary evaporation. Tri-Sil HTP reagent (Thermo cat. no. TS-48999) (25ml) was added to the dried samples under nitrogen and they were incubated at room temperature for thirty minutes. Finally, 50ml hexane and 5ml of dry hexane-washed Sephadex (as prepared by Elwood et al. 1988) [20] were added. The samples were vortexed, centrifuged and the Sephadex pellet removed. Approximately 40-50ml of liquid was transferred to the GC/MS sample vial. Standard mixtures of four to six carefully weighed control monosaccharides were prepared in the same manner and included the same internal standard.
(Models 7890A and 5975C) equipped with a GC Sampler 80. The inlet temperature was 300uC and the oven temperature was 80uC. After a 2 minute pause, the oven temperature ramped to 180uC at a rate of 20uC/min and was held at 180uC for 23 minutes. The carbohydrate abundances in each sample were calculated as described by Elwoodet al. [20].
Lectin staining of acetone fixed nematodes
Whole worm mounted lectin staining was performed as previously described by Borgonie and Driessche [21], with some modifications. Briefly,C. eleganswere rinsed from NGM culture plates with 15 mls of M9 buffer by slow swirling and this was repeated two times. The volumes were combined and allowed to stand at room temperature for 1 h to allow digestion and expulsion of intestinal contents. After three washes with M9 buffer 1 ml of ice cold acetone was added to the worms and the solution was placed on ice for 2 minutes. C. elegans were rehydrated with sequentially washing with 80, 60, 40 and 20% acetone and finally with PBS. Then 50ml of 10mg/ml of FITC or Texas Red conjugated lectins suspended in PBS, 0.5% triton X-100 and 0.05% NaN3was added and the slurry was incubated at
4uC for 12 h with gentle rocking. To 10ml of the stained worm solution was added 10ml of 1 mg/ml of paraphenylene diamine in Citifluor solution (Sigma) then mounted on washed and dried poly L-lysine slides. FITC conjugatedUlex eropaeus I(UEAI),Triticum vulgare (WGA), Agaricus bisporus (ABA), Anguilla anguilla (AAA), Galanthus nivalis (GNA) (EY Laboratories) lectins were used in this study except for experiments depicted in Figure 1 where an ABA Texas Red conjugate was used. The microscope used was an Axiovert 100 TV (Zeiss, Germany) equipped with iVision software (BioVision Technology). Percent staining for ABA lectin was performed as follows: One hundred to one hundred and twenty individuals each of N2 andbus-4nematodes were observed and scored based on diminished staining in the triangular region emanating from the anus to the tail region. See Figure S1 in supporting information for an example of this region.
Lectin staining of live nematodes
For each strain, L4 and young adult worms were washed from NGM plates with M9 buffer and allowed to settle to the bottom of a 1.5 mL tube. Settled worms (50mL) were mixed with 10mL Texas Red labeled ABA or FITC labeled UEA-1 (1mg/ml), 50mL of E. coli (200 mg/ml) and 140mL M9 buffer and rocked in the dark at room temperature for 24 hours in a Costar cluster plate (24 well size). After 24 hours, the samples were removed from the wells and washed two times with M9 buffer by centrifugation (300
6g for 1 min). For shorter ABA staining experiments, L4 and young adult worms were washed from NGM plates and allowed to settle to the bottom of the tubes. Three microliters of worms were mixed with 0.5ml ABA lectin (1 mg/ml), 6.5ml 500 mM GalNAc, and 15ml M9 buffer and rocked at room temperature. For all staining experiments pelleted worms (10mL) were mixed with 15ml of sodium azide (20 mM) on a glass slide, covered with a glass coverslip, and photographed with an Olympus SX16 fluorescence microscope equipped with a DP72 camera. Camera settings were the same for all samples. ImageJ [22] was used to measure the mean fluorescence intensity of the head prior to the metacorpus, the tail beyond the anus, and a 3 pixel (2mmeter) line through the center of the intestine beginning after the terminal bulb and ending prior to the rectum.
ABA lectin binding of C. elegans glycopeptides
1.5 mg of C. elegansprotein was reduced with dithiothreitol, alkylated with iodoacetamide and trypsinized with TPCK trypsin
in phosphate buffer (pH 7.5) at 1:50 trypsin to protein ratio overnight at 37uC. The digested protein, in 70% acetonitrile 0.1% trifluoroacetic acid, was then applied to a 400 mg Amide-80 (Tosoh, Japan) column equilibrated to 80% acetonitrile 0.1% trifluoroacetic acid. The column was then washed extensively with 5 one milliliter volumes of 80% acetonitrile 0.1% trifluoroacetic acid. Glycopeptides were eluted sequentially with one milliliter each of 60% acetonitrile 0.1% trifluoroacetic acid, and 40% acetonitrile 0.1% trifluoroacetic acid. The fractions were com-bined, vacuum rotary evaporated and the glycan assessed using the phenol sulfuric assay for neutral hexose. An aliquot was removed for control and the remainder of sample applied to a one milliliter column of ABA lectin (EY Laboratories). The sample was allowed to incubate in the column bed for 30 minutes. Five one milliliter volumes of 10 mM phosphate buffer (pH 7.5) were applied to the column and the run through collected. A one milliliter volume of 100 mM b-methyl galactoside was applied to the column and Figure 1. Lectin staining patterns of fixedbus-4nematodes are altered. Texas Red-conjugated Agaricus bisporus (ABA) Gal (b1,3) GalNAc specific lectin staining of whole mounted delipidated and liveC. elegans strains are shown. A: the left columns shows differential interference contrast (DIC) micrographs and right columns show fluorescence micrographs of ABA stained fixed nematodes with and without prior incubation with inhibitory sugar (b-D-galactose). Top panels are N2 Bristol. Bottom panels arebus-4. B; Shorter exposures of ABA lectin are shown along with DIC micrographs to the left. Cuticle staining seen in the ventral tail region leading up to the anus in the N2 parent is absent in thebus-4strain. C; Live ABA stained nematodes are shown. The surface coat of thebus-4nematodes stains more intensely than in the N2 parent. The staining is most concentrated in the head and tail regions. Staining in the intestine is also increased abundances of soluble mucin-like proteins are indicated.
incubated for 30 minutes. Two more volumes of the b-methyl galactoside solution were added to the column and the eluate collected. Control, run through and eluate fractions were vacuum rotary evaporated and subjected to b-elimination as previously described. The released O-glycans from each fraction were permethylated and analyzed by MALDI-TOF MS.
Results
bus-4 contains conserved domains of core-1b1,3 galactosyltransferases
The bus-4 gene, designated as T22B11.2 (WB gene ID WBGene00020676), is located on chromosome IV. A BLAST search of the NCBI database using the predicted 368 amino acid Bus-4 protein showed it to have a high degree of conservation (expect value: 7e-8) with Pfam01762, a predicted galactosyltrans-ferase family containing a high number of UDP-Gal:b-GlcNAc b1,3- and UDP-Gal: b-GalNAc b1,3- galactosyltranferase (b 3-Gal-T) homologs.Bus-4has 29–35% identity with putative core1 b3-Gal-T enzymes such as the Zebra fish core1b3-Gal-T (Gene ID 5577675) homolog. They share 35% identity with an expect value of 1e-29. It is also closely related toC. elegansgene C38H2.2 (BLAST score 2e-34 relative tobus-4) [8], which is an ortholog of human T-synthase and has demonstrated core 1 O-glycan synthetic activity by catalyzing the addition of Gal to Gal-NAca1-Ser/Thr glycopeptide in vitro [23]. BUS-4 and the members of this family share the conserved motifs VKXTW, GXGYV(I)XS, and DLXXG which have been reported in the human core 1b1,3-galactosyltransferase (T-synthase) [24] and are conserved in this transferase family. AdditionallyBUS-4contains a DXD motif, which is conserved in 13 glycosyltransferase families [25]. While these data cannot predict enzymatic activity they do provide evidence thatbus-4encodes a glycosyltransferase that may be active in core-1O-glycan synthesis.
Lectin studies in fixed and live nematodes
A panel of lectins was used to characterize the cellular surfaces and surface coat of the N2 andbus-4nematodes. Both surface coat and cell surface glycoconjugates interact with the external environment. As the majority of glycosylation activebusmutants are expressed in tissues that support the cuticle, intestine, and surface coat our rational was to characterize these regions for gross glycoconjugate expression. The surface coat servers as a barrier to predation and, therefore, any changes could contribute towards the observed bacterial resistance. Likewise, glycoconjugates at the cuticle, intestine, including the anus and rectum, may be involved in surface recognition or delivering cues to bacterial pathogens. These studies allowed us to characterize and better localize glycomics changes, which were further investigated through chemical structure analysis.
Fixed nematodes. A panel of lectins was used to examine the characteristics ofC. eleganscell surfaces. Fluorescent staining of whole mounted acetone-fixed nematodes was performed with the following FITC or Texas Red conjugated lectins: Galb 1,3-GalNAc specific, Agaricus bisporus (ABA), a-L-fucose specific Ulex europaeus I (UEA I) and Anguilla anguilla (AAA), b 1,4-GlcNAc specificTriticum vulgare(WGA), and Mana1-3,6 specific Galanthus nivalis (GNA). The specificity of each lectin was verified by preincubation of the lectins with an inhibitory concentration of the corresponding sugar prior to incubation with theC. elegans strains. A minimum of 100 nematodes per strain were examined in each experiment. Mannose specific GNA lectin staining of the cuticle surface was appreciably brighter over the central and distal portion of the cuticle of thebus-4strain (Figure
S17). UEA I (a-L-fucose) staining in the tail region and intestine of thebus-4mutant was also appreciably brighter (Figure S18). Little or no differences were observed with, WGA (GlcNAc), or AAA (a -L-fucose) lectin staining (Figures S19 and S20).
There was a striking difference in Galb1,3GalNAc ABA lectin staining as shown in Figure 1. This lectin detects the above core-1 disaccharide in mammalian samples andCecore-IO-glycans inC. elegans as previously described [13]. The fluorescence intensity was much lower in the bus-4 mutant over the surface of the acetone fixed cuticle. This was especially so in the tail region indicating that theCecore-IO-glycan epitopes were diminished at the cuticle surface and notably so in the region that M. nematophiluminfects in wild type nematodes (see Figure S1). This pattern was similar to that observed in bus-2 nematodes [13]. Reduced ABA staining intensity was observed in greater than 90% of observedbus-4nematodes. Staining was more intense in some bus-4juveniles but never approached the intensity seen in the wild type counterparts. Glycolipid is not a likely source of signal as these preparations were delipidated through the acetone fixation process. To confirm that the loss of ABA staining in the bus-4 background wasbus-4dependent a wild typebus-4transgene was introduced and the rescued strain was compared to both N2 wild type andbus-4deficient strains as shown in Figure 1. The rescued strain (CB6817) regained ABA staining over the cuticle surface and the staining was especially intense in the tail region, a pattern that was nearly identical to that of the parent N2 strain.
Live nemotodes. When we determined the amount of N -andO-glycans released frombus-4and N2 Bristol nematodes we found that the amount ofN-glycans released per gram of worms was nearly equivalent for the two strains (N2 = 146mg/g; bus-4 = 156mg/g). However, the bus-4 O-glycans were twice as abundant as those from N2 Bristol (N2 = 1.2 mg/g;bus-4 = 2.4 mg/g). The lectin studies described previously were performed under acetone fixed conditions in the absence of cross-linking reagents, allowing removal of soluble components. To assess glycoproteins of the surface coat and other soluble components that could contain Ce core-I glycoproteins, such as mucin-like proteins, we performed ABA lectin staining studies of live nematodes. As shown in Figure 2A, ABA stains the entire surface coat more strongly in live bus-4 nematodes compared to N2 nematodes, and especially so in the head and tail regions. Head region average pixel intensity for N2 was 24.164.1 SD and that forbus-4was 52.7610.1 SD. Tail region average pixel intensity was 10.4 6 4.4 SD for N2 and 25.5 6 12.0 SD for bus-4 respectively. Staining was more than twice as intense in both of these areas in thebus-4strain. The average pixel intensity in the intestine of nematodes fasted for one hour was also slightly increased but the difference was not statistically significant. Staining was also seen in both strains in the region of the pharynx and most prominently in the posterior bulb. These data show that C. elegans bus-4mucin glycoprotein abundance and distribution are dramatically altered. However, it cannot be ruled out that some staining intensity may be contributed from glycolipid.
ABA lectin binds C. elegans O-glycopeptides
To test the specificity of the ABA lectin inC. elegansN2 Bristol and bus-4 glycopeptide extracts were subjected to ABA lectin affinity column analysis. Glycoprotein extracts were reduced, alklyated with iodoacetamide, and trypsinized. The mixture was subjected to amide 80 solid phase extraction yielding eluate enriched in C. elegans hydrophilic glycopeptides. Glycopeptides were used rather thanb-eliminated free glycans as the former are known to have higher binding affinity to this lectin [26]. The enriched fractions were then applied to ABA lectin columns, washed extensively with 10 mM phosphate buffer, and the bound species eluted using 100 mM b-methyl galactoside. Control (Amide-80 eluted glycopeptide), ABA column run through, and eluate were dried and subjected to b-elimination as previously described (see Materials and Methods). Glycans released by b -elimination were polished with porous graphite solid phase extraction columns and permethylated. MALDI-TOF MS exper-iments were performed on all fractions.
MALDI-TOF MS permethylated glycan profiles from control sample, ABA flow through, and elution fractions for the N2 and bus-4derived glycans are shown in Figure S2. Control is shown in panels A and D (b-eliminated Amide 80 enriched fraction), the flow through in the center panels B and E, and the b-methyl galactoside eluated fractions in panels C and F. The control shows the presence of the major Ce core-I O-glycans (Hex3HexNAc,
Hex4HexNAc, and HexA1Hex3HexNAc are shown), and some
polyhexose (Hex5 and Hex6 are shown) a common C. elegans
glycan preparation contaminant. The flow through contained primarily the polyhexose glycans. The eluate from both strains containing glycans that bound to the ABA lectin, included the major Ce core-I O-glycans Hex3-4HexNAc1, and HexA1Hex3
-HexNAc. These data demonstrate that the ABA lectin recognizes theCecore-IO-glycans from both N2 andbus-4nematodes.
Analysis of O-glycans
O-glycans were released byb-elimination, permethylated and analyzed by MALDI-TOF MS. Thebus-4 O-glycan compositions detected in this study are shown in Table 1 and select ones in Figure 3. TheO-glycans ofC. eleganscan be placed into four sub-groups, (i) neutralCecore-I, (ii) acidicCecore-I, (iii) fucosylated neutral, and (iv)Cecore-II (also highly fucosylated). These forms have been previously described [14,27–29].
Histograms of glycan compositions produced from three MALDI-TOF MS replicates are shown in Figure 4A (Cecore-I neutral and charged, and fucosyl) and Figure 4B (Cecore-II). The combined intensities in each subclass are shown in Figure 4C. Error bars express 1 SD. Representative spectra are shown in Figure S3. Relative percentages of wild typeC. elegans Cecore-I neutral glycans were 52%,Cecore-I charged forms 39%, neutral fucosyl forms 7%, andCecore-II glycans less than 4% of the total O-glycans. Inbus-4nematodes higher levels ofCecore-I neutral, 63% (q25%), fucosylated neutral, 9% (q28%), andCe core-2, 7% (q60%) were detected. Lower levels of theCecore-I charged O-glycans, 20% (Q52%) were observed.
GC/MS analysis of C. elegans O-glycans
N2 and bus-4 O-glycan monosaccharides were analyzed in triplicate by GC/MS as their trimethylsilyl derivatives. Compar-isons of monosaccharide abundances are shown in Figure 4D. Compared to monosaccharides derived from N2O-glycans, those from bus-4nematodes contained significantly lower amounts of Glc (Q31%) and higher amounts of Gal (q26%) and Fuc (q56%). GlcA abundances in the two O-glycan pools were similar. Noting that larger glycans ionize more efficiently than smaller ones in MALDI-TOF MS analysis, this result in thebus-4 monosaccharide profile is likely reflective of a counter balancing between an increase in Ce core-II and decrease in Ce core-I charged glycans, both of which contain GlcA. Increases inbus-4 fucosyl glycoforms, the neutral fucosyl andCecore-IIO-glycans are also reflected in the monosaccharide analysis results. Low abundance GlcNAc, Man and Xyl peaks were also detected likely from residual high mannoseN-glycans for the former and trace glycosaminoglycans for the later due to imperfect enzymatic release and purification respectively. Core GalNAc-ol was detected only in trace amounts as the sugar alcohols are less stable than reducing sugars under the conditions of analysis used here.
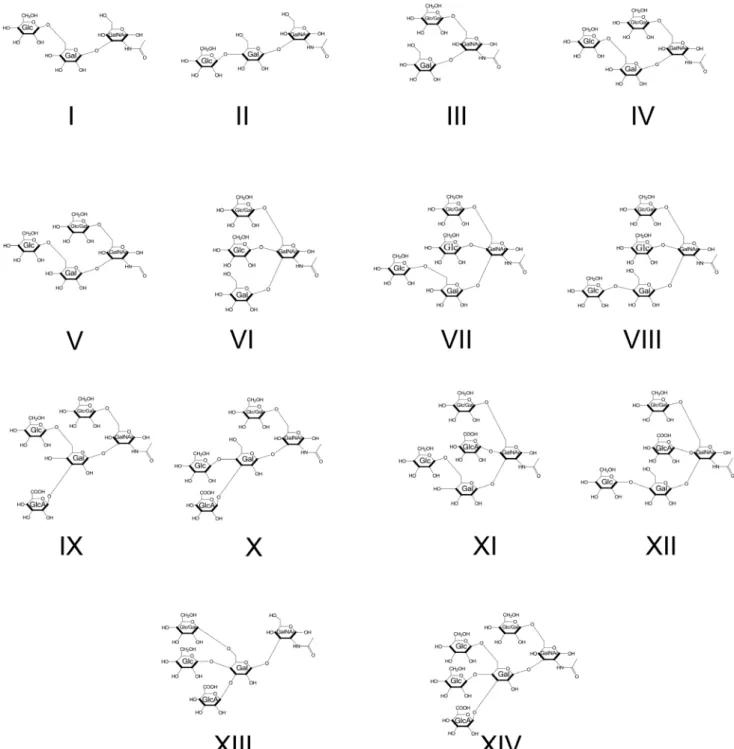
Tandem MS analysis of permethylated O-glycan isomers To further investigate theO-glycan pools, comparative tandem MS analysis was performed on matched N2 Bristol and bus-4 derived glycans samples. Individual compositions were analyzed for differences in isomer distributions. No differences were seen in fragment ion abundances in matched neutral fucosyl orCecore-II glycan isobars. However, fragment ion abundances from matched Cecore-I glycan isobars, both neutral and charged forms, differed significantly. Key differences are highlighted below. The derived glycan structures are shown in Figure 3. We add that theO-glycan structures derived in the present study are in agreement with those reported in the pioneering work of Guerardelet al., [29] and our later investigations [14,30]. Anomeric configurations and mono-saccharide identities are inferred from the Guerardel et al., study as supported by the data contained herein. As the previous studies were not exhaustive, related glycans of intermediate size and configuration can be expected and these were found in the present Figure 2. Lectin staining patterns of livebus-4nematodes are
altered.N2 and bus-4 nematodes were stained with FITC conjugated
Agaricus bisporus(ABA) Gal (b1,3) GalNAc specific (panel A) andUlex europaeus(UEA-I)a-L-Fuc specific (panel B) lectins. ABA staining inbus-4
is more intense over the surface coat and most dramatic in the head and tail regions. UEA-I staining inbus-4is more intense in the hind gut, anus and rectum.
study. Additionally we found a GlcA substitution that is in addition to the one previously reported, which will be described later. Note that fragment ion peaks are identified using the established standard nomenclature of Domon and Costello [31] in MS2 spectra (Figures 5, 6, 7, S9 and S14). The MS3fragment ion peaks shown in spectra in supporting information figures (Figures S4-S8 and S11-S15) are identified numerically based onm/zof daughter ions for simplicity to aid in understanding of the structural assignments presented in the figures.
The MS2spectra of the permethylated N2 (left) andbus-4(right) derived Hex2HexNAc1, m/z 738.6 [M+Na]+, are shown in
Figure 5. The fragmentation pattern indicated the presence of
three distinct configurations identified as Structures I, II and III in Figures 3 and 5. There was considerably more fragment ion abundance atm/z 502.33 in the bus-4 Hex2HexNAc1spectrum.
The ion abundances atm/z502.33 from both N2 andbus-4were subjected to MS3analysis. The spectra are shown in Figure S4. The daughter ion patterns were consistent with a Hex1,6HexNAc-configuration in both the N2 andbus-4. The rational for structural assignment is presented in the figure. The MS3spectra from them/ z 502.33 daughter ions from each strain contained the same daughter ionm/zvalues but they differed in their abundances. This can occur when there is a difference in monosaccharide components even when linkage configuration is the same [32]. Figure 3. The structural configurations of theCecore-IO-glycans defined in this study are shown.
We concluded that there was likely a difference in the ratio of Glcb1,6 to Galb1,6 at the core GalNAc residue in the N2 and bus-4 derived Hex2HexNAc1 pools. Both of these substitutions have
been previously documented [29]. Ion abundances atm/z463.33 were also investigated by MS3 analysis (Figure S5). This ion contains the Glcb1,4Gal and Glcb1,6Gal portions of Structures I and II. Evidence for both configurations was present. The rational for structural assignment is presented in the figure. In summary, abundances of Structures I and II were lower in thebus-4pool. As only Structures I and II contain terminal Glcbsubstitution of the core Gal, less of these were present in thebus-4 Hex2HexNAc1
pool. Structure III was more abundant inbus-4 O-glycans and the ratio of Glcb1,6 and Galb1,6 at the core GalNAc residue was likely altered.
The MS2analysis of N2 and bus-4Hex3HexNAc1,m/z 942.6
[M+Na]+
are shown in Figure 6. Three structural configurations were detected and are shown as Structures IV, V and VI in Figures 3 and 6. More than twice the ion abundance of them/z 706.5 daughter ion was detected in the bus-4glycan spectrum. The MS3 fragmentation pattern of m/z 706.5 from both glycan
sources was identical. The spectra derived structure and rationale are shown in Figure S6. Them/z706.5 ion arises from Structure VI and is produced after loss of the Galb1,3- arm linked to the core GalNAc. These data show that more of Structure VI is present in the bus-4 O-glycan pool. MS3 of N2 and bus-4 m/z 502.3 ions produced essentially identical patterns as shown in Figure S7 showing the presence of Hex1,6GalNAc in both strains. The rationale for the structural assignment is shown in the figure. Therefore the ratio of Glcb1,6GalNAc and Galb1,6GalNAc moieties in Structure IV and V in the N2 and bus-4 Hex3HexNAc1 pools were essentially the same. Ion abundance atm/z463.33 was also investigated by MS3analysis (Figure S8). This ion contains the Glcb1,4Gal and Glcb1,6Gal component of Structures IV and V. Evidence for both linkage configurations was present. The spectra derived from both strains’ glycans were essentially identical. Therefore no differences in the ratio of Glcb1,4Gal and Glcb1,6Gal were seen in IV and V. The major difference seen in thebus-4Hex3HexNAc1pool was an increased
abundance of Structure VI and less of Structures IV and V. As a Table 1.Composition ofC. eleganspermethylatedO-glycans released from N2 wild type and the mutant strainbus-4determined by MALDI-TOF MS analysis.
Measuredm/z Calculatedm/z Compositiona
534.15 534.29 Hex1HexNAc1
708.32 708.38 dHex1Hex1HexNAc1
738.36 738.39 Hex2HexNAc1
752.34 752.40 Hex1HexNAc1HexA1
912.51 912.48 dHex1Hex2HexNAc1
926.43 926.49 dHex1Hex1HexNAc1HexA1
942.53 942.49 Hex3HexNAc1
956.51 956.50 Hex2HexNAc1HexA1
1116.66 1116.58 dHex1Hex3HexNAc1
1130.51 1130.59 dHex1Hex2HexNAc1HexA1
1146.68 1146.59 Hex4HexNAc1
1160.66 1160.60 Hex3HexNAc1HexA1
1320.77 1320.68 dHex1Hex4HexNAc1
1332.72 1331.69 dHex2Hex2HexNAc2
1334.78 1334.69 dHex1Hex3HexNAc1HexA1
1345.74 1345.71 dHex2Hex1HexNAc2HexA1
1364.71 1364.70 Hex4HexNAc1HexA1
1375.73 1375.72 dHex1Hex2HexNAc2HexA1
1494.88 1494.77 dHex2Hex4HexNAc1
1549.92 1549.81 dHex2Hex2HexNAc2HexA1
1579.97 1579.82 dHex1Hex3HexNAc2HexA1
1699.01 1698.87 dHex2Hex5HexNAc1
1724.03 1723.90 dHex3Hex2HexNAc2HexA1
1928.12 1928.00 dHex3Hex3HexNAc2HexA1
2102.22 2102.09 dHex4Hex3HexNAc2HexA1
2306.98 2306.19 dHex4Hex4HexNAc2HexA1
2480.73 2480.28 dHex5Hex4HexNAc2HexA1
2510.38 2510.29 dHex4Hex5HexNAc2HexA1
2685.12 2684.38 dHex5Hex5HexNAc2HexA1
aAll ion compositions detected as sodium adducts
result, less terminal Glcbsubstitution of core Gal was present in thebus-4Hex3HexNAc1pool.
The N2 and bus-4 Hex4HexNAc1 ion abundances at m/z
1146.70 [M+Na]+ were examined by tandem MS. All matched
tandem MS spectra from thebus-4and N2 derived glycans were essentially identical (Figure S9). The data were consistent with the derived configurations shown as VII and VIII shown in Figure 3. No evidence for a difference in configuration was seen in the Figure 4. MALDI-TOF MS permethylation profiling of N2 andbus-4O-glycans.Histograms represent the average of three independent analyses. Light gray histograns are N2 and black arebus-4. Sample spectra are shown in Figure S3. Error bars represent one standard deviation. A: Relative quantitation of Ce core-I neutral, Ce core-I charged and fucosyl glycoforms, B; Relative quantitation of Ce core-II glycoforms, C; Relative abundances ofO-glycan subclasses, D; GC/MS monosaccharide abundances detected in this study
Hex4HexNAc1 pools. However, as shown in Figure 4A, this
composition is increased 32% in abundance in thebus-4 O-glycan pool as seen by MALDI-TOF MS analysis.
MS analysis of the matched N2 andbus-4chargedCe core-I glycans also revealed differences in isomer distribution. The spectra resulting from MS2 decompositional analysis of HexA1
-Hex3HexNAc1, m/z 1160.7 [M+Na]+, (diminished by ,40%, in
bus-4) are shown in Figure 7. Based on the MS2and subsequent
MS3 decompositional analysis there were five configurations
present as shown in Figure 3 and 7 as Structures IX through XIII. More ion abundance was seen atm/z 681.42 in thebus-4 HexA1Hex3HexNAc1spectrum. This ion abundance can only
arise from Structures IX and X. MS3comparisons of this fragment
derived from the N2 andbus-4are shown in Figure S10. Note in this figure that the position of GlcA substitution in Structures IX and X is defined at C3 of the Core Gal in agreement with that
reported previously [29].The spectra were virtually identical indicating that the Glcb1,4(GlcAb1,3)Galb- and Glcb1,6(Glc Ab1,3)Galb- portions of IX and X were the same in N2 and bus-4even though the two configurations were proportionately increased in thebus-4HexA1Hex3HexNAc1pool. Them/z502.3
daughter ion in Figure 7 was substantially increased in abundance in thebus-4glycan spectra as well as it also can only arise from IX and X. MS3 of the matched pair verified it to arise from the Hex1,6GalNAc portion of Structures IX and X (Figure S11). However the spectra were different in daughter ion abundances showing that the ratio of Glcb1,6/Galb1,6 substitutions at the core GalNAc were likely different in IX and X between the two strains as seen previously for Structure III. The presence of Structures XI and XII were confirmed by MS3analysis of ion abundances atm/z 720.5, which identified the Hex1,6(Glc1,4)GalNAc moiety (see Figure S12). The presence of Structure XIII was confirmed with Figure 5. The CID MS2analysis of matched N2 andbus-4permethylated Hex
2HexNAc1-ol atm/z738.6 [M+Na]+.Data were collected under identical conditions using a Thermo LTQ-XL ion trap equipped with an Advion Nanomate sample infusion system. Three predicted isomeric structures (I, II and III) are represented. The origin of key fragment ions are shown. Structures I and II differ only by the position of the substituent Glc at either C4 or C6 of the partner Gal residue as indicated by the dashed line. See Figure 2 for inferred monosaccharide identities.
MS3 fragmentation ofm/z885.5. The spectra and rational can be seen in Figure S13. Ions specific for Structure XIII were low in abundance in both strain derived pools. Overall in bus-4 Structures IX and X were increased, XI and XII were decreased and the amount of XIII was similar compared to those of N2. Ratios of Glcb1,6/Galb1,6 substitutions at the core GalNAc likely differed and, based on MALDI-TOF MS analysis, the HexA1
-Hex3HexNAc1pool was diminished by 40% in thebus-4 O-glycan
pool (see Figure 4A). Structures IX and X, and XI and XII differ
in the position of GlcA substitution. The former two, Structures IX and X, are GlcA substituted at C3 of the core Gal whilst Structures XI and XII are GlcA substituted at C4 of GalNAc. These changes shift the diminished HexA1Hex3HexNAc1 pool
strongly toward the GlcAb1,3Gal substitution. We note that the GlcA substitution at C4 of core GalNAc has not been previously reported. See Figure S12 for the rational of structural assignment. The N2 and bus-4 derived HexA1Hex4HexNAc1 MS2, m/z
1364.8 [M+Na]+, fragmentation patterns were essentially identical Figure 6. The CID MS2analysis of matched N2 andbus-4permethylated Hex
3HexNAc1-ol atm/z942.6 [M+Na]+.Data were collected under identical conditions using a Thermo LTQ-XL ion trap equipped with an Advion Nanomate sample infusion system. Three predicted isomeric structures (IV, V and VI) are represented. The origin of key fragment ions are shown. Structures IV and V differ only by the position of the substituent Glc at either C4 or C6 of the partner Gal residue as indicated by the dashed line. See Figure 2 for inferred monosaccharide identities.
(Figure S14). This composition was diminished,80% in thebus-4
O-glycan pool as shown in Figure 4. We investigated them/z502.4 fragment ion abundance for evidence of Glc1,6-/Gal1,6- GalNAc substitution distribution shift. Again we observed differences in this fragment’s daughter ion abundances consistent with a shift in Glcb1,6-/Galb1,6-GalNAc substitution ratio (Figure S15). The major differences in thebus-4HexA1Hex4HexNAc1composition
was an altered presumptive ratio of Glcb1,6-/Galb1,6 on core GalNAc and an 80% decrease in relative abundance of this composition in thebus-4pool.
The abundances of specific structural components in thebus-4 and N2Cecore-IO-glycan pools were compared. The apparent %
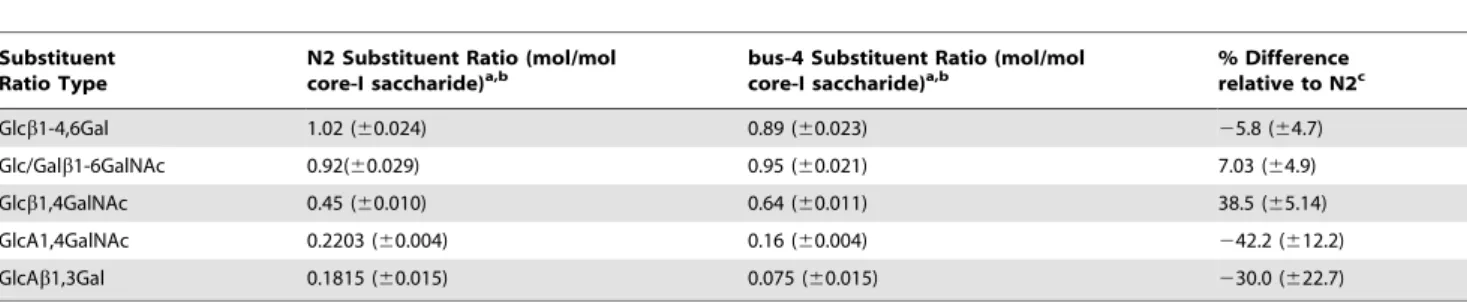
difference of each structural component was calculated based on Ce core-I pool composition abundances from quantitative MALDI-TOF MS, and key isomer fragment ion abundances, from ion trap decompositional analysis, (see Material and Methods). Results of this comparison are shown in Table 2. Differences in bus-4 relative to N2 (reported to 1SD) were as follows: Hex1,4 substitution of core GalNAc was increased 38.5% (65.14), GlcA1,4 substitution of the core GalNAc was decreased 42.2% (612.2) and GlcAb1,3 substitution of core Gal was decreased by 30% (622.7). Glcb1-4,6 terminal substitutions of core Gal were decreased 5.8% (64.7), Glcb1,6/Galb1,6 substitu-tion of core GalNAc was increased 7.0% (64.9).
Overall the bus-4 Ce core-I O-glycan pool is dramatically altered. The bus-4 Ce core-I O-glycans’ charged residues were reduced by half compared to the N2 parent strain. The remaining GlcA structural distribution is shifted away from C4 of core GalNAc and towards C3 of core Gal. The terminal substitutions are also shifted. The amount of bus-4 O-glycan material was doubled compared to the parent strain when measured as milligrams of saccharide per gram wet weight of nematode material The bus-4 strain yielded 2.39 mg/g versus N2 which yielded 1.17 mg/g.
Analysis of N-glycans
C. elegans N-glycans were released sequentially using PNGase F followed by PNGase A. PNGase F will not release glycans modified with Fuca1,3 substituted reducing end GlcNAc while PNGase A will do so [33,34]. Using this sequential release strategy it is our experience that the majority ofN-glycans are released by PNGase F while a minority are released by subsequent PNGase A treatment. Performed in this way the PNGase A pool can be enriched in fucosyl forms (see Figure S16). Glycans were permethylated and analyzed in triplicate by MALDI-TOF MS. Thebus-4glycans were compared with those of N2 Bristol. A list of theN-glycan compositions detected in this study are shown in Table S1.
Thebus-4and N2N-glycan PNGase F released pools MALDI-TOF MS relative abundances were examined. High mannose and pauci mannose glycoforms were increased ,10% and ,4% of
total abundance respectively in the bus-4 derived pool (Figure S15A) consistent with increased cuticle GNA lectin staining patterns observed in acetone fixed bus-4nematodes. There was a decreased abundance of Hex4-7HexNAc4mammalian-like and
fucosyl glycoforms in thebus-4sample PNGase F pool. (see Figure S15B and Figure S21). It should be noted that the majority of fucosyl glycoforms are released in the subsequent PNGase A pool. We further analyzed the PNGase FN-glycans as 2-aminobenza-mide derivatives by LC/MS ion trap analysis. No additional differences were detected in any glycoforms including isomer distributions.
The PNGase A released pool ofbus-4contained a 15% higher relative abundance of fucosylN-glycans relative to N2 as shown in Figure S16 and S22. Fourteen fucosyl glycan compositions were detected (see Table S1). Among those, eleven were between 3-50% more abundant in thebus-4pool. As PNGase A and not PNGase F releases Fuca1,3 core substituted N-glycoforms this was considered significant. A small amount of high mannose and complex (mammalian-like) glycans were also released due to incomplete release by PNGase F. As the PNGase A pool contained
only 10% of total N-glycans these small differences were not considered significant.
Glycomics expression analysis
qPCR analysis was performed on key enzyme and glycoprotein transcripts involved in glycoconjugate synthetic pathways Tran-scripts ofgmd-2,osm-8andlet-653,bus-2,bus-8,gly-11andlipl-1 were analyzed (see Materials and Methods). In comparison to N2 only gmd-2, osm-8 and let-653 were greatly upregulated whilst bus-2 (2.1 fold), bus-8 (2.6 fold), gly-11 (1.5 fold), and lipl-1 (2.0 fold), were essentially unaltered or only mildly upregulated. Figure 8 shows the fold change expression in key upregulated genes. The bus-4 GDP-Man 3,5 dehydratase expression was dramatically increased 110610 fold. This enzyme catalyzes the committed step in conversion of GDP-Man to GDP-Fuc, the donor substrate in the synthesis of fucosyl glycoconjugates These data are consistent with the increases in fucosyl glycoforms observed in both theN- andO-glycan pools. Also increased were osm-8andlet-653, two key mucins inC. elegans. Both of these were increased 3664 and 3964 fold.
Discussion
The bus-4 strains were isolated in genetic screens for altered susceptibilities toM. nematophilum, Y. pestis andY.
peudotuber-Table 2.Substitution ratios ofbus-4 Cecore-I glycans differ from wild type.
Substituent Ratio Type
N2 Substituent Ratio (mol/mol core-I saccharide)a,b
bus-4 Substituent Ratio (mol/mol core-I saccharide)a,b
% Difference relative to N2c
Glcb1-4,6Gal 1.02 (60.024) 0.89 (60.023) 25.8 (64.7)
Glc/Galb1-6GalNAc 0.92(60.029) 0.95 (60.021) 7.03 (64.9)
Glcb1,4GalNAc 0.45 (60.010) 0.64 (60.011) 38.5 (65.14)
GlcA1,4GalNAc 0.2203 (60.004) 0.16 (60.004) 242.2 (612.2)
GlcAb1,3Gal 0.1815 (60.015) 0.075 (60.015) 230.0 (622.7)
aTotal molar ratios differ slightly from those reported in Figure 2 as these are calculated only on Ce core-I glycans examined through exhaustive MSnand not the total O-glycan pool as seen in Figure 2.
bFigures present in parentheses represent 1SD. cFigures in parentheses represent 1SD expressed in %.
doi:10.1371/journal.pone.0107250.t002
Figure 8. Quantitative RT-PCR analysisosm-8,let-653andgmd-2 gene expression: Larval stage L4 of C. elegans larval stage 4 wt (N2) and bus-4 nematodes were analyzed as biological triplicates. Data were presented as relative DCts values and normalized to the N2 samples. Error bars represent6SEMs.
culosis. The bus-4 gene shows strong conservation with the galactosyltransferase Pfam01762, which contains a high number of UDP-Gal:b GlcNAcb1,3 and UDP-Gal:bGalNAcb1,3 galato-syltransferases, active respectively in the synthesis of the lacto series oligosaccharides types 1 and 2, and Galb1,3GalNAc core-1 and core-2 O-glycans [8]. Studies of the predicted protein sequence strongly suggests thatBUS-4is a glycosyltransferase that may have a similar activity to members of this glycosyltransferase family.
We have compared the protein glycosylation profile of thebus-4 reference strain to that of its parent strain N2 Bristol. The most dramatic changes were seen in the Ce core-I O-glycans which contain the conserved Gal b1,3GalNAc core seen in higher eukaryote core-1 and core-2O-glycans [35].C. elegans Cecore-I glycans differ from the mammalian counterparts significantly. In mammalsO-glycans are capped with sulfate, sialic acids and Fuc or can be elongated such as with LacNAc extensions and blood group class modifications [35,36]. InC. elegans Cecore-I glycans there is little evidence of extension. Rather, the Galb1,3GalNAc core can be decorated with terminal substitutions of Glc, Gal, Fuc and GlcA. Rather than sialic acids or sulfate,C. elegansuses GlcA as its charge group. No evidence of sulfation of any of itsO-glycans has been reported except for the heparans [37]. In the present study theCecore-I glycans are shown to be theC. elegansmucin O-glycans and in thebus-4mutants these are dramatically altered as was the expression of two key mucins glycoproteins,let-653and osm-8.
We observed greatly altered mucin glycoprotein distributions in the bus-4surface coat, the underlying cuticle, intestine and the pharynx (Figures 1 and 2). Since bus-4 is expressed in the hypodermal seam cells, the pharynx and distal intestine [8], these alterations co-localize with loss of genetic function. We found that twice as much O-glycan was released from bus-4 nematode glycoproteins than the parent strain. As theCecore-I glycans are 85 – 90% ofO-glycans, the majority of the increase was in this class (Figure 4). The bus-4 surface coat contained double the abundance of Ce core-I mucin glycoprotein with the most dramatic increases seen in the head and tail regions (Figure 2A). This increase was associated with expression of the mucinslet-653 and osm-8, which were both increased nearly 40 fold. Both are expressed in the hypodermis and seam cells among other tissues. The abundances of soluble mucin in thebus-4intestine measured higher although these differences were subtle. Fucosyl glycocon-jugates were more concentrated in the hind gut rectum and anus (Figure 2B) showing that soluble glycoproteins of the intestine are altered in abundance and distribution. In contrast to increased glycoconjugate expression seen in soluble mucins, Ce core-I glycoprotein abundances seen at the cuticle surface underlying the surface coat were reduced dramatically (Figure 1). Overall the changes seen in mucin distributions and abundances were dramatic.
Thebus-4O-glycans were shifted in sub-class distributions.Ce core-I charged form abundances were reduced by half but neutral Cecore-I, neutral fucosyl, andCecore-II forms were increased in relative proportion. Tandem MS examination of the neutral and acidic Ce core-I glycans revealed dramatic shifts in isomer distributions as substitution patterns of the core Galb1,3GalNAc -Ser/Thr were altered. The most significant change was the loss of GlcA substitutions with more subtle shifts in terminal Glc and Gal substitutions. The bus-4 mucin contained half of the GlcA substitution as wild-type mucin greatly reducing its charge. C. eleganscan add GlcA to C4 of GalNAc or C3 of Gal in the Gal b1,3GalNAc-Ser/Thr core. In the bus-4 deficient background there is loss of GlcA at both sites over all but more so at the GalNAc C4 position. The C4 is more often occupied with a Glc
substitution in the bus-4pool as well. This centers the changes most significantly at the C4 of the core GalNAc. As all members of Pfam01762 are predicted to act on a HexNAc acceptor it is tempting to speculate about theBUS-4activity. However, we do not have sufficient evidence to ascribe an activity at this time. We are currently working to purifyBUS-4and characterize it in vitro. N-glycans were also altered in the bus-4strain. Fucosyl forms were increased by 25% relative abundance in their subclass (Figure S10). Detailed structural investigation revealed no differences in N-glycoform structures or isomeric distributions. Therefore the quantity but not quality of these glycans was affected. As previously stated,bus-4fucosyl O-glycans were also increased. This situation, where general glycoprotein fucosylation is affected, occurs at least in part, through a compensatory response at the expression level upstream of N- and O -glycosylation. GDP-Man 3,5 dehydratase is over 100 fold increased in the bus-4 strain as shown in this study (Figure 8). This enzyme catalyzes the first committed step in GDP-Fuc synthesis and this nucleotide sugar is the donor substrate in fucosyl glycan synthesis in both pools studied here. Fucosyl O-glycans were also increased in thebus-2mutant previously studied [27]. In the bus-2 strain however GDP-Man 3,5 dehydratase was only increased by 20 fold (our unpublished observations). This situation suggests that the glycan and substrate pools are related through complex regulatory processes with multiple levels of control that can affect glycosylation levels and distributions across major glycosylation pathways. ApparentlyCecore-I glycan pool sensing can impact fucosylation and, in some instances, such as seen here in thebus-4mutants, these changes can affect multiple glycosyl-ation pathways.
increased in the rectum and anal regions under some conditions (Figure 2B).M. nematophilumdoes not form a successful infection under this altered glycosylation status.
In higher eukaryotes both commensal and pathogenic bacteria interact with an intestinal environment that appears to form glycoprotein gradients both through the secreted mucin and in underlying tissues [41]. In humans, organisms such as Pseudomo-nas aeruginosa[42] andE. coli[43] have developed strategies that target oligosaccharides of the epithelial surfaces. Mucin glycan composition has been shown to vary considerably along the gastrointestinal tract [41] and these glycans change during inflammation [44]. Differences in blood type, which conveys differences in O-glycosylation, can alter the microbiome of the human intestine and alter susceptibility to pathogens [45,46]. These examples demonstrate the importance of glycosylation patterning in the gut for microbial interactions. In nematodes a similar interaction likely exists at the surface coat [38,47] and intestine [48]. In this regard, the bus-4intestine, cuticle surface coat, and underlying cuticle may not be capable of providing the normal cues required for M. nematophilum to infect the anus, rectum and associated cuticle. Likewise, the altered properties of thebus-4cuticle surface and surface coat are not compatible with adherence ofY. pestisandY. peudotubercuosisbiofilm. In the case of Leucobacter Verde-1 and Verde-2, susceptibilities are flipped. While wildtype nematodes suffer lethal infection by Verde-2 and are resistant to Verde-1, thebus-4 mutants are resistant to Verde-2 but suffer lethal infection by Verde-1 [12]. Thebus-4mutants are also affected in normal interactions, such as mating. All of these changes demonstrate the importance ofbus-4mediated modifica-tions the absence of which leads to shifts in mucin properties at cell surfaces and secreted mucins of the surface coat.
Conclusions
To date we have reported alterations in the glycomes ofsrf-3, bus-2andbus-4mutants. In all cases theCecore-IO-glycans were dramatically altered and pathogen resistance is present. Clearly these glycans are required for pathogenic processes of M.nema-tophilum,Y. pestisandY. peudotubercuosis. Here we have reported dramatic changes in the glycosylation profile of the surface coat, cuticle surface and intestine in the bus-4 deficient background. Further examination ofbus-2, normally expressed in the hind gut and seam cells, also reveals a dramatic increase in mucinO-glycan abundance (our unpublished observations) and changes in intestinal glycosylation [13]. These mutants will be useful for further investigation into the function of glycosylation in the surface coat, cuticle and intestine.
Supporting Information
Figure S1 ABA staining of acetone fixed N2 and bus-4
nematodes.The images were collected using FITC conjugated ABA and for a shorter time exposure than those in Figure 1.Ce core-IO-glycans are in the tail region of the cuticle leading up to the anus. The loss of these glycans at the cuticle surface are most dramatic in this region.
(TIF)
Figure S2 ABA lectin binds to N2 andbus-4 Cecore-IO
-glycans.Glycopeptides from N2 and bus-4 strains were applied to ABA lectin columns, washed with 10 mM phosphate buffer and adsorbed forms eluted using, 100 mMb-methyl galactoside. An aliquot of the samples applied to the column, the washes, and the eluate were subjected to b-elimination, permethylated and analyzed by MALDI-TOF MS. A) N2 sample, B) N2 phosphate
buffer wash, C) N2 100 mMb-methyl galactoside eluted glyco-forms, D)bus-4sample, E)bus-4phosphate buffer wash, F)bus-4 100 mMb-methyl galactoside eluted glycoforms.
(TIF)
Figure S3 MALDI-TOF MS analysis of N2 and bus-4
permethylatedO-glycans.The glycans of N2 are shown in A
and those of bus-4 in B. Panels on the left include Ce core-I neutral,Cecore-I charged, and neutral fucosyl forms. Panels to the right are amplified 20 times and contain theCecore-IIO-glycans. Thebus-4 Cecore-I charged forms are greatly diminished butCe core-II forms are increased. Key glycans are labeled. See Table 1 for a complete list and Figure 4A and B for relative abundances of O-glycans detected in this study.
(TIF)
Figure S4 The CID MS3 analysis of matched N2 and
bus-4permethylatedm/z502.3 daughter ions of
Hex2-HexNAc1-ol,m/z738.6 [M+Na]+
.Data were collected under identical conditions using a Thermo LTQ-XL ion trap equipped with an Advion Nanomate sample infusion system. The N2 spectrum appears in the top panel and that ofbus-4in the bottom panel. Derived structure is shown in the top panel. The ionm/z positions and differences in ion intensities are consistent with the same configuration but different monosaccharide compositions. (TIF)
Figure S5 The CID MS3 analysis of matched N2 and
bus-4permethylatedm/z463.0 daughter ions of
Hex2-HexNAc1-ol,m/z738.6 [M+Na]+
.Data were collected under identical conditions using a Thermo LTQ-XL ion trap equipped with an Advion Nanomate sample infusion system. The N2 spectrum appears in the top panel and that ofbus-4in the bottom panel. Derived structure is shown in the top panel. The ionm/z positions and differences in ion intensities are consistent with the same configuration but different monosaccharide compositions. (TIF)
Figure S6 The CID MS3 analysis of matched N2 and
bus-4permethylatedm/z706.4 daughter ions of
Hex3-HexNAc1-ol,m/z942.6 [M+Na]+
.Data were collected under identical conditions using a Thermo LTQ-XL ion trap equipped with an Advion Nanomate sample infusion system. The N2 spectrum appears in the top panel and that ofbus-4in the bottom panel. The derived structure is shown in the top panel. The ion nearly identicalm/zpositions and ion intensities are consistent with the same configuration for both sources.
(TIF)
Figure S7 The CID MS3 analysis of matched N2 and
bus-4permethylatedm/z502.3 daughter ions of
Hex3-HexNAc1-ol,m/z942.6 [M+Na]+.
Data were collected under identical conditions using a Thermo LTQ-XL ion trap equipped with an Advion Nanomate sample infusion system. The N2 spectrum appears in the top panel and that ofbus-4in the bottom panel. Derived structure is shown in the top panel. The ion abundances and nearly identicalm/zpositions and intensities are consistent with the same configuration for both sources.
(TIF)
Figure S8 The CID MS3 analysis of matched N2 and
bus-4permethylatedm/z463.0 daughter ions of
Hex3-HexNAc1-ol,m/z942.6 [M+Na]+.
![Figure 7. The CID MS 2 analysis of matched N2 and bus-4 Hex 3 HexNAc 1 HexA 1 -ol at m/z 1160.6 [M+Na] +](https://thumb-eu.123doks.com/thumbv2/123dok_br/18158974.328548/12.918.190.735.93.805/figure-cid-ms-analysis-matched-hex-hexnac-hexa.webp)