A Novel Efficient Forecasting of Stock Market Using
Particle Swarm Optimization with Center of Mass
Based Technique
Razan A. Jamous
Department of Mathematics, Faculty of
Science, Ain Shams University Cairo, Egypt
Essam El.Seidy
Department of Mathematics, Faculty of Science, Ain Shams University
Cairo, Egypt
Bayoumi Ibrahim Bayoum
Department of Mathematics, Facultyof
Science, Ain Shams University Cairo, Egypt
Abstract—This paper develops an efficient forecasting model for various stock price indices based on the previously introduced particle swarm optimization with center mass (PSOCOM) technique. The structure used in the proposed prediction models is a simple linear combiner using (PSOCOM) by minimizing its mean square error (MSE) to evaluate the proposed model. The comparison with other models such as
standard PSO, Genetic algorithm, Bacterial foraging
optimization, and adaptive bacterial foraging optimization had been done. The experimental results show that PSOCOM algorithmsare the best among other algorithms in terms of MSE and the accuracy of prediction for some stock price indices. Whereas, the proposed forecasting model gives accurate prediction for short- and long-term prediction. As a result, the proposed stock market prediction model is more efficient from the other compared models.
Keywords—Stock market forecasting; particle swarm optimization; Bacterial foraging optimization; Adaptive bacterial foraging optimization; Genetic algorithm
I. INTRODUCTION
Stock market is an organized and regulated financial market where securities such as bonds, notes, and shares are bought and sold at prices governed by the forces of demand and supply [1]. In addition, stock market is, without a doubt, one of the greatest tools ever invented for building wealth. Stocks are a part, if not the cornerstone, of any investment portfolio. This demand coupled with advances in trading technology has opened up the markets so that nowadays nearly anybody can own stocks, and use many types of software to perform the aspired profit with minimum risk [2]. Consequently, a lot of attention had been devoted to the analysis and prediction of future values and trends of the financial stock markets, and due to applications in different business transactions, stock market prediction has become a hot topic of research [3]. There is no doubt that the majority of the people related to stock markets are trying to achieve profit. Profit is achieved by investing in stocks that have a good future (short or long term future).
In this paper, our earlier presented particle swarm optimization with center of mass technique (PSOCoM) is applied to the task of training an adaptive linear combiner to form a new stock market prediction model. This prediction
model is used with some common indicators to maximize the return and minimize the risk for the stock market.
The rest of the paper is organized as follows: The survey of the relevant literature is summarized in Section 2. The description of the proposed technique is given in Section 3. Simulation results are shown in Section 4, followed by conclusions in Section 5.
II. RELATED WORK
Many research papers have appeared in the literature using evolutionary computing tools such as genetic algorithm (GA)[4], particle swarm optimization (PSO)[5], and bacterial foraging optimization (BFO)[6], and Adaptive bacterial foraging optimization (ABFO) in developing forecasting models.
A new evolutionary computation technique called Bacterial foraging optimization (BFO) had been proposed in [3]. It is inspired by the pattern exhibited by bacterial foraging behavior. Bacteria have the tendency to gather to the nutrient-rich areas by an activity called chemotaxis. It is known that bacteria swim by rotating whip like flagella driven by a reversible motor embedded in the cell wall. E. coli has 8–10 flagella placed randomly on a cell body. When all flagella rotate counterclockwise, they form a compact, helically propelling the cell along a trajectory, which is called run. When the flagella rotate clockwise, they pull on the bacterium in different directions and cause the bacteria to tumble. The bacterial foraging system primarily consists of four sequential mechanisms namely chemotaxis, swarming, reproduction, and elimination-dispersal [7].
(ABFO) [8], employing the adaptive foraging strategies to improve the performance of the original BFO. This improvement is achieved by enabling the bacterial foraging algorithm to adjust the run-length unit parameter dynamically during algorithm execution in order to balance the exploration exploitation tradeoff [9]. Majhi in [10] developed two new forecasting models based on bacterial foraging optimization (BFO) and adaptive bacterial foraging optimization (ABFO) to predict S&P500 and DJIA stock indices using technical indicators derived from the past stock indices. The structure of these models is basically an adaptive liner combiner, the weights of which are trained using the ABFO and BFO algorithms.
Kyoung-jae Kim and Won Boo Lee [11] developed a feature transformation method using genetic algorithms. This approach reduces the dimensionality of the feature space and removes irrelevant factors involved in stock price prediction.
Another research done on genetic algorithms (GAs) by Kyoung-jae Kim [12] to predict stock market by using GA not only to improve the learning algorithm, but also to reduce the complexity of the feature space. Thus, this approach reduces dimensionality of the feature space and enhances the generalizability of the classifier.
The authors in [13][14], proposed data mining approach using genetic algorithms (GA) to solve the knowledge acquisition problems that are inherent in constructing and maintaining rule-based applications for stock market. Although there are an infinite number of possible rules by which it could trade, only a few of them would have made us a profit if it had been following them. The authors intend to find good sets of rules which would have made the most money over a certain historical period.
Kennedy and Eberhart in [15] introduced particle Swarm Optimization (PSO) in 1995. Individuals in a particle swarm follow a very simple behavior: to emulate the success of neighboring individuals and their own successes. The collective behavior that emerges from this simple behavior is that of discovering optimal regions of a high dimension al search space [16]. PSO algorithm maintains a swarm of particles, where each particle represents a potential solution. In analogy with evolutionary computation paradigms, a swarm is similar to a population, while a particle is similar to an individual. In simple terms, the particles are “flown” through a multidimensional search space, where the position of each particle is adjusted according to its own experience and that of its neighbors.
Let = (xi1, xi2, …, xid) denote the position of particle i in the search space at time step t, = (vi1,vi2, …, vid) denote the velocity particle i in the search space at time step t, Pi= (pi1,pi2, …, pid) denote the best solution achieved so far by the particle itself, Pgd= (pg1,pg2, …, pgd),denote the best solution achieved so far by the whole swarm. The new position of the particle is changed by adding a velocity to the current position, as follows:
(1) ( ) ( )
Where c1 and c2 are two positive constants, r1 and r2 are two random numbers in the range [0, 1]; w is the inertia weight. The velocity vector drives the optimization process, and reflects both the experiential knowledge of the particle and socially exchanged information from the particle’s neighborhood. The experiential knowledge of a particle is generally referred to as the cognitive component, which is proportional to the distance of the particle from its own best position (referred to as pbesti). The socially exchanged information is referred to as the social component of the velocity equation (2), which is proportional to the distance of the particle from the best position found by the swarm (referred to as gbest). For the global best PSO, or gbest PSO, the neighborhood for each particle is the entire swarm. The social component of the particle velocity update reflects information obtained from all the particles in the swarm. In this case, the social information is the best position found by the swarm. For the local best PSO, or pbesti PSO, the neighborhood for each particle is small number of particles in the swarm. Thus, the social component reflects information exchanged within the neighborhood of the particle, reflecting local knowledge of the environment. In this case, the social information is the best position found by the experiential knowledge of the particle. The velocity calculation as given in equation (2) consists of three terms: the previous velocity, , the cognitive component, ( ) , and the social component,
( ).
PSO has become popular choice for solving complex and intricate problems which are otherwise difficult to solve by traditional methods [17]. The usage of the PSO technique in coping with stock market prediction problems is the most important applications of PSO to predict the stocks that have maximum profit with minimum risk. In our earlier paper[18], we introduce many different forms of PSO which used for stock market prediction such as Standard Particle Swarm Optimization, In our another earlier paper [19], we present a new PSOCoM Optimization algorithm. Also, in our [20], we apply the presented PSOCoM technique to the task of training an adaptive linear combiner to form a new stock market prediction model. This prediction model is used with some common indicators such as S&P500, DJIA and NASDAQ-100 that give advice of buy and sell to increase the profit and decries the risk in stock market.
III. THE PROPOSED STOCK MARKET PREDICTION
TECHNIQUE
the best chance to occupy the position of global best found solution during the search process. The PSOCoM technique is applied to the task of training an adaptive linear combiner to form a new stock market prediction model. This prediction model is used with some common indicators to increase the profit and decries the risk in stock market.
The structure of the proposed stock market prediction technique is assumed to be an adaptive linear combiner with parallel inputs as shown in Figure 1. The numbers of the inputs equal to the number of features in the input patterns, these features are abstracted from the stock market series such as closing prices and technical indicator values. The connecting weights of an adaptive linear combiner are considered as the particles and initially their values are set to random numbers in the range [-1, +1]. The swarm of particles is chosen to represent the initial solutions of the model. Each particle is adjusted during the training step by the way of minimizing the mean square error (MSE) as an objective function for PSOCoM technique. The formula of mean square error for the
particle is given in Equation 3.
∑ (3) Where: error (k).
Fig. 1. The proposed stock market prediction model
The steps of the proposed prediction model are described below:
1. Start
2. For all history data of specific stock 3. {
4. //Abstract features (closing price, technical indictor values).
5. Calculate one- day –ahead price //d(k-1)
6. Calculate the technical indicators //
.
7. }
8. Using adaptive linear combiner(ALC)
9. Multiply the input of (ALCi) (d(k-1) and
) with weight of ALCi
10. For all training set(100 days as example) 11. {
12. Calculate the error // corresponding desired stock price (i.e. close price). 13. Calculate Mean Square Error for the ith particle
// ∑ .
14. Use (MSEi) as an objective function for PSOCoM technique to minimize MSE.
15. Use the output of improved PSOCOM to improve
.
16.
End.IV. EVALUATION OF THE PROPOSED STOCK MARKET
PREDICTION TECHNIQUE
RESULTS AND ANALYSIS
In this section, the performance of the proposed technique is evaluated. For that, the experimental data of used indices and the values of parameters settings are described. Finally the results and discussion of these results are presented.
A. Experimental Data
The data for the stock market prediction experiments have been collected for Standard’s and Poor’s 500 (S&P 500), National Association of Securities Dealers Automated Quotations 100 (NASDAQ-100), and Dow Jones Industrial Average (DJIA). These common known indices in USA stock market are used for evaluation of the proposed prediction model. These experimental data consist of daily close price and technical indicators derived from those indices. Total number of samples for the stock indices is 2500 trading days, from 2 January 2005 to 31 December 2014. Each sample consists of the opening price, highest price, lowest price, closing price and the total volume of the stocks traded for the day.
B. Parameter Settings
In this section, the setting of the parameters which were used in the experiments are presented. The inertia weight w was linearly decreased from 0.9 to 0.4; acceleration coefficients were set to = = 2; the maximum velocity was set to Vmax= 0.5 and Xmax= 1. The swarm size was set to 30. The maximum number of iterations was set to 100. Initialization range of particle positions was -1≤ xi ≤ 1. All mean square errors (MSE) were computed over 30 runs. In short term prediction experiment, the training period was set to 100, 200, and 500 days to predict test period of 100 days. In long term prediction experiment, the training period was set to 1000 and 1500 days to predict test period of 750 days.
C. Results and Discussion
The evaluation of the proposed prediction model was performed using two types of prediction, short-term prediction and long-term prediction. The convergence characteristics of PSOCOM, ABFO, BFO, GA and PSO models for 1 day ahead prediction of DJIA , NASDAQ-100 and S&P 500 stock indices
� (k-1) d(k-1) ……..
Calculator of Technical
Indictors
⬚ ⬚
Acc .+
PSOCOM Technique Historical Data
Adaptive Line Combiner
Prediction (K+1)
Actual Stock Value �
(k-1)
�� (k-1) ��
��
��3
���
�� �
�� � d (k)
- +
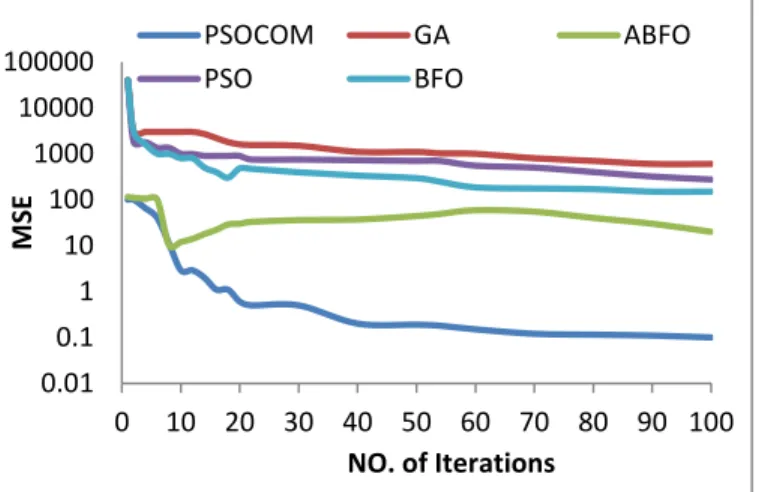
for short term and long term prediction are shown in figures from 1 to 6, respectively.
To clarify the learning characteristics of the compared models in short and long term, the mean square error (MSE) was considered as a measure during training process.
As we see, Figures from 1 to 6, show the variation in the MSE vs. the number of iterations. It’s clear that the MSE decreases when the number of iterations increases.
The comparison between of learning characteristics models to predict DJIA for one day advance in short term prediction is shown in Figure 2, and for long term in figure 3.
Fig. 2. Comparison of learning characteristics models to predict DJIA for one day advance (short term prediction)
Fig. 3. Comparison of learning characteristics models to predict DJIA for one day advance (long term prediction)
The comparison of learning characteristics models to predict NASDAQ-100 for one day advance in short term prediction is shown in Figure 4, and for long term in Figure5.
Fig. 4. Comparison of learning characteristics models to predict for one day advance (short term prediction)
Fig. 5. Comparison of learning characteristics models to predict NASDAQ-100 for one day advance (long term prediction)
The comparison of learning characteristics models to predict S&P500 for one day advance in short term prediction is shown in Figure 6, and for long term in Figure 7.
Fig. 6. Comparison of learning characteristics models to predict S&P500 for one day advance (short term prediction)
0.01 0.1 1 10 100 1000 10000
0 10 20 30 40 50 60 70 80 90 100
M
S
E
NO. of Iterations
PSOCOM GA BFO
ABFO PSO
0.01 0.1 1 10 100 1000 10000 100000
0 10 20 30 40 50 60 70 80 90 100
M
SE
NO. of Iterations
PSOCOM GA ABFO
PSO BFO
0.1 1 10 100 1000 10000
0 10 20 30 40 50 60 70 80 90 100
M
S
E
NO. of Iterations
PSOCOM GA BFO
PSO ABFO
0.01 0.1 1 10 100 1000 10000 100000
0 10 20 30 40 50 60 70 80 90 100
M
S
E
NO. of Iterations
PSOCOM GA ABFO
PSO BFO
0.01 0.1 1 10 100 1000 10000 100000
0 10 20 30 40 50 60 70 80 90 100
M
S
E
NO. of Iterations
PSOCOM GA ABFO
Fig. 7. Comparison of learning characteristics models to predict S&P500 for one day advance (long term prediction)
The figures proposed PSOCoM converged faster than the other methods such as ABFO, BFO, GA, and standard PSO during training process and reached the best minimum value of MSE indicating to the convergence of the weights. This emphasizes that the proposed PSOCoM overcomes the other compared methods, in learning characteristics, then the proposed prediction model superiors the other models in abstracting the important feature during training to perform more accurate prediction. According to MSE, the previous results clearly indicated that the proposed PSOCoM based model offers faster convergence during training followed by ABFO, PSO, BFO and then GA, based models.
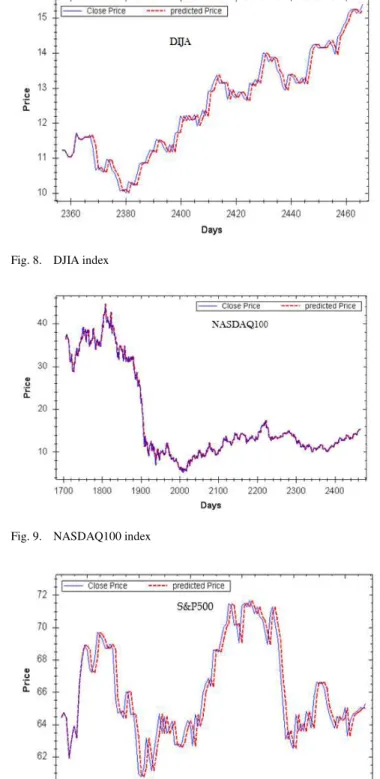
The following curves show the comparison between the actual price and predicted price produced by the proposed PSOCOM model for DJIA, NASDAQ100, and S&P500 respectively.
Figures from 8 to 10 show the actual vs. predicted price for DJIA, NASDAQ100, and S&P500 indices for seven days ahead using the proposed PSOCOM model when test data are used as input. Comparison reveals very good agreement between the actual and predicted prices for DJIA, NASDAQ100, and S&P500 indices. It is in general observed that the proposed models predict DJIA, NASDAQ100, and S&P500 stock indices with less than 1% error for seven days ahead, because that the proposed PSOCOM converged faster than the other versions of other techniques during training process and reached the best minimum value of MSE indicating to the convergence of the weights. This leads to the fact that the proposed PSOCOM superiors the other techniques in learning characteristics, so the proposed prediction model superiors the other models in abstracting the important feature during training to perform more accurate prediction.
Fig. 8. DJIA index
Fig. 9. NASDAQ100 index
Fig. 10.S&P500 index
1 10 100 1000 10000 100000
0 10 20 30 40 50 60 70 80 90 100
M
S
E
NO. of Iterations
PSOCOM ABFO BFO
V. CONCLUSION AND FUTURE WORK
A new stock market prediction model, based on the PSOCoM technique was proposed. The PSOCoM technique is used in the Suggested prediction model to adjust the weights of the adaptive linear combiner. The results of the experiments showed that the proposed forecasting technique is better than the other methods in terms of the accuracy of the prediction. The proposed forecasting model gives accurate prediction for short term and long term prediction. As a result, the proposed stock market prediction model is more efficient from the other compared models. So, the suggested prediction model is a new promising forecasting model for stock market prediction. In the future, more experiments and more comparison with other prediction models can be done. In addition, based on the proposed prediction technique, a new selection model can be designed in order to select the best stocks with highest profit and minimum risk. Also, it can develop a new automated system based on the presented technique to become an intelligent agent that makes trades in stock markets to get maximum return with minimum loss and gives the decision to buy or sell for the best selected stocks, and gives the final return at the end of the determined period.
REFERENCES
[1] C.Hargreaves and Y.Hao,“Prediction of Stock Performance Using Analytical Techniques ” Journal of Emerging Technologies in Web Intelligence, Vol 5, No 2 (2013), 136-142, May 2013.
[2] S.Arun Joe Babulo, B. Janaki, C. Jeeva,”Stock Market Indices
Prediction with Various Neural Network Models” International Journal
of Computer Science and Mobile Applications, Vol.2 Issue. 3, March-2014.
[3] T.Helstrom, and K.Holmstrom, “Predicting the stock market”. Published as Opuscula ISRN HEV-BIB-OP-26-SE. 1998.
[4] D. Contras , O. Matei” Translation of the Mutation Operator from Genetic Algorithms to Evolutionary Ontologies’ in International Journal of Advanced Computer Science and Applications(IJACSA), Volume 7 Issue 1, 2016 .
[5] A.Jordehi and J.Jasni, "Parameter selection in particle swarm optimisation: a survey", Journal of Experimental & Theoretical Artificial Intelligence, 25.4: 527-542, 2013.
[6] N. K. Jhankal ; D. Adhyaru “Bacterial foraging optimization algorithm:
A derivative free technique” Engineering (NUiCONE), ,Nirma University International Conference on 2011.
[7] R. Vijay ‘Intelligent Bacterial Foraging Optimization Technique to Economic Load Dispatch Problem’ in International Journal of Soft Computing and Engineering (IJSCE) ISSN: 2231-2307, Volume-2, Issue-2, May 2012.
[8] H. Shen, Y. Zhu” Adaptive Bacterial Foraging Optimization Algorithm
Based on Social Foraging Strategy” Journal of Networks, Vol 9, No 3
(2014), 799-806, Mar 2014.
[9] J. Li ” Analysis and Improvement of the Bacterial Foraging
Optimization Algorithm” Journal of Computing Science and Engineering, Vol. 8, No. 1, March, pp. 1-10, 2014.
[10] R.Majhi ,G.Panda,B.Majhi, andG.Sahoo, , “Efficient prediction of stock market indices using adaptive bacterial foraging optimization (ABFO) and BFO based techniques”, Expert Systems with Applications. Vol. 36(6), pp. 10097-10104, 2009.
[11] K. Kyoung-jae, L. Won Boo. “Stock market prediction using artificial
neural networks with optimal feature transformation”. Neural
Computing and Applications (2004),Volume: 13, Issue: 3, Publisher: Citeseer, Pages: 255-260
[12] K. Kim, I. Han. “Genetic algorithms approach to feature discretization in artificial neural networks for the prediction of stock price index”. Expert Systems with Applications, Volume 19, Issue 2, August 2000, Pages 125–132.
[13] J. Kennedy, andC. Eberhart, , “Particle Swarm Optimization”. Proceedings of the 1995 IEEE International Conference on Neural Networks, Australia, 1995, pp. 1942-1948.
[14] J .Štěpánek, ,J. Šťovíček, R. Cimler ” Application of Genetic Algorithms in Stock Market Simulation” Cyprus International Conference on Educational Research (CY-ICER-2012)North Cyprus, US08-10 February, 2012.
[15] L. Demidova, E. Nikulchev , Y. Sokolova “The SVM Classifier Based on the Modified Particle Swarm Optimization"in International Journal of Advanced Computer Science and Applications(IJACSA), Volume 7 Issue 2, 2016.
[16] Y.Zhang, S. Wang, and G.Ji “A Comprehensive Survey on Particle
Swarm Optimization Algorithm and Its Applications” journal of
Mathematical Problems in Engineering, Volume , Article ID 931256, 38 pages,2015.
[17] H. Subramanian, S. Ramamoorthy, P.Stone, B. J. Kuipers “Designing safe, profitable automated stock trading agents using evolutionary
algorithms” In Proceedings of the Genetic and Evolutionary Computation Conference, July 2006
.
[18] E.El. Seidy,; “A New Particle Swarm Optimization based Stock Market
Prediction Technique “accepted to publicationin International Journal of
Advanced Computer Science and Applications,Volume 7 No. 2, February 2016.
[19] R. Jamous, E. El. Seidy, A. Tharwat, B. I. Bayoumi” A new Particle Swarm with Center of Mass Optimization”, in International Journal of Engineering Research & Technology (IJERT), Vol. 4 Issue 05, 2015, PP:312-317
[20] R. Jamous, E. El. Seidy, A. Tharwat, B. I. Bayoumi“Modifications of Particle Swarm Optimization Techniques and Its Application on Stock
Market: A Survey “in International Journal of Advanced Computer