Brazilian Microwave and Optoelectronics Society-SBMO received 06 Mar 2018; revised 22 Mar 2018; accepted 14 Jun 2018
Abstract— In this work, it is investigated an improved chaos particle swarm optimization (IC-PSO) scheme to refine the quality of the algorithm solutions regarding to solve the optimal power allocation in next generation passive optical networks (NG-PON)s. The proposed IC-PSO scheme utilizes the Beta distribution instead of uniform distribution of the traditional PSO. A factor of damping based in the chaotic logistic map related to the updating of the best global val ue is successful introduced. The numerical results corroborate the best relation between the performance-complexity tradeoff and the quality of the algorithm solutions for the proposed IC-PSO when compared with the classical PSO power allocation scheme.
Index Terms— Passive optical network, optical code division multiplexing access, chaos particle swarm optimization.
1. Introduction
The resource allocation in passive optical network (PON) is utilized for dynamic bandwidth allocation (DBA), power allocation (power control), multiple bit rate control and the adjustment of the number of actives optical network units (ONUs), such as sleep mode, to improve the network capacity, flexibility and energy efficiency [1][2][3]. In the power allocation problem the aim is to obtain the optimization of the transmitted power to minimize the interference between the users and maximize the energy efficiency, considering the quality of service (QoS) restrictions in terms of signal-to-noise-plus interference ratio (SNIR) of each optical user class [4][5]. The power allocation problem are related to not convex cost and constraint functions, therefore this problem in not straight to be solved [6][7]. In this context, there are several approaches to solve the power allocation problem, such as analytical-iterative algorithms, matrix inversion, numerical procedures and heuristic schemes [4][7][8][9]. The meta-heuristics methods are very promissory approaches to perform the power allocation considering its performance-complexity tradeoff and fairness features regarding the previous cited approaches [9][10]. In addition, the bio-inspired meta-heuristics have been presented relevant results to solve the power allocation problem [6][9][10]. In this work, the meta-heuristic of particle swarm optimization (PSO) and its variations are considered in the investigation of the power allocation problem in context of the next generation of PONs (NG-PONs) [11]. The
Power Allocation in PON-OCDMA with
Improved Chaos Particle Swarm
Optimization
Gisele A. Santana
1, Fábio R. Durand
1and Taufik Abrão
2 1Universidade Tecnológica Federal do Paraná, [email protected],progress of the NG-PON depends on the increasing of the optical power budget, the fiber impairments mitigation (mainly in long-reach PONs) [1], as well as dynamic resource allocation [2][3]. In this sense, it is primordial ameliorate the energy efficiency and spectral efficiency of NG-PONs, related to the highly burst traffic behavior, the rising of the number of ONUs and the growth tendency of these networks [1][2][3].
The PSO is based on the movement of a population (swarm) of individuals (particles) randomly distributed in the search space, each one with its own position and velocity [12]. The challenge in the meta-heuristic algorithm utilized in optimization problems, such as the PSO, is to obtain the trade-off between the exploration (diversification) and the exploitation (intensification) [12]. In this sense, the chaos particle swarm optimization (CPSO) was proposed to improve the quality of the results in the optimization problems considering the global searching capability by escaping the local solutions [13]. The CPSO comprises a large variety of schemes, which chaotic maps based on the complex behavior of a nonlinear deterministic system are utilized to optimization goal. Chaos presents a non-repetitive nature that increase the random search characteristics of the CPSO methods. For only a few examples of CPSO variations, in [13][14][15] several chaotic maps are applied as random number generators that is different from the classical PSO algorithm, where a uniform probability distribution is used to generate random numbers. Alternatively, these chaotic maps could be organized in the Ensemble learning approach to improve the CPSO algorithm [16]. In addition, the chaotic maps are applied to find new solutions in the neighborhoods of the previous best positions to help the algorithm to escape from local optima [17][18]. These modifications in the CPSO will affect the best relation between the performance-complexity, the algorithm convergence and the quality of the algorithm solutions.
The contribution of this work is threefold. First, a systematic investigation and characterization of an improved chaos particle swarm optimization (IC-PSO) resource allocation scheme. Second, numerically demonstrate the enhanced quality of the proposed IC-PSO algorithm solution regarding the optimal power allocation in NG-PON OCDMA networks; thanks to the Beta distribution utilization instead of uniform distribution commonly deployed in the traditional PSO and a factor of damping related to the best global value updating and based on the chaotic map. Third, demonstrate that such characteristics affect the performance-complexity trade-off and the quality of the algorithm solutions.
This paper is organized as following. Section 2 describes the architecture of the NG-PON utilized in this work. Section 3 presents the resource allocation problem in OCDMA-based NG-PONs, as well as the heuristic PSO formulation approach, and the IC-PSO scheme. The main numerical results are developed in Section 4. Finally, Section 5 presents the main conclusions.
2. Network Architecture
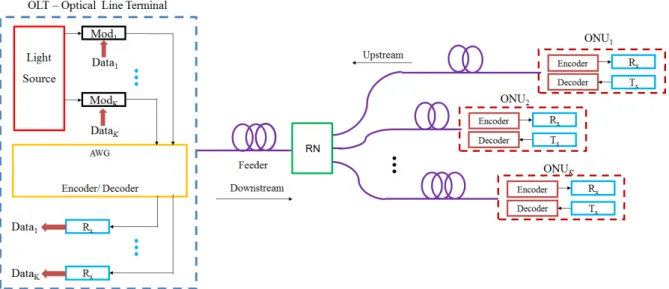
Brazilian Microwave and Optoelectronics Society-SBMO received 06 Mar 2018; revised 22 Mar 2018; accepted 14 Jun 2018 the advanced modulation format [1][2][3]. PONs based on OCDMA (PON-OCDMA) technology presents characteristics such as asynchronous operation, high network flexibility, protocol transparency, simplified network control, quality of service (QoS) in the physical layer and improvement in security aspects [4][19]. In this work, the PON-OCDMA with advanced modulation format is selected to our investigation about resource allocation considering the competitive cost and flexibility of the PON-OCDMA scheme [11][19]. In this scheme the multi-port encoder/decoder at the OLT are based on multi-multi-port arrayed waveguide gratings (AWG) to generate and recognize multiple time spreading optical codes in a single device simultaneously [20]. Besides, the encoder/decoder at the ONUs is based on super-structured fiber Bragg grating (SSFBG) that is independent of the code length and polarization [11][20]. The code generated in the OLT and ONUs is a coherent code phase-shift-keying (PSK), in which the code information is transmitted in the phase.
Fig. 1. PON-OCDMA network architecture.
In the encoder/decoder at OLT, a set of optical codes are generated considering the AWG with N
inputs/outputs in the time domain and each PSK code is obtained through a combination of light pulses with different phase [20]. The chip period ( ), that represents the amount of time interval between two consecutive pulses in each optical code is defined as , where is the effective refractive index, is the differential path length and is the light speed [11]. The code cardinality is obtained by the binomial , where is the code length, thus the
3. Power Allocation Problem
3.1. Power Allocation Problem Formulation
In the PON-OCDMA the SNIR at the OLT (upstream) is related to the carrier-to-interference ratio (CIR) as [4],
(1)
where N is the code length, is the Hamming average variance of the cross-correlation amplitude and i isthe CIR at the input of ith node, given by [4],
(2)
where Gii is gains of transmitter–receiver pairs, is the transmitted power at the ith node, is
the transmitted power from interfering nodes, is the power of receiving noise, and the elements Gij constitute the network interference matrix between the nodes given by
, where αf is the fiber attenuation (km-1), ac represents the
encoder/decoder attenuation and Lc is the total internal losses in the optical path. There is the
establishment of the virtual path between the transmitting ONU and receiving OLT based on the code and the total link length that is represented by , where is the link
length from the transmitting ONU to the remote node and is the link length from the remote node to the OLT. The amplifier spontaneous emission (ASE) effect in the optical preamplifier is a predominant received noise power when compared to thermal and shot noise [4]. Moreover, received noise power is given by , which considers the two polarization mode of a single mode fiber, and where is the spontaneous emission factor, h is
Planck’s constant, f is the carrier frequency, Gi is the amplifier gain, and is the optical
bandwidth.
The optimization of the SNIR is related to the power allocation for each PON-CDMA node. Therefore, the SNIR optimization is based on the determination of the minimum power restriction, named sensitivity level, ensuring the suitably optical signal detected by all optical devices together with the QoS requirements. Thus, the power control in PON-OCDMA is an optimization problem. Denoting i at the required decoder input, in order to get a certain
maximum tolerable bit error rate at the ith optical node, considering K the number of ONUs and the K-dimensional column vector of the transmitted optical power p = [p1, p2,…, pK]T , the
optical power control problem consists in finding the optical power vector p that minimizes the cost function ; this optimization problem can be formulated as [7] :
= =
subject to:
Brazilian Microwave and Optoelectronics Society-SBMO received 06 Mar 2018; revised 22 Mar 2018; accepted 14 Jun 2018
i = 1,.., K,where 1T = [1, ..., 1] is a one vector and is the minimum CIR to achieve a desired QoS; pmin
and pmax is the minimum and maximum value considered as permitted transmitted power, respectively. Through a matrix notations, (3) can be grouped as , where I is the identity matrix, H is the normalized interference matrix, which elements evaluated by
for and zero for another case, thus , where there is a scaled version of
the noise power. Substituting inequality by equality, the optimized power vector solution can be analytically obtained through the matrix inversion . However, the matrix inversion is not attractive procedure due to its performance-complexity tradeoff [4][7]. The optimization method to obtaining the optical power vector p based on PSO and IC-PSO are an expeditious method in order to solve resource allocation problems due to its performance-complexity tradeoff and fairness features regarding the optimization procedure based on matrix inversion [4]. An alternative formulation to the power allocation optimization of (3) is discussed in [6], and adopted herein with some adaptation in order to jointly include information rate and power allocation:
(4)
where L is the number of different group of information rates allowing in the system, and is the number of user belonging to the lth rate group with minimum rate given by . Finally, the threshold function in (5) is defined as:
(5)
where is the SNIR for the th user belongs to the lth rate group. Note that the term
gives credit to those solutions with minimum power and punishes others using high
power levels.
The quality of solution achieved by any iterative resource allocation procedure could be measured by how close to the optimum solution is the found solution, and can be quantified by the normalized mean squared error (NMSE) when equilibrium is reached. For power allocation problem, the NMSE definition is given by,
(6)
where denotes the squared Euclidean distance to the origin, and the expectation operator. In addition, a convergence test is considered 100% successful if the following relation holds:
where, is the global optimum of the objective function under consideration, is the optimum of the objective function obtained by the heuristic PSO algorithm after iterations, and , are accuracy coefficients, usually in the range In this study it was
assumed that T = 100 trials and . 3.2 PSO Principle
The meta-heuristic PSO is based on the particles that keeps track its coordinates in the space of search, which are associated with the best solution (fitness) it has achieved so far. Another best value tracked by the global version of the particle swarm optimizer is the overall best value, and its location, obtained so far by any particle in the population. At each time iteration step, the PSO concept consists of velocity changes of each particle toward local and global locations. The acceleration is weighted by a random term, with separate random numbers being generated for acceleration toward local and global locations. Let bp and vp denote a particle coordinates
(position) and its corresponding flight speed (velocity) in a search space, respectively. In the PSO strategy, each power-vector candidate , with dimension , is used for the velocity-vector calculation in the next iteration [9]; in vector form, the K dimensional velocity-vector
[v 1 v 2 v K ] is defined by:
(8)
where is the inertia weight of the previous velocity in the current speed calculation, the diagonal matrices and with dimension K have their elements as random variables with uniform distribution in the range U [0, 1], generated for the pth particle at iteration t = 1, 2, . . . , ; and are the best global position-vector found until the iteration, and the best local position-vector found at the iteration, respectively; and are acceleration coefficients regarding the best local particles’ position and the best global positions; both coefficients influence in the velocity updating and in the algorithm convergence. In our PON-OCDMA power allocation problem, the particle’s position at the tth iteration is defined by the power-vector candidate . The position of each particle is updated using
the new velocity-vector for that particle:
(9)
where is the population size, which depends on the PON-OCDMA network dimension, specifically the number of ONUs.
3.3. Improved Chaos Particle Swarm Optimization (IC-PSO) Scheme
The proposed Improved Chaos PSO (IC-PSO) scheme is based on two specific features aggregated to the conventional PSO algorithm:
i) it is utilized the Beta distribution instead of uniform distribution to generation of random variables aiming at increasing the diversity while aid the exploration (diversification) of undercover regions in the search space during the transmitted power optimization procedure.
Brazilian Microwave and Optoelectronics Society-SBMO received 06 Mar 2018; revised 22 Mar 2018; accepted 14 Jun 2018 dominance of the best global particle value to avoid premature convergence, increasing the randomness (diversification) without loss in the exploitation capability of the algorithm.
Under these aggregated features, the velocity updating equations of the IC-PSO is given by:
(10)
where [0, 1] is the damping factor generated by chaotic maps. In this work, without loss of generality, it is used the one dimensional logistic map that is related to the dynamics of the biological population [13][14]. The logistic map is given by,
(11)
where a is the control parameter. The variation of X[t] will increase the randomness of the influence of the best global. In addition, and are the diagonal matrices with dimension K, where their elements are random variables with Beta distribution in the range
B(p,q) [0, 1] generated for the pth particle at iteration t = 1, 2, . . . , ., where p and q are the shape parameters from the Beta distribution [21]. The control of the shape parameters enables Beta distribution simulation with symmetric densities ( = ) and asymmetric densities with shape parameters . Besides, the uniform distribution is a special case of Beta distribution with = = 1 [21]. The particle position updating is performed in the same way of conventional PSO, Eq. (9).
4. Numerical Results
4.1. Parameters Summary
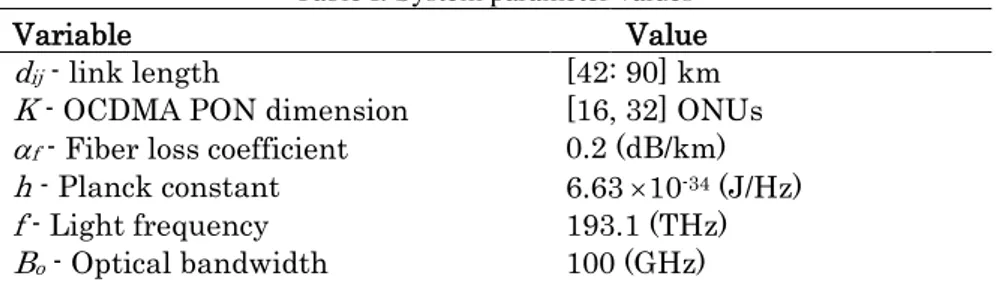
In this section the scenario studied is described, the values for the optical network devices and standard fiber are summarized. Table I presents the main system parameters deployed in the numerical simulations. These parameters are based on network equipment currently available [19][22]. The link length between the OLTs and the remote node is 40 km. Moreover, the link lengths from the remote node to the ONUs are uniformly distributed over a distance with a radius between 2 and 50 km. Herein, the extension of the total link lengths is [42; 90] km considering three different scenarios with 16, 32 and 48 ONUs. This number of ONUs representing situations with SNIR estimates in high, medium and weak signal environments, respectively [23].
Table I. System parameter values
Variable Value
dij - link length [42: 90] km
K - OCDMA PON dimension [16, 32] ONUs
f - Fiber loss coefficient 0.2 (dB/km)
h - Planck constant 6.63 10-34 (J/Hz)
f - Light frequency 193.1 (THz)
nsp- Spontaneous emission factor 2
Gamp - EDFA gain 20 (dB)
N - Code length [16, 32, 48]
Ri - Individual Bit rate 40 (Gbps)
LAWG - Losses of AWG 16 (dB)
LBragg– Losses of Bragg 6.7 (dB)
Pmin– Minimum transmitted power -100 dBm
Pmax– Maximum transmitted power 20 dBm
i* – Target SNIR 20 dB
The conventional PSO performance presents high dependence of the control input parameters for each kind of optimization problem, therefore the definition of the parameters for resource allocation in optical networks was performed in [24]. The conventional PSO parameters utilized in all numerical simulations are illustrated in Table II. The IC-PSO input parameters tuning that are different of the PSO are discussed in the Subsection 4.2.
Table II. Input PSO parameters values
Variable Value
- Number of particles = K + 2
C1 - Particle acceleration 1.8
C2 - Global acceleration 2
- Inertial weight
m - Nonlinear index [0.6; 1.4]
φ - Number of iterations 1800 i - Initial weight inertia 1
f - Final weight inertia 0.4
Vmax – Maximum velocity Vmax = 0.2(pmax–pmin)
Vmin – Minimum velocity Vmax = - Vmin
For all the numerical simulations it is performed 100 trials (realizations) to obtain the better solution with significant coefficient of variation (CV), which is given by the ratio of the standard deviation to the mean. Our simulations have presented CV lower than 8%. Data distribution with CV < 25 % is considered a low-variance data distribution [25].
4.2. IC-PSO Input Parameters Tuning
The conventional PSO and IC-PSO algorithms for optical power allocation present several equivalents parameters; therefore, the equivalents parameters utilized for the PSO will be also utilized for IC-PSO algorithm. On the other hand, for the IC-PSO will be adjusted the parameters related to the Beta function distribution. Initially, in the numerical results is presented the NMSE for the IC-PSO when different values of shape parameters (p, q) and number of ONUs are utilized. The damping factor ( ) will be generated by the logistic map with the control parameter a = 4 to obtain a chaotic behavior [13]. Herein, a vast quantity of combinations of shape parameters were simulated taking the following scheme: Firstly, a q
shape parameter was fixed and various simulations were performed with different value of p
Brazilian Microwave and Optoelectronics Society-SBMO received 06 Mar 2018; revised 22 Mar 2018; accepted 14 Jun 2018 only the more representative values will be presented and discussed.
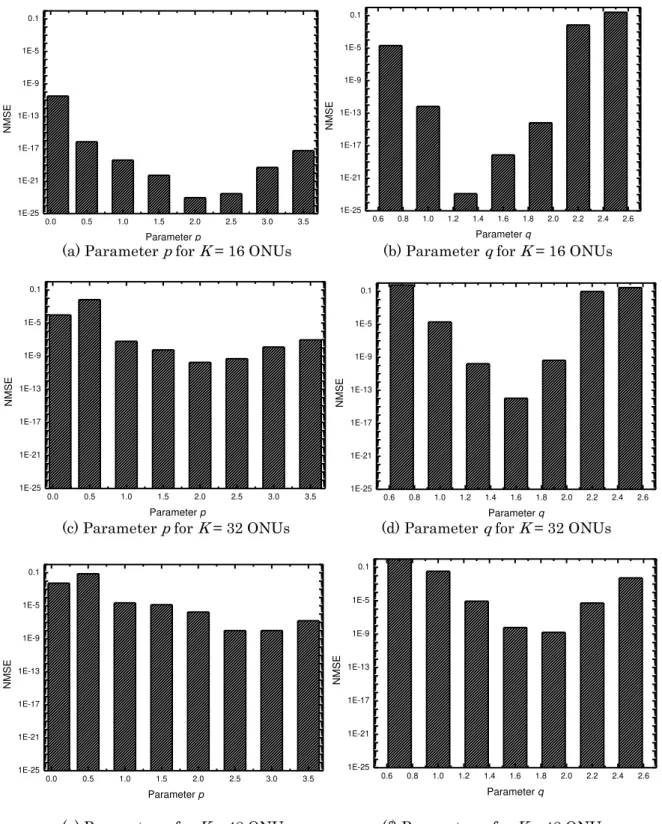
Fig. 2. presents the attained NMSE with IC-PSO considering different value of p and q shape parameter of Beta function for 16, 32 and 48 ONUs.
(a) Parameter p for K = 16 ONUs (b) Parameter q for K = 16 ONUs
(c) Parameter p for K = 32 ONUs (d) Parameter q for K = 32 ONUs
(e) Parameter p for K = 48 ONUs (f) Parameter q for K = 48 ONUs
Fig. 2. NMSE for IC-PSO considering different value of shape parameters of the Beta function for 16, 32 and 48 ONUs.
0.0 0.5 1.0 1.5 2.0 2.5 3.0 3.5 1E-25 1E-21 1E-17 1E-13 1E-9 1E-5 0.1 NM SE
Parameter p
0.6 0.8 1.0 1.2 1.4 1.6 1.8 2.0 2.2 2.4 2.6 1E-25 1E-21 1E-17 1E-13 1E-9 1E-5 0.1 NM SE
Parameter q
0.0 0.5 1.0 1.5 2.0 2.5 3.0 3.5 1E-25 1E-21 1E-17 1E-13 1E-9 1E-5 0.1 NM SE
Parameter p
0.6 0.8 1.0 1.2 1.4 1.6 1.8 2.0 2.2 2.4 2.6 1E-25 1E-21 1E-17 1E-13 1E-9 1E-5 0.1 NM SE
Parameter q
0.0 0.5 1.0 1.5 2.0 2.5 3.0 3.5 1E-25 1E-21 1E-17 1E-13 1E-9 1E-5 0.1 NM SE
Parameter p
0.6 0.8 1.0 1.2 1.4 1.6 1.8 2.0 2.2 2.4 2.6 1E-25 1E-21 1E-17 1E-13 1E-9 1E-5 0.1 NM SE
From Fig. 2 (a) and (b), it is illustrated the impact of the p and q shape parameter values of the Beta function on the NMSE for 16 ONUs. For this number of ONUs, which represents a situation with high SNIR estimate environment, the lower NMSE is obtained directly with p = 2.0 and q = 1.3. In the same way, Fig. 2 (c) and (d) depicts the NMSE for different value of p
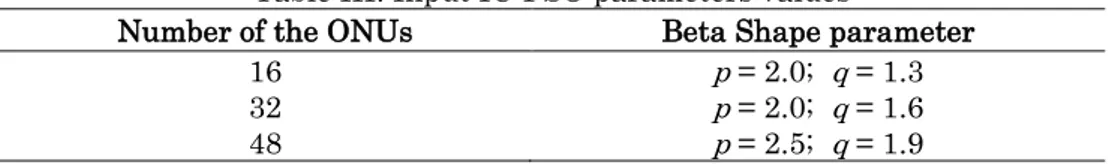
and q shape parameter of Beta function for 32 ONUs, representing a situation with medium SNIR estimate environment. Notice that comparing Fig. 2 (c) and (d) with Fig. 2 (a) and (b), the level of the NMSE is higher for 32 ONUs when compared with the NMSE for 16 ONUs. This behavior is related to the level of the SNIR and the ability of the IC-PSO power allocation to solve the allocation problem when the number of ONUs increase. Notice, even in situations of low NMSE the difference between NMSE magnitudes represents a better tendency of convergence. The variation of the number of ONUs will affect the choice of the Beta distribution shape parameters to return the lower NMSE. For the case of 32 ONUs the lower NMSE is obtained with p = 2.0 and q = 1.6. Fig. 2 (e) and (f) depicts the NMSE for different value of p and q shape parameter of Beta function for 48 ONUs, representing a situation with weak SNIR estimate environment. This case presents the higher NMSE compared with the situations with 16 and 32 ONUs. ¨In this situation, the values of the NMSE is limited by the nonconvexity of the power allocation problem. For the case of 48 ONUs the lower NMSE is obtained with p = 2.5 and q = 1.9. This behavior is related to variation of the Beta distribution shape with the alteration of the shape parameters. Herein, the Beta distribution shape parameter values that represent the best trade-off between the exploration (diversification) and the exploitation (intensification) for the power allocation problem using IC-PSO for 16, 32 and 48 ONUs were obtained and summarized in Table III.
Table III. Input IC-PSO parameters values
Number of the ONUs Beta Shape parameter
16 p = 2.0; q = 1.3
32 p = 2.0; q = 1.6
48 p = 2.5; q = 1.9
4.3. IC-PSO versus PSO Resource Allocation
In this section, the IC-PSO and PSO resource allocation have been evaluated considering the network parameters and variables described in the previous sections. In order to obtain a fair comparison between the IC-PSO and PSO power allocation algorithms, the same computational effort, herein represented by the run time, was guaranteed for both algorithms. The simulations were performed with MATLAB (version 7.1) in a domestic computer with 4 GB of RAM and processor Intel Core i5@ 1.6 GHz. Besides, the IC-PSO power allocation will be compared to the conventional PSO power allocation scheme, which was previously validated and compared with other methods [9][10].
Brazilian Microwave and Optoelectronics Society-SBMO received 06 Mar 2018; revised 22 Mar 2018; accepted 14 Jun 2018 value of the transmitted powers; however, it presents high computational complexity when compared with heuristic or meta-heuristic approaches [4][7]. Therefore, the figures-of-merit results obtained with matrix inversion will be utilized to validate the proposed IC-PSO power allocation. Herein, the goal is to evaluate the initial behavior of convergence trend from both heuristic algorithms; therefore, it is considered a maximum number of 800 iterations.
(a) (b) (c)
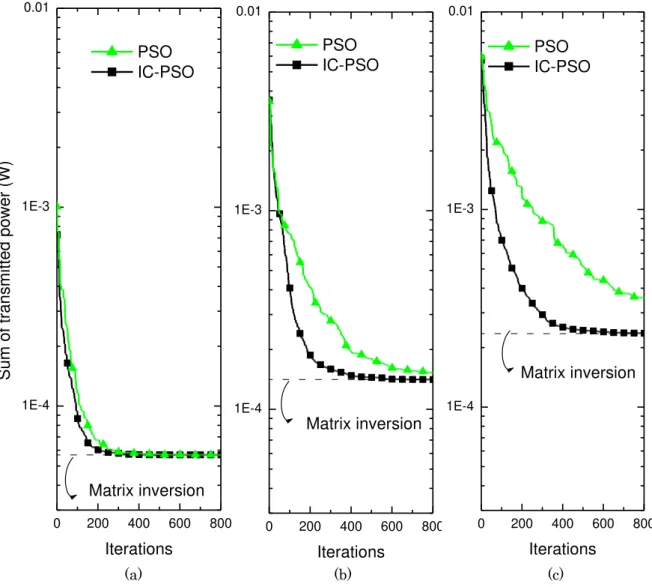
Fig. 3. Sum of the transmitted power versus the number of iterations for PSO and IC-PSO power allocation for (a) 16, (b) 32 and (c) 48 ONUs.
Fig. 3 illustrates the convergence of the transmitted power value obtained with IC-PSO and PSO power allocation schemes to the value obtained with matrix inversion procedure. The convergence behavior is a clear improvement on the velocity of convergence for the IC-PSO power allocation scheme when compared with PSO power allocation scheme, mainly when the number of ONUs increase, i.e. for the number of 32 and 48 ONUs the IC-PSO convergence gain improves substantially. Herein, the number of 32 and 48 ONUs representing the situation of medium and weak SNIR estimates environment, respectively. The faster convergence of the IC-PSO power allocation scheme when the SNIR has deteriorated is related to the utilization of the Beta distribution which provides diversity increasing while aid the exploration (diversification) of undercover regions in the search space. In addition, the damping factor
0 200 400 600 800
1E-4 1E-3 0.01
Matrix inversion
Sum o
f
tra
nsm
itted
po
we
r (W)
Iterations
PSO
IC-PSO
0 200 400 600 800
1E-4 1E-3 0.01
Matrix inversion
Iterations
PSO
IC-PSO
0 200 400 600 800
1E-4 1E-3 0.01
Matrix inversion
based on random numbers generated by chaotic logistic has increased the randomness (diversification) without loss in the exploitation capability of the algorithm. Besides, Fig. 3 (a) depicts the case with 16 ONUs where the SNIR is high; even so, there is a marginal improvement in the convergence performance of the IC-PSO over the conventional PSO optical power allocation procedure. Indeed, under this scenario, the power transmission convergence was obtained with approximately 250 and 350 iterations for IC-PSO and PSO power allocation scheme, respectively. Notice in the Fig. 3 (b), for 32 ONUs, the IC-PSO algorithm was able to achieve convergence after approximately 345 iterations in contrast to the approximately 800 iterations necessary for the PSO power allocation scheme convergence. Besides, the more remarkable situation occurs for 48 ONUs that is illustrated in the Fig. 3 (c), where the convergence of the transmitted power occurs with approximately 450 iterations for IC-PSO power allocation scheme and the PSO power allocation scheme does not present tendency of convergence in the next iterations, here beyond of 800 iterations.
Fig. 4 depicts the normalized mean squared error (NMSE) against the number of iterations for PSO and IC-PSO optical power allocation schemes to precisely evaluate the velocity of
convergence and quality of solutions. In this sense, we have considered more iterations in such
analysis aiming at achieving the condition of the non-improvement on the performance (NMSE
floor condition).
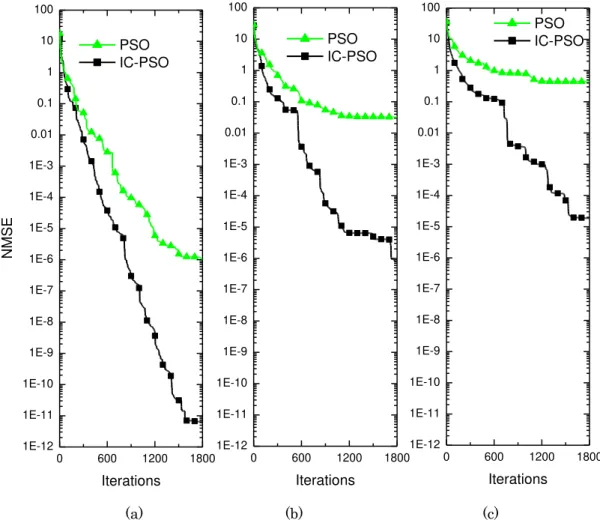
(a) (b) (c)
Fig. 4. Normalized mean squared error (NMSE) versus the number of iterations for PSO and IC-PSO power allocation for (a) 16, (b) 32 and (c) 48 ONUs.
0 600 1200 1800
1E-12 1E-11 1E-10 1E-9 1E-8 1E-7 1E-6 1E-5 1E-4 1E-3 0.01 0.1 1 10 100 NM SE Iterations PSO IC-PSO
0 600 1200 1800
1E-12 1E-11 1E-10 1E-9 1E-8 1E-7 1E-6 1E-5 1E-4 1E-3 0.01 0.1 1 10 100 Iterations PSO IC-PSO
0 600 1200 1800
Brazilian Microwave and Optoelectronics Society-SBMO received 06 Mar 2018; revised 22 Mar 2018; accepted 14 Jun 2018 One can observe from Fig. 4 that the increasing in the number of iterations affects the quality of the solutions (NMSE) of both heuristic PSO and IC-PSO power allocation schemes; however, the proposed IC-PSO procedure achieves a lower NMSE when compared with the conventional PSO power allocation scheme. This behavior is related to the non-convexity of the optical power allocation problem in OCDMA systems, increasing the number of local optima as the problem dimension increases. Such difference in MSE performance between both algorithms is related to the capability of the IC-PSO to execute a broad global search aiming to escape from local optima solutions. However, the faster convergence of the IC-PSO power allocation scheme occurs at expense of the oscillatory behavior to reach the convergence, in contrast to the smoother but slower convergence behavior of the PSO scheme. Notice that in Fig. 4, when there is the tendency of stabilization of the NMSE with approximately 1700 iterations, the difference in the NMSE performance is so huge (five decades) among the PSO and IC-PSO power-rate allocation schemes. Hence the proposed IC-PSO scheme has demonstrated effectiveness and ability to improve substantially the velocity and quality of the solutions (for the same number of iterations) when compared with the PSO power allocation scheme in PON-OCDMA systems in scenarios with high, medium and weak SNIR estimates scenarios.
4.4. Computational Complexity
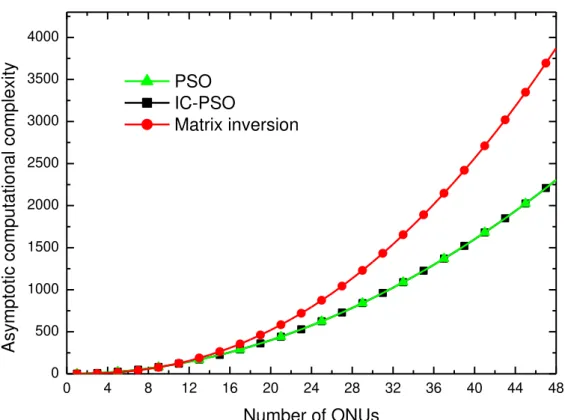
The computational complexity of the resource allocation algorithms could be obtained considering the execution time or the number of mathematical operations. In this work, the computational complexity of the PSO and IC-PSO power allocation algorithms is based on the mathematical number of executed operations (including sums and multiplications) implicit in the optimization problem, Eqs. (2) or (3) [9]. Therefore, the polynomial complexity of PSO power allocation algorithm is of the order , where is the number of nodes in the PON-OCDMA [9]. In addition, in the case of the IC-PSO power allocation is not added a dominant computational complexity term, resulting in the same computational complexity order of the classical PSO power allocation scheme. To illustrate the competitive computational complexity of the PSO and IC-PSO power allocation schemes, the computational complexity of the matrix inversion considering the best situation is given by [9]. Fig. 5 depicts the asymptotic computational complexity versus the number of ONUs for both heuristic PSO, IC-PSO algorithms, as well as deploying matrix inversion approach.
Fig. 5. Asymptotic computational complexity versus the number of active ONUs for heuristic-evolutionary PSO, IC-PSO, as well as the matrix inversion power allocation schemes.
5. Conclusions
In this work, an improved chaos particle swarm optimization (IC-PSO) power allocation algorithm was proposed to improve the convergence velocity and the quality of the algorithm solutions to solve the optimal power allocation problem in PON-OCDMA systems. The proposed IC-PSO utilizes the Beta distribution modeling instead of uniform distribution of the traditional PSO; moreover, a factor of damping based in the chaotic logistic map related to the updating of the best global value was successful introduced. These characteristics have affected the best relation between the performance-complexity, the velocity of algorithm convergence and the quality of the algorithm solutions. The numerical results have demonstrated the effect of the Beta distribution shape parameters in the quality of the solutions of the IC-PSO power allocation scheme, regarding the situations with SNIR estimates in high, medium and weak signal environments. To improve the convergence speed and quality of solution, such shape parameters must be tuned according the number of active ONUs in the network aiming to provide the diversity and the diversification of undercover regions in the search space during the transmitted evolutionary-heuristic power optimization procedure. In addition, the utilization of the chaotic logistic map as damping factor is effective to the IC-PSO scape from the local optimum. There is a considerable improvement in the convergence velocity of the IC-PSO algorithm when compared with the IC-PSO power allocation, mainly in situations with SNIR
0 4 8 12 16 20 24 28 32 36 40 44 48
0 500 1000 1500 2000 2500 3000 3500 4000
Asy
mp
totic com
pu
tatio
na
l com
pl
exi
ty
Number of ONUs
PSO
IC-PSO
Brazilian Microwave and Optoelectronics Society-SBMO received 06 Mar 2018; revised 22 Mar 2018; accepted 14 Jun 2018 estimates in medium and weak signal environments, i.e. in PONs with higher number of ONUs . In addition, the IC-PSO power allocation scheme is effective and able to improve substantially the quality of the solutions with decreasing of approximately 5 decades of normalized mean square error (for the same number of iterations) when compared with the PSO power allocation scheme. Indeed, this convergence increment and quality of the solutions improvement is remarkable, since in the IC-PSO power allocation scheme it does not come with a computational complexity increasing when compared with the PSO power rate allocation.
REFERENCES
[1] H. Song, B.W.Kim, B.Mukherjee, "Long-reach optical access networks: a survey of research challenges, demonstrations, and bandwidth assignment mechanisms", IEEE Commun. Surv. Tutor., vol. 12, n. 1, pp. 112-123, First Quarter 2010.
[2] M. de Andradea, M. Maierb, M P. McGarryc, and M. Reissleind, "Passive optical network (PON) supportted networking," Optical Switching and Networking, vol. 14, pp. 1-10, Aug. 2014.
[3] S. Bindhaiq, A. Sahmah M. Supaat, N. Zulkifli, A. Bakar Mohammad, R. Q. Shaddad, M. A. Elmagzoub, A. Faisal, "Recent development on time and wavelength-division multiplexed passive optical network (TWDM-PON) for next-generation passive optical network stage 2 (NG-PON2)," Optical Switching and Networking, vol. 15, pp. 53-66, jan. 2015.
[4] Tarhuni, T. Korhonen, M. Elmusrati and E. Mutafungwa, "Power Control of Optical CDMA Star Networks", Optics Communications, vol. 259, pp. 655 - 664, Mar. 2006
[5] R.-J. Essiambre, G. Kramer, P. J. Winzer, G. J. Foschini, and B. Goebel, "Capacity limits of optical fiber networks," J. Lightw. Technol., vol. 28, pp. 662-701, 2010.
[6] M. Tang, C. Long and X. Guan, "Nonconvex Optimization for Power Control in Wireless CDMA Networks," Wireless Personal Communications, vol. 58, n. 4, pp. 851-865, 2011.
[7] F. R. Durand, B. Angelico, T. Abrão, "Analysis of Delay and Estimation Uncertainty in Power Control Model for Optical CDMA Network" Optical Switching and Networking. vol. 21, pp. 67-78, July 2016. [8] E. Inaty, R. Raad, P. Fortier, and H. M. H. Shalaby, "A Fair QoS-Based Resource Allocation Scheme
For a Time-Slotted Optical OV-CDMA Packet Networks: a Unified Approach," Journal of Lightwave Technology, vol. 26, no. 21, pp. 1-10, Jan. 2009.
[9] A. J. dos Santos, F. R. Durand, and T. Abrão, "Mitigation of environmental temperature variation effects in OCDMA networks using PSO power control," IEEE/OSA J. Opt. Commun. Netw., vol. 7, no. 8, pp. 707-717, Aug. 2015.
[10]M. de Paula Marques, F. R. Durand and T. Abrão, "WDM/OCDM Energy-Efficient Networks Based on Heuristic Ant Colony Optimization," in IEEE Systems Journal, vol. 10, no. 4, pp. 1482-1493, Dec. 2016.
[11]R. Matsumoto, T. Kodama, S. Shimizu, R. Nomura, K. Omichi, N. Wada, and K. I. Kitayama, "40G-OCDMA-PON system with an asymmetric structure using a single multi-port and sampled SSFBG encoder/ decoders," J. Lightw. Technol., vol. 32, no. 6, pp. 1132-1143, Mar. 2014.
[12]X. Yang, Nature-Inspired Optimization Algorithms, 1st ed. London: Elsevier, 2014.
[13]Bilal Alatas, Erhan Akin, A. Bedri Ozer, Chaos embedded particle swarm optimization algorithms, In Chaos, Solitons & Fractals, Volume 40, Issue 4, 2009, Pages 1715-1734, ISSN 0960-0779, https://doi.org/10.1016/j.chaos.2007.09.063.
[14]Dixiong Yang, Zhenjun Liu, Jilei Zhou, Chaos optimization algorithms based on chaotic maps with different probability distribution and search speed for global optimization, In Communications in Nonlinear Science and Numerical Simulation, Volume 19, Issue 4, 2014, Pages 1229-1246, ISSN 1007-5704, https://doi.org/10.1016/j.cnsns.2013.08.017.
[15]Ernesto Araujo, Leandro dos S. Coelho, Particle swarm approaches using Lozi map chaotic sequences to fuzzy modelling of an experimental thermal-vacuum system, In Applied Soft Computing, Volume 8, Issue 4, 2008, Pages 1354-1364, ISSN 1568-4946, https://doi.org/10.1016/j.asoc.2007.10.016.
[16]Michal Pluhacek, Roman Senkerik, Donald Davendra, Chaos particle swarm optimization with Eensemble of chaotic systems, In Swarm and Evolutionary Computation, Volume 25, 2015, Pages 29-35, ISSN 2210-6502, https://doi.org/10.1016/j.swevo.2015.10.008
[17]Wei-feng Gao, San-yang Liu, Ling-ling Huang, Particle swarm optimization with chaotic opposition-based population initialization and stochastic search technique, In Communications in Nonlinear Science and Numerical Simulation, Volume 17, Issue 11, 2012, Pages 4316-4327, ISSN 1007-5704, https://doi.org/10.1016/j.cnsns.2012.03.015.
scattering spectra, In Optics Communications, Volume 376, 2016, Pages 56-66, ISSN 0030-4018, https://doi.org/10.1016/j.optcom.2016.04.049
[19]Mohammad Hadi, Mohammad Reza Pakravan, "Analysis and Design of Adaptive OCDMA Passive Optical Networks", Lightwave Technology Journal of, vol. 35, pp. 2853-2863, 2017
[20]S. Yoshima, Y. Tanaka, N. Kataoka, N. Wada, J. Nakagawa, and K. Kitayama, "Full-duplex, extended-reach 10G-TDM-OCDM-PON system without En/decoder at ONU," J. Lightw. Technol., vol. 31, no. 1, pp. 43-49, Jan. 2013.
[21]M. M. Ali, "Synthesis of the Beta-distribution as an aid to stochastic global optimization," Comput. Statist. Data Anal., vol. 52, no. 1, pp. 133-149, 2007.
[22]Matsumoto Ryosuke, Kodama Takahiro, Morita Koji, Wada Naoya, Kitayama Ken-ichi. "Scalable two- and three-dimensional optical labels generated by 128-port encoder/decoder for optical packet switching." Optics express 23 (20): 25747-61. 2015
[23]T. A. Bruza Alves, F. R. Durand, B. A. Angelico and T. Abrao, "Power allocation scheme for OCDMA NG-PON with proportional-integral-derivative algorithms," J. Opt. Commun. Netw., vol. 8, no. 9, pp. 645-655, September 1 2016.
[24]F. Durand and T. Abrão, "Energy-Efficient Power Allocation for WDM/OCDM Networks with Particle Swarm Optimization," J. Opt. Commun. Netw., vol. 5, no. 5, pp. 512-523, May. 2013.