BGD
11, 373–415, 2014Iron nutritional status of large diatoms in the Sea of Okhotsk
K. Suzuki et al.
Title Page
Abstract Introduction
Conclusions References
Tables Figures
◭ ◮
◭ ◮
Back Close
Full Screen / Esc
Printer-friendly Version Interactive Discussion
Discussion
P
a
per
|
D
iscussion
P
a
per
|
Discussion
P
a
per
|
Discuss
ion
P
a
per
|
Biogeosciences Discuss., 11, 373–415, 2014 www.biogeosciences-discuss.net/11/373/2014/ doi:10.5194/bgd-11-373-2014
© Author(s) 2014. CC Attribution 3.0 License.
Open Access
Biogeosciences Discussions
This discussion paper is/has been under review for the journal Biogeosciences (BG). Please refer to the corresponding final paper in BG if available.
Spatial variability in iron nutritional status
of large diatoms in the Sea of Okhotsk
with special reference to the Amur River
discharge
K. Suzuki1,2, A. Hattori-Saito1, Y. Sekiguchi1, J. Nishioka3, M. Shigemitsu1, T. Isada1, H. Liu4, and R. M. L. McKay5
1
Faculty of Environmental Earth Science/Graduate School of Environmental Science, Hokkaido University, North 10 West 5, Kita-ku, Sapporo 060-0810, Japan
2
CREST, Japan Science and Technology, North 10 West 5, Kita-ku, Sapporo 060-0810, Japan
3
Institute of Low Temperature Science, Hokkaido University, North 19 West 8, Kita-ku, Sapporo 060-0810, Japan
4
Department of Biology, Hong Kong University of Science and Technology, Clear Water Bay, Hong Kong
5
BGD
11, 373–415, 2014Iron nutritional status of large diatoms in the Sea of Okhotsk
K. Suzuki et al.
Title Page
Abstract Introduction
Conclusions References
Tables Figures
◭ ◮
◭ ◮
Back Close
Full Screen / Esc
Printer-friendly Version Interactive Discussion
Discussion
P
a
per
|
D
iscussion
P
a
per
|
Discussion
P
a
per
|
Discuss
ion
P
a
per
|
Received: 19 November 2013 – Accepted: 6 December 2013 – Published: 8 January 2014
Correspondence to: K. Suzuki ([email protected])
Published by Copernicus Publications on behalf of the European Geosciences Union.
BGD
11, 373–415, 2014Iron nutritional status of large diatoms in the Sea of Okhotsk
K. Suzuki et al.
Title Page
Abstract Introduction
Conclusions References
Tables Figures
◭ ◮
◭ ◮
Back Close
Full Screen / Esc
Printer-friendly Version Interactive Discussion
Discussion
P
a
per
|
D
iscussion
P
a
per
|
Discussion
P
a
per
|
Discuss
ion
P
a
per
|
Abstract
The Sea of Okhotsk is known as one of the most biologically productive regions among the world’s oceans, and its productivity is supported in part by the discharge of iron (Fe)-rich water from the Amur River. However, little is known about the effect of riverine-derived Fe input on the physiology of the large diatoms which often flourish in surface
5
waters of the productive continental shelf region. We conducted diatom-specific im-munochemical ferredoxin (Fd) and flavodoxin (Fld) assays in order to investigate the spatial variability of Fe nutritional status in the microplankton-sized (20–200 µm; here-after micro-sized) diatoms. The Fd index, defined as the proportion of Fd to the sum of Fd plus Fld accumulations in the cells, was used to assess their Fe nutritional
sta-10
tus. Additionally, active chlorophyll fluorescence measurements using pulse-amplitude-modulated (PAM) fluorometry were carried out to obtain the maximum photochemical quantum efficiency (Fv/Fm) of photosystem II for the total micro-sized phytoplankton
assemblages including diatoms. During our observations in the summer of 2006, the micro-sized diatoms were relatively abundant (>10 µg C L−1) in the neritic region, and
15
formed a massive bloom in Sakhalin Bay near the mouth of the Amur River. Values of the Fd index and Fv/Fm were high (>0.9 and>0.65, respectively) near the river
mouth, indicating that Fe was sufficient for growth of the diatoms. However, in oceanic waters of the Sea of Okhotsk, the diatom Fd index declined as cellular Fld accumula-tion increased. These results suggest that there was a distinct gradient in Fe nutriaccumula-tional
20
status in the micro-sized diatoms from near the Amur River mouth to open waters in the Sea of Okhotsk. A significant correlation between dissolved Fe (D-Fe) concentra-tion and the Fd index was found in waters offSakhalin Island, indicating that D-Fe was a key factor for the photophysiology of this diatom size class. In the vicinity of the Kuril Islands between the Sea of Okhotsk and the Pacific Ocean, micro-sized diatoms only
25
BGD
11, 373–415, 2014Iron nutritional status of large diatoms in the Sea of Okhotsk
K. Suzuki et al.
Title Page
Abstract Introduction
Conclusions References
Tables Figures
◭ ◮
◭ ◮
Back Close
Full Screen / Esc
Printer-friendly Version Interactive Discussion
Discussion
P
a
per
|
D
iscussion
P
a
per
|
Discussion
P
a
per
|
Discuss
ion
P
a
per
|
possibly encountered Fe and light co-limitations. The differential expressions of Fd and Fld in micro-sized diatoms helped us to understand how these organisms respond to Fe availability in the Sea of Okhotsk in connection with the Amur River discharge.
1 Introduction
Iron (Fe) plays an important role in metabolic processes such as photosynthesis,
respi-5
ration, and nitrogen assimilation for marine phytoplankton (Twining and Baines, 2013; Behrenfeld and Milligan, 2013). Over the last two decades, much attention has been focused on the availability of Fe to phytoplankton in the open ocean, especially high nu-trient, low chlorophyll (HNLC) waters such as the Southern Ocean, the subarctic Pacific and the eastern equatorial Pacific (de Baar et al., 2005; Boyd et al., 2007). However,
10
it has become evident that Fe limitation for phytoplankton growth can occur not only in offshore waters, but also in coastal upwelling regions and marginal seas (e.g., Bru-land et al., 2001; Hutchins et al., 2002; Aguilar-Islas et al., 2007; Sedwick et al., 2011; Gerringa et al., 2012). In coastal waters, both riverine and sedimentary Fe can cause pronounced near-shore to offshore gradients in dissolved Fe concentrations. Riverine
15
Fe is an important supply term at source, but much of the incoming Fe is rapidly scav-enged onto sinking particles in estuaries (Boyle et al., 1977; Boyd and Ellwood, 2010). The removal of Fe can vary depending on the origin and chemical structure of the Fe provided into the coastal waters, because Fe complexes with organic ligands may act to protect Fe from removal by scavenging (Buck et al., 2007). Therefore, to determine
20
to what extent Fe is available for phytoplankton growth in such regions is crucial to un-derstand constraints on primary production (Chase et al., 2007), which in turn controls the structure and dynamics of lower trophic level processes in the near-shore environ-ment. Among the phytoplankton, it is well known that large diatoms often flourish in coastal waters (e.g., Orlova et al., 2004; Suzuki et al., 2011). Such large diatoms tend
25
to be grazed by large zooplankton, resulting in shorter, simpler food webs that may re-sult in more efficient matter and energy transfer (Ryther, 1969). However, the growth of
BGD
11, 373–415, 2014Iron nutritional status of large diatoms in the Sea of Okhotsk
K. Suzuki et al.
Title Page
Abstract Introduction
Conclusions References
Tables Figures
◭ ◮
◭ ◮
Back Close
Full Screen / Esc
Printer-friendly Version Interactive Discussion
Discussion
P
a
per
|
D
iscussion
P
a
per
|
Discussion
P
a
per
|
Discuss
ion
P
a
per
|
large diatoms is expected to be more sensitive to Fe deficit than that of small cells due to their small cell surface to volume ratios (Sunda and Huntsman, 1997; Timmermans et al., 2004; Sarthou et al., 2005). On the other hand, to our knowledge, no literature has been published on spatiotemporal variability in the Fe nutritional status of large diatoms in coastal or marginal seas.
5
The Sea of Okhotsk, one of the marginal seas of the western North Pacific, is known as one of the most biologically productive regions among the world’s oceans, especially along its continental shelf (Sorokin and Sorokin, 1999; Isada et al., 2013). Diatoms account for much of the production in these waters with growth supported by sea ice melting during spring and the Amur River discharge from summer to fall (Nakatsuka
10
et al., 2004). In winter, the Sea of Okhotsk is covered with sea ice and is the most southern extension of the region of seasonal ice formation (Kimura and Wakatsuchi, 2000). From spring to summer, increases in irradiance and temperature lead to the melting of sea ice, resulting in the formation of a pycnocline in surface waters of the Sea of the Okhotsk. Also impacting the region is the Amur River, the longest river (4350 km)
15
in the far eastern region of Russia, supplying not only large volumes of freshwater (Ogi et al., 2001), but also high levels of nutrients including Fe and organic matter into the Sea of Okhotsk via the southward-flowing East Sakhalin Current which runs along the eastern coast of Sakhalin Island (Nishioka et al., 2007; Andreev and Pavlova, 2009; Nagao et al., 2010; Takao et al., 2013). According to Nagao et al. (2010), Amur River
20
water contains ca. 0.2 mg L−1 (i.e., 4 µM) of dissolved Fe and its annual flux from the river to the Sea of Okhotsk is estimated as (1.1±0.7)×1011g yr−1. The dissolved Fe level is four orders of magnitude higher than that typically reported for pelagic ocean surface waters (<0.2 nM; Johnson et al., 1997) and the annual flux corresponds to ca. 10 % of the global riverine value (Raiswell, 2006). The changes in physical and
25
BGD
11, 373–415, 2014Iron nutritional status of large diatoms in the Sea of Okhotsk
K. Suzuki et al.
Title Page
Abstract Introduction
Conclusions References
Tables Figures
◭ ◮
◭ ◮
Back Close
Full Screen / Esc
Printer-friendly Version Interactive Discussion
Discussion
P
a
per
|
D
iscussion
P
a
per
|
Discussion
P
a
per
|
Discuss
ion
P
a
per
|
Regarding the Fe dynamics in the study area, Nishioka et al. (2007, 2011, 2013, 2013) demonstrated the importance of the transport of intermediate dense shelf water (DSW) from the Sea of Okhotsk to the North Pacific via the Kuril Straits, mainly through the Bussol’ Strait, the deepest channel of the Kuril Islands. In winter, large amounts of sea ice are produced along the Siberian coast on the northwestern continental shelf of
5
the Sea of Okhotsk. The sea ice formation generates a large volume of Fe-containing brine, which subsequently settles to the bottom of the northwestern continental shelf along the Siberian coast to form the DSW formation (Martin et al., 1998). The high levels of Fe derived from the Amur River should contribute significantly to the contents of Fe in the brine. Additionally, large amounts of dissolved and particulate Fe are
in-10
troduced to the DSW by re-suspension of sediments (Nishioka et al., 2013). Since the density of DSW is relatively low (26.8–27.0σθ), it tends to penetrate the upper part (250–450 m) of the Okhotsk Sea Intermediate Water (OSIW). The OSIW flows south-ward along the east coast of Sakhalin Island and is transported to the Kuril Straits. Because the tidal flow generates intense vertical mixing around the Bussol’ Strait (Yagi
15
and Yasuda, 2012), the mixing transports the deep water with high Fe content to the surface (Nishioka et al., 2007, 2013). Although these processes should enhance the availability of Fe for phytoplankton growth, little knowledge is available on this issue.
In this study, we report on the status of Fe nutrition in microplankton-sized (i.e., 20– 200 µm, hereafter micro-sized) diatoms with reference to dissolved Fe levels in surface
20
waters of the western part of the Sea of Okhotsk during late summer 2006. Fe de-ficiency in the large diatoms was assessed by determining the ferredoxin (Fd) index, which is defined as the proportion of Fd to the sum of Fd plus flavodoxin (Fld) accu-mulations (Doucette et al., 1996). Under Fe deficient conditions, the Fe-S protein Fd, which is located in the acceptor side of photosystem I (PSI), can be replaced by a
func-25
tionally equivalent non-Fe-containing Fld in most cyanobacteria and some eukaryotic algae including diatoms (Zurbriggen et al., 2007). The small (6–15 kDa) non-heme pro-tein Fd accepts electrons from PSI and transfers them to Fd NADP+ reductase (FNR), acting in both cyclic and non-cyclic electron transport systems (LaRoche et al., 1999).
BGD
11, 373–415, 2014Iron nutritional status of large diatoms in the Sea of Okhotsk
K. Suzuki et al.
Title Page
Abstract Introduction
Conclusions References
Tables Figures
◭ ◮
◭ ◮
Back Close
Full Screen / Esc
Printer-friendly Version Interactive Discussion
Discussion
P
a
per
|
D
iscussion
P
a
per
|
Discussion
P
a
per
|
Discuss
ion
P
a
per
|
By comparison, Fld, a flavoprotein ranging from 16–20 kDa (Zurbriggen et al., 2007), has an oxidation-reduction potential resembling that of Fd (ca.−400 mV; Medina and Gómez-Moreno, 2004), while the energetic cost of Fld synthesis could be slightly higher than that of Fd due to the larger size. The Fd index or the abundance of Fld have been used as diagnostic markers for cellular Fe status in marine diatoms in the laboratory
5
and field (e.g., LaRoche et al., 1996; Erdner and Anderson, 1999; McKay et al., 1999; Pankowski and McMinn, 2009a; Suzuki et al., 2009; Hattori-Saito et al., 2010). The protein expression assays can obviate the weaknesses of conventional bottle incuba-tion methods (i.e., so-called the bottle effect; Carpenter and Lively, 1980, and trace metal contamination; Fitzwater et al., 1982), because they do not require any bottle
10
incubation. The immunochemical detection of Fd and Fld with the western blot tech-nique used in this study are useful to estimate taxon-specific Fe nutritional status in a semi-quantitative manner. Although Fd and Fld analyses with high-performance liq-uid chromatography (HPLC) can yield more quantitative data (Doucette et al., 1996; Erdner and Anderson, 1999), the HPLC technique would require a large quantity of
ex-15
tracted protein and cannot provide taxonomic discrimination. In this study, we revealed that there was a distinct gradient of Fe nutritional status in the micro-sized diatoms from near the Amur River mouth to open waters in the Sea of Okhotsk using the immuno-chemical Fd and Fld assays.
2 Materials and methods
20
2.1 Hydrographic observations
Our observations were conducted in the Sea of Okhotsk from 13 August to 14 Septem-ber 2006, on board the Russian R/VProfessor Khromov as part of the Amur-Okhotsk project of the Research Institute of Humanity and Nature (RIHN), Japan. The sampling stations were located in the western part of the Sea of Okhotsk, which is influenced
25
Pa-BGD
11, 373–415, 2014Iron nutritional status of large diatoms in the Sea of Okhotsk
K. Suzuki et al.
Title Page
Abstract Introduction
Conclusions References
Tables Figures
◭ ◮
◭ ◮
Back Close
Full Screen / Esc
Printer-friendly Version Interactive Discussion
Discussion
P
a
per
|
D
iscussion
P
a
per
|
Discussion
P
a
per
|
Discuss
ion
P
a
per
|
cific (Fig. 1). Seawater samples except for the ferredoxin (Fd) and flavodoxin (Fld) assays andFv/Fmmeasurements described below were obtained from the surface (2–
6 m) using a CTD carousel multisampler system (CTD-CMS) with acid-cleaned Teflon-coated Niskin-X bottles. Nutrients (nitrate plus nitrite, phosphate, and silicate) were determined with a segmented continuous flow autoanalyzer (QuAAtro, Bran+Luebbe)
5
following the manufacturer’s protocol. The procedure of Fe analysis is detailed in Nish-ioka et al. (2011, 2013). In brief, subsampling was done with 0.22 µm Durapore filters (Millipak 100, Millipore Corp.) connected to the water sampler Niskin-X spigot, and the filtrate was collected in acid-cleaned LDPE bottles under gravity pressure. The filtrate samples were maintained at pH∼2 for more than one month at room temperature, and
10
then the pH was adjusted to 3.2 immediately before analysis onshore. The dissolved Fe (leachable Fe in 0.22 µm filtrate; hereafter D-Fe) was analyzed with a FIA chemi-luminescence detection system (Obata et al., 1993). For chlorophyll (Chl)a measure-ments, seawater samples were filtered onto 25 mm Whatman GF/F glass-fiber filters under gentle vacuum (<0.013 MPa). After filtration, the filters were soaked in 6 mLN,
15
N-dimethylformamide (DMF) in a glass cuvette at −20◦C for over a day to extract
al-gal pigments (Suzuki and Ishimaru, 1990). The Chl a concentration was determined using a Turner Designs 10–AU fluorometer following the non-acidification method of Welshmeyer (1994).
2.2 Light microscopy
20
Seawater collected with the Niskin bottles was preserved using 20 % formalin buffered with sodium acetate (0.5 % final concentration; Horner, 2002) before analysis. The samples were concentrated on land using Utermöhl chambers (Hydro-Bios Apparate-bau GmbH) and analyzed with a Leica DM IL inverted microscope. Identification of diatoms was carried out following Tomas (1997). Micro-sized diatoms were identified
25
with≥20 µm in apical, transapical or pervalvar axes. Cell volumes were estimated
for each species by applying cellular dimensions to the formulae for solid geometric shapes most closely matching the shapes of the cells (Hillebrand et al., 1999). The
BGD
11, 373–415, 2014Iron nutritional status of large diatoms in the Sea of Okhotsk
K. Suzuki et al.
Title Page
Abstract Introduction
Conclusions References
Tables Figures
◭ ◮
◭ ◮
Back Close
Full Screen / Esc
Printer-friendly Version Interactive Discussion
Discussion
P
a
per
|
D
iscussion
P
a
per
|
Discussion
P
a
per
|
Discuss
ion
P
a
per
|
carbon biomass of diatoms was calculated with the empirical equations of Menden-Deuer and Lessard (2000). To examine the dissimilarity of the diatom species detected (i.e., species richness) among the stations, a similarity matrix was obtained using the Bray-Curtis index (Bray and Curtis, 1957) and the program EstimateS (ver. 9.1.0; Col-well, 2013). For constructing the matrix, the presence or absence of diatom species in
5
a sample was scored as 1 (present) or 0 (absent). An unweighted pair group cluster-ing method uscluster-ing the arithmetic mean (UPGMA) was applied to the similarity matrix to classify the stations into groups.
2.3 Ferredoxin (Fd) and flavodoxin (Fld) assays
Seawater was collected from the water intake (ca. 5 m) of the research vessel and
fil-10
tered through a plankton net of 20 µm nylon mesh followed by passing through 200 µm nylon mesh to remove large zooplankton. After the pre-filtration, cells were collected onto 5 µm nylon mesh, rinsed from the nylon mesh with the filtered seawater prepared with Whatman GF/F filters, and concentrated into a pellet by centrifugation. The sam-ples obtained were stored in liquid nitrogen or a deep-freezer (−80◦C) until analysis on
15
land. Levels of diatom Fd and Fld in the microplankton size-fraction (20–200 µm) were determined following Suzuki et al. (2009) with a few modifications. Single or duplicate samples per sampling station were analyzed and the duplicate data obtained were av-eraged. In brief, a pellet was sonicated with a Branson SONIFIER model 250 in ice-cold acetone containing 10 % trichloroacetic acid (TCA) and 0.07 % 2-mercaptoethanol, and
20
the extracts were stored at−20◦C for 1 h. Precipitated protein was centrifuged, rinsed
with acetone, suspended in 1 % SDS solution and heated at 95◦C for 3 min. Total tein concentration in the solution was determined with BCA assay (Pierce). The pro-tein solution was mixed with an equal volume of 2×PAGE-reducing sample buffer with
SDS-Tris-Gly buffer (Laemmli, 1970). For SDS-PAGE, samples containing 10 µg of
pro-25
Mem-BGD
11, 373–415, 2014Iron nutritional status of large diatoms in the Sea of Okhotsk
K. Suzuki et al.
Title Page
Abstract Introduction
Conclusions References
Tables Figures
◭ ◮
◭ ◮
Back Close
Full Screen / Esc
Printer-friendly Version Interactive Discussion
Discussion
P
a
per
|
D
iscussion
P
a
per
|
Discussion
P
a
per
|
Discuss
ion
P
a
per
|
branes containing transferred proteins were blocked overnight in phosphate-buffered saline buffer containing Tween 20 (PBST) and 1 % bovine serum albumin. Blots were subsequently incubated for 1 h with primary antibody diluted (1 : 10 000) in Can Get Signal Solution 1 (Toyobo Co. Ltd.) for anti-Fd or in PBST for anti-Fld antibodies against diatoms followed by rinsing in the respective buffers (3×10 min). The anti-Fd antibody
5
was raised against an antigen of the synthetic peptide, N-LVHQEDELY-C, correspond-ing to the C-terminal end of Fd encoded by thepetF gene of diatoms. The anti-Fld antibody derived from diatom protein is detailed in LaRoche et al. (1995). The blots were incubated for 1 h with donkey anti-rabbit IgG-horseradish peroxidase conjugate diluted in each buffer solution (1 : 25 000). Immunoreactive proteins were detected by
10
chemiluminescence using the ECL Plus reagent set (GE Healthcare), and the chemilu-minescent signal was captured with a cooled CCD camera (Ez-Capture, Atto Co. Ltd.). The bands obtained were quantified with Gel-Pro Analyzer (ver. 4.5) software (Media Cybernetics). The intensity of each band was normalized to that of the positive con-trols of Fd or Fld, which were obtained from the synthetic peptide connected to a 27
15
kDa carrier protein (New England Bio Labs) and from an Fe-deficient culture of the centric diatomThalassiosira nordenskioeldii, respectively. To evaluate the extent of Fe deficiency in micro-sized diatoms, we adopted the Fd index [=Fd/(Fd+Fld)] proposed by Doucette et al. (1996). In Fe-sufficient algae, the Fd index approaches 1 (e.g., Li et al., 2004; Strzepek and Harrison, 2004), indicating that only Fd has accumulated in
20
the cells.
2.4 HPLC pigment analysis
For estimating phytoplankton community composition in the micro-sized phytoplank-ton, pigment analyses were conducted with high-performance liquid chromatography (HPLC). The acetone extracts from the pellets for the Fd and Fld assays (see Sect. 2.3)
25
were filtered through 0.45 µm PTFE filters to remove fine particles. The 250 µL filtrate was mixed with 250 µL of 28 mM tetrabutylammonium acetate (TBAA) aqueous solu-tion, and 250 µL of sample was injected into a Shimadzu CLASS-VP HPLC system
BGD
11, 373–415, 2014Iron nutritional status of large diatoms in the Sea of Okhotsk
K. Suzuki et al.
Title Page
Abstract Introduction
Conclusions References
Tables Figures
◭ ◮
◭ ◮
Back Close
Full Screen / Esc
Printer-friendly Version Interactive Discussion
Discussion
P
a
per
|
D
iscussion
P
a
per
|
Discussion
P
a
per
|
Discuss
ion
P
a
per
|
equipped with a photo-diode array detector (SPD-M10A VP) and a Zorbax Eclipse XDB-C8 column (3.5 µm particle size, 4.6×150 mm). Following Van Heukelem and Thomas (2001), we used a binary solvent system consisting of solvent A (70 : 30v/v
methanol and 28 mM TBAA at pH 6.5) and solvent B (methanol). The flow rate was held constant at 1.2 mL min−1. Pigments were separated with a linear gradient from
5
5 % to 95 % B over the course of 22 min, followed by an isocratic hold at 95 % B for 8 min. The column temperature was kept at 60◦C. Pigment standards were obtained from DHI, Sigma-Aldrich, and Extrasynthese.
2.5 PAM fluorometry
The onboard measurements with pulse-amplitude-modulated (PAM) fluorometry were
10
conducted in the vicinity of Sakhalin Island (i.e., Stns B1–G16). An aliquot of the pellets (20–200 µm in size) collected for the Fd and Fld assays (see Sect. 2.3) was suspended in filtered seawater, transferred to acid-cleaned amber-colored high density polyethy-lene (HDPE) bottles and placed in an incubator adjusted to the in situ surface water temperature for 30 min in order to open the reaction centers of photosystem II (PSII) for
15
the micro-sized phytoplankton. The water samples were transferred to a quartz cell un-der low light conditions and analyzed in the dark using a Water-PAM fluorometer (Heinz Waltz GmbH) with red LEDs (650–650 nm in peak emission) to obtain the maximum photochemical quantum efficiency (Fv/Fm) of PSII for total micro-sized phytoplankton.
The measurements were repeated at least three times and the data obtained were
20
averaged.
3 Results
3.1 Hydrography
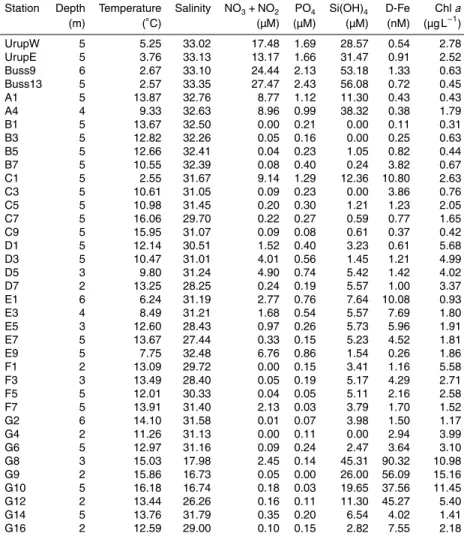
In terms of the geographic (Fig. 1) and hydrographic conditions (Table 1, Fig. 2), the study area was divided into two realms: north and east of Sakhalin Island (Stns B1–
BGD
11, 373–415, 2014Iron nutritional status of large diatoms in the Sea of Okhotsk
K. Suzuki et al.
Title Page
Abstract Introduction
Conclusions References
Tables Figures
◭ ◮
◭ ◮
Back Close
Full Screen / Esc
Printer-friendly Version Interactive Discussion
Discussion
P
a
per
|
D
iscussion
P
a
per
|
Discussion
P
a
per
|
Discuss
ion
P
a
per
|
G16) and the vicinity of the Kuril Islands (Stns UrupW–A4). The upper 2–6 m layer from which we collected samples at each station was within the surface mixed layer. The lowest salinity was observed at Stn G9 with the influence of fresh water reaching to Stns C1–C9 (<32 in salinity), consistent with high discharge of fresh water from the Amur River and distributed along the East Sakhalin coast through the southward-flowing East
5
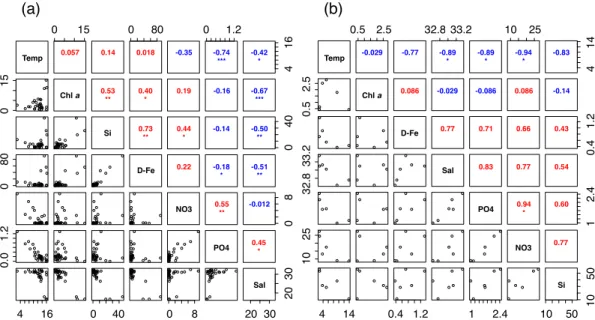
Sakhalin Current (Ohshima et al., 2002). Higher concentrations (>30 nM) of D-Fe were observed at Stns G8–12 near the Amur River mouth, where Chl a levels were also high (>5 µg L−1). OffSakhalin Island, significant correlations between salinity and D-Fe or silicate were found (Fig. 2a; Spearman’s rank correlation coefficientρ >0.5,p <
0.01). In addition, a correlation between D-Fe and silicate was also high near Sakhalin
10
Island (ρ=−0.73, p <0.001). These results suggest that both D-Fe and silicate were
mainly derived from the Amur River discharge. Nitrate plus nitrite and phosphate levels were generally low (<1 µM), although higher levels (>2 µM) of nitrate plus nitrite were sometimes observed on the continental shelf along the east coast of Sakhalin Island. A negative correlation (ρ=−0.67,p <0.001) between salinity and Chlabiomass was
15
observed offSakhalin Island.
At Stns UrupW–A4 offthe Kuril Islands, salinity and macronutrient levels were sub-stantially higher than those at the stations off Sakhalin Island (Table 1). The high macronutrient concentrations were induced coincident with intense tidal-flow-induced vertical mixing (Yagi and Yasuda, 2012). Significant negative correlations between
tem-20
perature and nitrate plus nitrite or phosphate also existed (Fig. 2b). Both D-Fe and Chl
a concentrations were variable among stations (0.38–1.33 nM and 0.43–2.78 µg L−1, respectively) and they did not show significant relationship with the other environmen-tal parameters offthe Kuril Islands.
3.2 Micro-sized diatoms
25
The distribution pattern of the carbon biomass of micro-sized diatoms was generally similar to that of Chlabiomass in the study area (Fig. 3). The carbon biomass of these diatoms at neritic Stns G9 and C1 was relatively high (>100 µg C L−1), whereas its
BGD
11, 373–415, 2014Iron nutritional status of large diatoms in the Sea of Okhotsk
K. Suzuki et al.
Title Page
Abstract Introduction
Conclusions References
Tables Figures
◭ ◮
◭ ◮
Back Close
Full Screen / Esc
Printer-friendly Version Interactive Discussion
Discussion
P
a
per
|
D
iscussion
P
a
per
|
Discussion
P
a
per
|
Discuss
ion
P
a
per
|
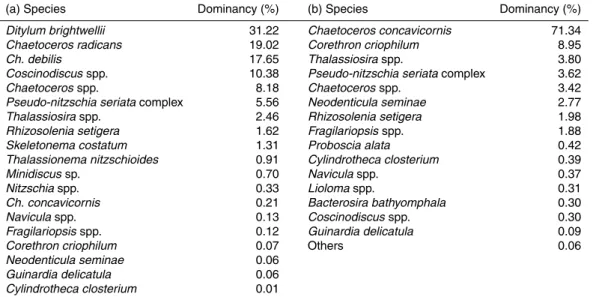
concentration tended to decrease offshore from the east coast of Sakhalin Island. The dominant micro-sized diatoms principally consisted of the centricsDitylum brightwelii,
Chaetoceros radicans,Ch. debilis and Coscinodiscus spp. in the vicinity of Sakhalin Island (Table 2a). By comparison, Ch. concavicornis predominated the micro-sized diatoms near the Kuril Islands (Table 2b). The compositions of the micro-sized diatoms
5
detected in the vicinity of the Kuril Islands (i.e., at Stns UrupW, UrupE, A1 and A4) were similar to each other (Fig. 4), whereas those off Sakhalin Island were rather spatially variable.
3.3 Fd index
Relative intensities of Fd and Fld were variable among stations (Fig. 5). No relationship
10
was found between each intensity and D-Fe or carbon biomass of micro-sized diatoms (Spearman’s rank correlation,p >0.05). Intensities of Fd plus Fld (<0.04) at Stns F1– G4 and G16 were lower than those at other stations (Fig. 5) and were close to the detection limit (i.e., background levels). Therefore, values of the Fd index at Stns F1– G4 and G16 were not used for further analyses. The cut offvalue of 0.04 corresponded
15
to 3 % of the maximum intensity (1.33) of Fd plus Fld at Stn B1. The low intensities (<0.04) of Fd plus Fld were probably caused by the high amount of proteins derived from detritus and micro-sized plankton other than diatoms (e.g., dinoflagellates and planktonic ciliates).
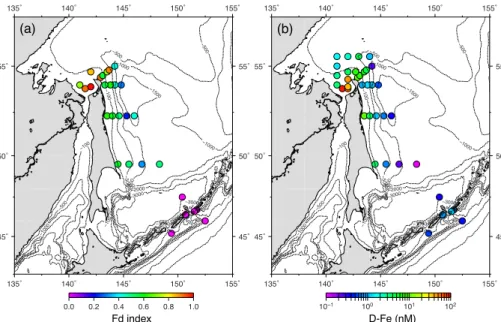
A high Fd index (>0.9) was measured for the micro-sized diatoms sampled at Stns
20
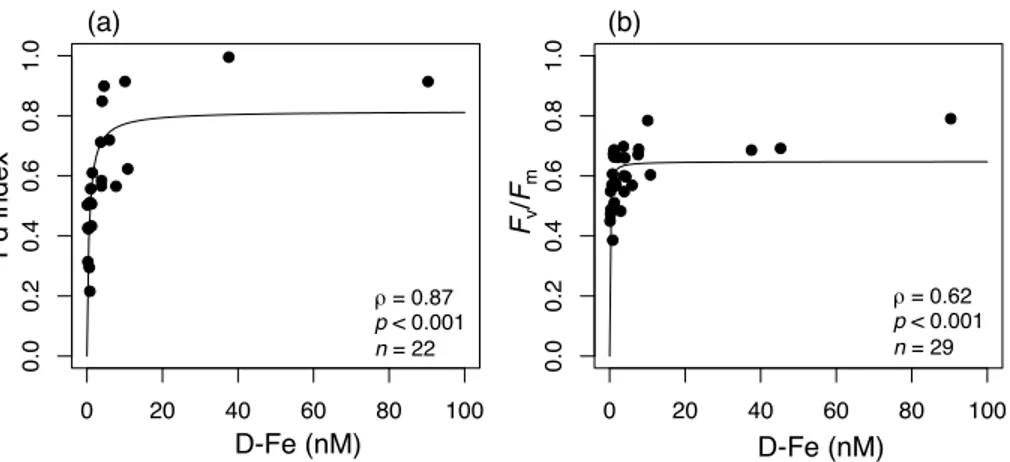
G8 and G10 where D-Fe concentrations were also high (Fig. 6 and Table 1). Both the Fd index and D-Fe tended to be lower offshore from near the mouth of the Amur River. Although no significant relationship was observed between salinity and the Fd index near Sakhalin Island (Fig. 7), a high correlation was found between D-Fe and the Fd index in this area (Fig. 8a;ρ=0.87,p <0.001). In the vicinity of the Kuril Islands, only
25
BGD
11, 373–415, 2014Iron nutritional status of large diatoms in the Sea of Okhotsk
K. Suzuki et al.
Title Page
Abstract Introduction
Conclusions References
Tables Figures
◭ ◮
◭ ◮
Back Close
Full Screen / Esc
Printer-friendly Version Interactive Discussion
Discussion
P
a
per
|
D
iscussion
P
a
per
|
Discussion
P
a
per
|
Discuss
ion
P
a
per
|
3.4 Pigments in micro-sized phytoplankton
The major chemotaxonomic algal pigments detected were Chla, fucoxanthin (Fucox), and peridinin (Peri). Relative compositions (%) of these pigments are shown in Fig. 9. As pellet size was not constant between samples, absolute pigment levels in the pellets were not estimated. Phaeopigments such as phaeophorbide a were rarely detected,
5
indicating that 10 % TCA in the acetone extracts (pH ∼5) had minimal affect on the pigment compositions. As a haptophyte marker, 19’-hexanoyloxyfucoxanthin was oc-casionally detected, but the pigment was minor. A multiple regression analysis was conducted using Chl a, Fucox and Peri, assuming that Fucox and Peri were derived from diatoms and dinoflagellates, respectively (Vidussi et al., 2001). As a result, we
10
obtained the following regression equation:
[Chla]=1.71[Fucox]+0.90[Peri] (R2=0.97,F value=587,p <0.01) (1) where [Chla], [Fucox], and [Peri] are the concentrations of Chla, Fucox, and Peri in the acetone extracts and those correspond to the fractions of each pigment in Fig. 9. The coefficient (1.71) of Fucox was within the typical ratio between 1.4 and 1.8 for
15
diatoms (Vesk and Jeffrey, 1977), while that of Peri (0.90) was lower than the values (1.5–2.4) reported by Jeffrey et al. (1975) and Vesk and Jeffrey (1977). The regres-sion analysis revealed that diatoms generally became predominant in the micro-sized phytoplankton both near the Kuril Islands and near the coast of Sakhalin Island or the mainland of Russia, whereas Peri-containing dinoflagellates tended to dominate in the
20
more open waters of the Sea of Okhotsk (Fig. 10).
3.5 PAM fluorometry
HigherFv/Fmvalues for the microphytoplankton were observed in and around Sakhalin
Bay (Stns F1–G16 and E1–2, respectively; Fig. 11). In particular,Fv/Fmwas the highest
(0.791) at Stn G8 where D-Fe levels were elevated and macronutrients had not been
25
depleted (Table 1). The maximum theoretical value of Fv/Fm for eukaryotic algae is
BGD
11, 373–415, 2014Iron nutritional status of large diatoms in the Sea of Okhotsk
K. Suzuki et al.
Title Page
Abstract Introduction
Conclusions References
Tables Figures
◭ ◮
◭ ◮
Back Close
Full Screen / Esc
Printer-friendly Version Interactive Discussion
Discussion
P
a
per
|
D
iscussion
P
a
per
|
Discussion
P
a
per
|
Discuss
ion
P
a
per
|
generally considered to be 0.6–0.8 as estimated from multiple turnover PAM fluorom-etry (Büchel and Wilhelm, 1993). Values of Fv/Fm tended to become lower offshore
from near the mouth of the Amur River coincident with both declining D-Fe and Fd in-dex. A significant relationship between salinity andFv/Fm was also observed near the
Sakhalin Island (Fig. 7b; ρ=0.56, p <0.001). Similarly, relationships between D-Fe
5
andFv/Fm(Fig. 8b;ρ=0.62,p <0.001) and betweenFv/Fmand the Fd index (Fig. 12;
Pearson correlation coefficient r=0.62, p <0.01) were also statistically significant, whereas no relationship was found between nitrate plus nitrite and Fv/Fm(ρ=0.30,
p >0.05).
4 Discussion
10
In this study, nutrient limitation is defined as a reduction in the growth rate of phyto-plankton due to the low concentration of a nutrient (Liebig’s law of the minimum), which might be reflected inFv/Fm(Boyd et al., 2005). On the other hand, nutrient stress is
de-fined as a physiological adjustment of phytoplankton to lower nutrient availability, which may precede, or occur with or without a reduction in growth rate, and which may be
15
reflected in the Fd index.
4.1 Effect of riverine Fe input on the physiology of micro-sized diatoms offthe Sakhalin Island
We found that there was a distinct gradient of Fe nutritional status in the micro-sized diatoms extending from near the mouth of the Amur River to open waters in the Sea
20
of Okhotsk as estimated from the Fd index (Fig. 6a) along with D-Fe data (Fig. 6b). Values of the Fd index significantly correlated with levels of D-Fe (Fig. 8a), indicating that, in general, the Fd index could be simply used as a diagnostic Fe stress marker for the micro-sized diatoms in this area. At Stns G8 and G10 near the Amur River, values of the Fd index were>0.9, consistent with growth of the micro-sized diatoms under
BGD
11, 373–415, 2014Iron nutritional status of large diatoms in the Sea of Okhotsk
K. Suzuki et al.
Title Page
Abstract Introduction
Conclusions References
Tables Figures
◭ ◮
◭ ◮
Back Close
Full Screen / Esc
Printer-friendly Version Interactive Discussion
Discussion
P
a
per
|
D
iscussion
P
a
per
|
Discussion
P
a
per
|
Discuss
ion
P
a
per
|
replete conditions. Nishioka et al. (2013) noted that influence of the Amur River reached to Stns C1–C9 (also see Table 1,<32 in salinity) during the survey. The values of the Fd index at these stations became lower (0.22–0.62), indicating that the Fe nutritional status of the micro-sized diatoms declined. According to Yoshimura et al. (2010) who conducted Fe-enriched bottle incubation experiments in the Sea of Okhotsk during the
5
study, addition of 10 nM inorganic Fe did not stimulate the growth of the large-sized phytoplankton (>10 µm) near Stns G9, E2, C3 and C9 (which correspond to Stns 1, 2, 3 and 4 in Yoshimura et al. (2010), respectively). Although the Fd index data were unavailable from Stns G9 and E2, the Fd index measured at nearby locations (i.e., Stn G10 and E1, respectively) was high (>0.9). However, the Fd index values at Stns
10
C3 and C9 were lower (0.58 and 0.42, respectively). Since the sampling time differed between Yoshimura et al. (2010) and this study, that resulted in slightly different hy-drographic conditions. Therefore, direct comparisons of the results between the two studies could be difficult. However, the lower Fd index values observed at Stns C3 and C9 might reflect an early response prior to Fe limitation in the micro-sized diatoms.
15
McKay et al. (1997) and Davey and Geider (2001) demonstrated that Fld accumulation in diatoms occurred in an early stage of Fe-deficient conditions when the growth rates of the diatoms were almost the same as those in Fe-replete conditions. At nearshore Stns C1 and E3 where both D-Fe andFv/Fmwere high (>7 nM and>0.6, respectively)
and micro-sized diatoms were abundant (>4 µg C L−1), the values of the Fd index were
20
also slightly low (0.62 and 0.57, respectively). At these stations, the compositions of the micro-sized diatom species observed were similar to each other (Fig. 4). In par-ticular, Chaetoceros radicans and Dithylum brightwellii were predominant at Stns C1 and E3, respectively. These same diatom taxa were observed at other stations where a high Fd index was reported, suggesting that the lower index value cannot be
read-25
ily attributed to methodological considerations such as constitutive expression of Fld under Fe-replete conditions (McKay et al., 2000; Pankowski and McMinn, 2009a, b).
Although the Fd index was highly correlated with D-Fe, the relationship between the salinity and the Fd index was insignificant (Fig. 7a). This was probably related
BGD
11, 373–415, 2014Iron nutritional status of large diatoms in the Sea of Okhotsk
K. Suzuki et al.
Title Page
Abstract Introduction
Conclusions References
Tables Figures
◭ ◮
◭ ◮
Back Close
Full Screen / Esc
Printer-friendly Version Interactive Discussion
Discussion
P
a
per
|
D
iscussion
P
a
per
|
Discussion
P
a
per
|
Discuss
ion
P
a
per
|
to the fact that the correlation coefficient between salinity and D-Fe was rather low (ρ=−0.51,p <0.01; Fig. 2a), representing the presence of an Fe sink (i.e., utilization by microorganisms such as phytoplankton and scavenging; Boyd and Ellwood, 2010) along with Fe sources other than the Amur River discharge. Okunishi et al. (2007) and Misumi et al. (2011) pointed out that atmospheric Fe deposition and Fe flux from
sed-5
iment play important roles in maintaining bioavailable Fe in surface waters of the Sea of Okhotsk. On the other hand, a correlation between the Fv/Fm values and salinity was observed (Fig. 7b). It is well known thatFv/Fm values can vary with the
availabil-ity of nitrogen, phosphorous or Fe (Shelly et al., 2011). Lippemeier et al. (1999) also noted that changes inFv/Fmcould be observed in response to silica limitation and its
10
re-supply to diatoms. Parkhill et al. (2001) proposed thatFv/Fmshould be used as a
di-agnostic indicator for nutrient-starved unbalanced growth conditions, because Fv/Fm
was not a good measure of nutrient limitation in a neritic diatom under balanced growth conditions and showed a constant high value (ca. 0.65) independent of nutrient-limited growth rate under different irradiance levels. Diurnal variations ofFv/Fmhave also been
15
reported previously (e.g., Suzuki et al., 2002; Behrenfeld and Milligan, 2013). Note that theFv/Fmvalues obtained in this study were mainly derived not only from the diatoms,
but also from the dinoflagellates (Fig. 10). Nonetheless, in this study, theFv/Fmvalues
significantly correlated with D-Fe concentrations (Fig. 8b;ρ=0.62,p <0.001), but not with levels of nitrate plus nitrite (ρ=0.30,p >0.05), suggesting that D-Fe was a major
20
determining factor for Fv/Fm values. A distinct gradient inFv/Fm values was also
ob-served from near the Amur River mouth to the neritic region at Stns C1 and C3, where diatoms were predominant in the micro-sized phytoplankton (>80 %; Fig. 10). These results were consistent with the Fd index data. There was also a significant correlation between the Fv/Fm values and the Fd index was also found (Fig. 11), indicating that
25
the photosynthetic physiological conditions between the diatoms and other micro-sized phytoplankton (i.e., mainly dinoflagellates) were comparable.
If we fit the relationships between D-Fe and the Fd index orFv/Fmwith the Michaelis–
BGD
11, 373–415, 2014Iron nutritional status of large diatoms in the Sea of Okhotsk
K. Suzuki et al.
Title Page
Abstract Introduction
Conclusions References
Tables Figures
◭ ◮
◭ ◮
Back Close
Full Screen / Esc
Printer-friendly Version Interactive Discussion
Discussion
P
a
per
|
D
iscussion
P
a
per
|
Discussion
P
a
per
|
Discuss
ion
P
a
per
|
as 0.82±0.06 and 0.65±0.02 (mean ±standard error), respectively (fitting curves in
Fig. 8). The lower maximum Fd index value, compared to the theoretical maximum (=1), was mainly caused by the data from Stns C1 and E3 mentioned above. The maximum value (0.65±0.02) ofFv/Fm was within the theoretical value between 0.6–
0.8 for eukaryotic algae as estimated with multiple turnover PAM fluorometry (Büchel
5
and Wilhelm, 1993). The half saturation constants between D-Fe and the Fd index or
Fv/Fm were calculated as 0.56±0.20 nM and 0.080±0.028 nM (mean±standard
er-ror), respectively. Unfortunately, no such field data for direct comparison were available from previous studies. The higher half saturation constant between D-Fe and the Fd index than that between D-Fe and Fv/Fm seems to be reasonable, because Fld
ac-10
cumulation could precede the declines in Fv/Fm or growth rate (McKay et al., 1997;
Davey and Geider, 2001). According to Timmermans et al. (2004), the half-saturation constants between D-Fe and net growth rate in four large diatoms from the Southern Ocean were between 0.19–1.14 nM, and close to the ambient D-Fe concentrations of 0.2 nM. In this study, the half saturation constant (0.080±0.028 nM) between D-Fe and
15
Fv/Fm might be slightly lower than expected from the ambient D-Fe levels (>0.2 nM
in general; Table 1). It is known that dinoflagellates can migrate vertically to assimilate nutrients in subsurface waters (Eppley et al., 1968). Their vertical migration capability could account for the highFv/Fmvalues even under low Fe conditions at the surface. As
mentioned above, the nutrient-balanced growth conditions (Parkhill et al., 2001) might
20
also contribute to this issue. During events of high input of D-Fe, which can sometimes be expected in coastal waters, diatoms are capable of luxury accumulation of Fe within their cells, to be used later under Fe-deficient conditions (Sunda and Huntsman, 1995; Iwade et al., 2006). Therefore, for diatoms, luxury Fe uptake and intracellular Fe stor-age could play an important role in maintaining the high Fv/Fm values under low Fe
25
conditions.
BGD
11, 373–415, 2014Iron nutritional status of large diatoms in the Sea of Okhotsk
K. Suzuki et al.
Title Page
Abstract Introduction
Conclusions References
Tables Figures
◭ ◮
◭ ◮
Back Close
Full Screen / Esc
Printer-friendly Version Interactive Discussion
Discussion
P
a
per
|
D
iscussion
P
a
per
|
Discussion
P
a
per
|
Discuss
ion
P
a
per
|
4.2 Fe deficiency in micro-sized diatoms offthe Kuril Islands
Only Fld was detected in the vicinity of the Kuril Islands (Fig. 5), resulting in a Fd index of zero (Fig. 6a), despite ambient D-Fe levels>0.4 nM (Table 1). The results suggest that the micro-sized diatoms, which mainly consisted of Chaetoceros concavicornis
(Table 2), were growing under Fe-deficient conditions. Otherwise, the constitutive
pro-5
duction of Fld in the diatoms could occur even under Fe-replete conditions (McKay et al., 2000; Pankowski and McMinn, 2009a, b), whereas that has never been reported from Chaetoceros spp. The former is supported by the results of Fe-enriched bot-tle incubation experiments conducted in the Bussol’ Strait by Yoshimura et al. (2010) and Sugie et al. (2013). According to Yoshimura et al. (2010), net specific growth rate
10
of large-sized (>10 µm) phytoplankton, which mainly consisted of the genus Chaeto-ceros, was significantly enhanced by a 10 nM inorganic Fe addition, as compared with the unamended control. More recently, Sugie et al. (2013) also confirmed that additions of inorganic Fe (final concentration of 5 nM) or particulate Fe, which was collected from the nepheloid layer in the coastal region of the Sea of Okhotsk, stimulated the growth
15
of diatoms in the Bussol’ Strait during summer 2007, although the cell size of the di-atoms was not indicated. As a plausible mechanism promoting Fe deficient conditions in the micro-sized diatoms near the Bussol’ Strait, Fe and light co-limitations (Sunda and Huntsman, 1997) were considered. The strong vertical mixing in the Bussol’ Strait (Yagi and Yasuda, 2012) could facilitate transport of the diatoms from the surface to
20
deeper layer and vice versa. Indeed, vertical profiles of Chl a biomass in the Bus-sol’ Strait were entirely uniform from the surface to 200 m (data not shown) as were those of temperature and salinity (see Yoshimura et al., 2010). Additionally, daily sur-face PAR was relatively low (21±6 mol photons m−2d−1) in this region due to heavy cloud covers, compared to that measured at other stations during the cruise (Isada
25
BGD
11, 373–415, 2014Iron nutritional status of large diatoms in the Sea of Okhotsk
K. Suzuki et al.
Title Page
Abstract Introduction
Conclusions References
Tables Figures
◭ ◮
◭ ◮
Back Close
Full Screen / Esc
Printer-friendly Version Interactive Discussion
Discussion
P
a
per
|
D
iscussion
P
a
per
|
Discussion
P
a
per
|
Discuss
ion
P
a
per
|
light conditions, because more Fe is required for the synthesis of the photosynthetic apparatus including pigments to capture more light energy. Therefore, the micro-sized diatoms offthe Kuril Islands possibly encountered Fe and light co-limitations. Harrison et al. (1993) demonstrated that the maximum growth rate of Ch. concavicornis was observed under nutrient-replete conditions between 4–8◦C even at the low irradiance
5
of 10 µmol photons m−2s−1, suggesting that the species possessed cold and low-light tolerances. In the vicinity of the Kuril Islands,Ch. concavicorniscould adapt well to the high turbulence, Fe-deficient conditions by changing key metabolic processes such as the conversion from Fd to Fld.
Interestingly, the values of the Fd index at Stns A1 and A4, which were slightly apart
10
from the Bussol’ Strait, showed the same results as those at other stations near the strait (i.e., Fd index=0). These data suggest efficient water transport from the Sea of Okhotsk to the North Pacific via the Kuril Straits (Ohshima et al., 2002; Kida and Qiu, 2013). Indeed, the compositions of the micro-sized diatom species detected between Stns A1 and A4 were similar to each other (Fig. 4). Jing et al. (2009) also demonstrated
15
similar phylotype compositions of picoplankton-sized cyanobacteria Synechococcus
spp. between Stns A1 and A6, which was located between Stn A4 and B1 during the cruise.
5 Conclusions
The coastal area is a key environment in the global Fe cycle, where the brackish water
20
environment changes the physico-chemical speciation (i.e., mobility) of riverine Fe via aggregation, sedimentation and redox processes (Boyd and Ellwood, 2010; Breitbarth, 2010). Therefore, the coastal waters become a highly dynamic transition zone, resulting in diverse spatiotemporal chemical and biological changes. In this study, we revealed that there was a distinct gradient in the Fe nutritional status of the micro-sized diatoms
25
from near the mouth of the Amur River to the oceanic region of the Sea of Okhotsk using the Fd index. In addition, uniformly low Fd index values suggested widespread
BGD
11, 373–415, 2014Iron nutritional status of large diatoms in the Sea of Okhotsk
K. Suzuki et al.
Title Page
Abstract Introduction
Conclusions References
Tables Figures
◭ ◮
◭ ◮
Back Close
Full Screen / Esc
Printer-friendly Version Interactive Discussion
Discussion
P
a
per
|
D
iscussion
P
a
per
|
Discussion
P
a
per
|
Discuss
ion
P
a
per
|
Fe deficiency of the micro-sized diatoms near the Kuril Straits. The differential expres-sions of Fd and Fld in the micro-sized diatoms helped us to understand how these microorganisms responded to Fe availability in the Sea of Okhotsk without reliance on incubation approaches which are often accompanied by bottle effects (Carpenter and Lively, 1980) and trace metal contamination (Fitzwater et al., 1982). Recently, Whitney
5
et al. (2011) succeeded in examining the expression of selected genes such as Fd and Fld genes in two diatomThalassiosirastrains with real-time quantitative reverse tran-scription PCR (qRT-PCR). Although the micro-sized diatoms play important roles in the marine ecosystems and biogeochemical processes, such molecular-based physiologi-cal knowledge has still been very scarce, especially applied to the field. We expect that
10
recent rapid advances in metagenomics, metatranscriptomics and metaproteomics us-ing next-generation sequencus-ing technologies and high-precision mass spectrometry with advanced bioinformatics (Rusch et al., 2010; Marchetti et al., 2012; Desai et al., 2012; DeLong, 2013) will lead to further understanding of how phytoplankton including the micro-sized diatom species have adapted to a wide variety of in situ Fe conditions,
15
and the implications of their adaptations to algal productivity and biodiversity.
Acknowledgements. We wish to thank the captain, officers, crew and scientists of the R/V
Professor Khromov for their helpful assistance during the cruise. In particular, the chief sci-entist Takeshi Nakatsuka must be acknowledged. We also thank Kyoko Kawanobe for light microscopy. This study was supported by the project “Human Activities in Northeastern Asia
20
and Their Impact on the Biological Productivity in the North Pacific Ocean” of the Research In-stitute of Humanity and Nature (RIHN), JSPS Grant-in-Aid for Scientific Research (#19510001, #22221001, #22310002, and #24121004) and the CREST project of the Japan Science and Technology Agency.
References
25
BGD
11, 373–415, 2014Iron nutritional status of large diatoms in the Sea of Okhotsk
K. Suzuki et al.
Title Page
Abstract Introduction
Conclusions References
Tables Figures
◭ ◮
◭ ◮
Back Close
Full Screen / Esc
Printer-friendly Version Interactive Discussion
Discussion
P
a
per
|
D
iscussion
P
a
per
|
Discussion
P
a
per
|
Discuss
ion
P
a
per
|
insight into iron-replete and iron-depleted regimes, Prog. Oceanogr., 73, 99–126, doi:10.1016/j.pocean.2006.12.002, 2007.
Andreev, A. G. and Pavlova, G. Y.: Okhotsk Sea, in: Carbon and Nutrient Fluxes in Continen-tal Margins: a Global Synthesis, Global Change – The IGBP Series, edited by: Liu, K.-K., Atkinson, L., Quiñones, R., and Talaue-McManus, L., Springer, Berlin, 394–405, 2009.
5
Behrenfeld, M. J. and Milligan, A.: Photophysiological expressions of iron stress in phytoplank-ton, Annu. Rev. Mar. Sci., 5, 217–246, doi:10.1146/annurev-marine-121211-172356, 2013. Boyd, P. W. and Ellwood, M. J.: The biogeochemical cycle of iron in the ocean, Nature Geosci.,
3, 675–682, doi:10.138/ngeo964, 2010.
Boyd, P. W., Strzepek, R., Takeda, S., Jackson, G., Wong, C. S., McKay, R. M., Law, C.,
Kiyo-10
sawa, H., Saito, H., Sherry, N., Johnson, K., Gower, J., and Ramiah, N., The evolution and termination of an iron-induced mesoscale bottom in the northeast subarctic Pacific, Limnol. Oceanogr., 50, 1872–1886, 2005.
Boyd, P. W., Jikells, T., Law, C. S., Blain, S., Boyle, E. A., Buesseler, K. O., Coale, K. H., Cullen, J. J., de Baar, H. J. W., Follows, M., Harvey, M., Lancelot, C., Lavasseur, M.,
15
Owens, N. P. J., Pollard, R., Rivkin, R. B., Sarmiento, J., Schoemann, V., Smetacek, V., Takeda, S., Tsuda, A., Turner, S., and Watson, A. J.: Mesoscale iron enrichment experiments 1993–2005: Synthesis and future directions, Science, 315, 612–617, 2007.
Boyle, E. A., Edmond, J. M., and Sholkovitz, E. R.: The mechanism of iron removal in estuaries, Geochim. Cosmochim. Ac., 41, 1313–1324, 1977.
20
Bray, J. R. and Curtis, J. T.: An ordination of the upland forest communities of southern Wis-consin, Ecol. Monogr. 27, 325–349, 1957.
Breitbarth, E., Achterberg, E. P., Ardelan, M. V., Baker, A. R., Bucciarelli, E., Chever, F., Croot, P. L., Duggen, S., Gledhill, M., Hassellöv, M., Hassler, C., Hoffmann, L. J., Hunter, K. A., Hutchins, D. A., Ingri, J., Jickells, T., Lohan, M. C., Nielsdóttir, M. C.,
25
Sarthou, G., Schoemann, V., Trapp, J. M., Turner, D. R., and Ye, Y.: Iron biogeochemistry across marine systems – progress from the past decade, Biogeosciences, 7, 1075–1097, doi:10.5194/bg-7-1075-2010, 2010.
Bruland, K. W., Rue, E. L., and Smith, G. J.: Iron and macronutrients in California coastal upwelling regimes: implications for diatom blooms, 46, 1661–1674, 2001.
30
Büchel, C. and Wilhelm, C.: In vivo analysis of slow chlorophyll fluorescence induction kinetics in algae: progress, problems and perspectives, Phytochem. Phytobiol., 58, 137–148, 1993.
BGD
11, 373–415, 2014Iron nutritional status of large diatoms in the Sea of Okhotsk
K. Suzuki et al.
Title Page
Abstract Introduction
Conclusions References
Tables Figures
◭ ◮
◭ ◮
Back Close
Full Screen / Esc
Printer-friendly Version Interactive Discussion
Discussion
P
a
per
|
D
iscussion
P
a
per
|
Discussion
P
a
per
|
Discuss
ion
P
a
per
|
Buck, K. N., Lohan, M. C., Berger, C. J. M., and Bruland, K. W.: Dissolved iron speciation in two distinct river plumes and an estuary: Implications for riverine iron supply, Limnol. Oceanogr., 52, 843–855, 2007.
Carpenter, E. J. and Lively, J. S.: Review of estimates of algal growth using14C tracer technique, in: Primary Productivity in the Sea, edited by: Falkowski, P. G., Plenum Press, New York,
5
161–178, 1980.
Chase, Z., Strutton, P. G., and Hales, B.: Iron links river runoff and shelf width to phytoplankton biomass along the US West Coast, Geophys. Res. Lett., 34, L04607, doi:10.1029/2006GL028069, 2007.
Colwell, R. K.: Estimate S: statistical estimation of species richness and shared species from
10
samples, Version 9 and earlier, in: User’s Guide and Application, available at: http://viceroy. eeb.uconn.edu/estimates/index.html, 2013.
de Baar, H. J. W., Boyd, P. W., Coale, K. H., Landry, M. R., Tsuda, A., Assmy, P., Bakker, D. C. E., Boze, Y., Barber, R. T., Brzezinski, M. A., Buesseler, K. O., Boyé, M., Croot, P., Gervais, F., Gorbunov, M. Y., Harrison, P. J., Hiscock, W. T., Laan, P., Lancelot, C., Law, C. S.,
Lev-15
asseur, M., Marchetti, A., Millero, F. J., Nishioka, J., Nojiri, Y., van Oijen, T., Riebsell, U., Ri-jkensberg, M. J. A., Saito, H., Takeda, S., Timmermans, R., Veldhuis, M. J. W., Maite, A. M., and Wong, C. S.: Synthesis of iron fertilization experiments: from the iron age in the age of enlightenment. J. Geophys. Res., 110, C09S16, doi:10.1029/2004JC002601, 2005.
DeLong, E. F.: Microbial Metagenomics, Metatranscriptomics, and Metaproteomics, Methods
20
in Enzymology, Academic Press, Amsterdam, 531 pp., 2013.
Desai, D. K., Desai, F., and LaRoche, J.: Factors influencing the diversity of iron uptake systems in aquatic microorganisms, Front. Microbiol., 3, 1–20, 362, doi:10.3389/fmicb.2012.00362, 2012.
Devey, M. and Geider, R. J.: Impact of iron limitation on the photosynthetic apparatus of the
25
diatomChaetoceros muelleri(Bacillariophyceae), J. Phycol., 37, 987–1000, 2001.
Doucette, G. J., Erdner, D. L., Peleato, M. L., Hartman, J. J., and Anderson, D. M.: Quanti-tative analysis of iron-stress related proteins in Thalassiosira weissflogii: measurement of flavodoxin and ferredoxin using HPLC, Mar. Ecol.-Prog. Ser., 130, 269–276, 1996.
Eppley, R. W., Holm-Hansen, O., Strickland, J. D. H.: Some observations on vertical migration
30
of dinoflagellates, J. Phycol., 4, 333–340, 1968.
BGD
11, 373–415, 2014Iron nutritional status of large diatoms in the Sea of Okhotsk
K. Suzuki et al.
Title Page
Abstract Introduction
Conclusions References
Tables Figures
◭ ◮
◭ ◮
Back Close
Full Screen / Esc
Printer-friendly Version Interactive Discussion
Discussion
P
a
per
|
D
iscussion
P
a
per
|
Discussion
P
a
per
|
Discuss
ion
P
a
per
|
Fitzwater, S. E., Knauer, G. A., Martin, J. H.: Metal contamination and its effect on primary production measurements, Limnol. Oceanogr., 27, 544–551, 1982.
Gerringa, L. J. A., Alderkamp, A.-C., Laan, P., Thuróczy, C.-E., De Baar, H. J. W., Mills, M. M., van Dijken, G. L., van Haren, H., and Arrigo, K. R.: Iron from melting glaciers fuels the phytoplankton blooms in Amundsen Sea (Southern Ocean): iron biogeochemistry, Deep-Sea
5
Res. Pt. II, 71–76, 16–31, doi:10.1016/j.dsr2.2012.03.007, 2012.
Harrison, P. J., Thompson, P. A., Guo, M., and Taylor, J. R.: Effect of light, temperature and salinity on the growth rate of harmful marine diatoms,Chaetoceros convolutsandC. concav-icornisthat kill netpen salmon, J. Appl. Phycol., 5, 259–265, 1993.
Hattori-Saito, A., Nishioka, J., Ono, T., McKay, R. M. L., and Suzuki, K.: Iron deficiency in
10
micro-sized diatoms in the Oyashio region of the western subarctic Pacific during spring, J. Oceanogr., 66, 105–115, 2010.
Hillebrand, H., Dürselen, C.-D., Kirschtel, D., Pollingher, U., Zohry, T.: Biovolume calculation for pelagic and benthic microalgae, J. Phycol., 35, 403–424, 1999.
Horner, R. A.: A Taxonomic Guide to Some Common Marine Phytoplankton, Biopress Ltd.,
15
Bristol, UK, 2002.
Hutchins, D. A., Hare, C. E., Weaver, R. S., Zhang, Y., Firme, F., DiTullio, G. R., Alm, M. B., Rise-man, S. F., Maucher, J. M., Geesey, M. E., Trick, C. G., Smith, G. J., Rue, E. L., Conn, J., and Bruland, K. W.: Phytoplankton iron limitation in the Humboldt Current and Peru Upwelling, Limnol. Oceanogr., 47, 997–1011, 2002.
20
Isada, T., Iida, T., Liu, H., Saitoh, S.-I., Nishioka, J., Nakatsuka, T., and Suzuki, K.: Influence of Amur River discharge on phytoplankton photophysiology in the Sea of Okhotsk during late summer, J. Geophys. Res., 118, 1995–2013, doi:10.1002/jgrc.20159, 2013.
Iwade, S., Kuma, K., Isoda, Y., Yoshida, M., Kudo, I., Nishioka, J., and Suzuki, K.: Effect of high iron concentration on iron uptake and growth of a coastal diatomChaetoceros sociale,
25
Aquat. Microb. Ecol., 43, 177–191, doi:10.3354/ame043177, 2006.
Jeffrey, S. W., Siellicki, M., and Haxo, F. T.: Chloroplast pigment patterns in dinoflagellates, J. Phycol., 11, 374–384, 1975.
Jing, H., Liu, H., and Suzuki, K.: Phylogenetic diversity of marineSynechococcusspp. in the Sea of Okhotsk, Aquat. Microb. Ecol., 56, 55–63, doi:10.3354/ame01316, 2009.
30
Johnson, K. S., Gordon, R. M., and Coale, K. H.: What controls dissolved iron concentrations in the world ocean?, Mar. Chem., 57, 137–161, 1997.
BGD
11, 373–415, 2014Iron nutritional status of large diatoms in the Sea of Okhotsk
K. Suzuki et al.
Title Page
Abstract Introduction
Conclusions References
Tables Figures
◭ ◮
◭ ◮
Back Close
Full Screen / Esc
Printer-friendly Version Interactive Discussion
Discussion
P
a
per
|
D
iscussion
P
a
per
|
Discussion
P
a
per
|
Discuss
ion
P
a
per
|
Kida, S. and Qiu, B.: An exchange flow between the Okhotsk Sea and the North Pacific driven by the East Kamchatka Current, J. Geophys. Res., doi:10.1002/2013JC009464, in press, 2013.
Kimura, N. and Wakatsuchi, M.: Relationship between sea-ice motion and geostrophic wind in the Northern Hemisphere, Geophs. Res. Lett., 27, 3735–3738, 2000.
5
LaRoche, J., Murray, H., Orellana, M., and Newton, J.: Flavodoxin expression as an indicator of iron limitation in marine diatoms, J. Phycol., 31, 520–530, 1995.
LaRoche, J., Boyd, P. W., McKay, R. M. L., and Geider, R. J.: Flavodoxin as an in situ marker for iron stress in phytoplankton, Nature, 382, 802–805, 1996.
LaRoche, J., McKay, R. M. L., and Boyd, P.: Immunological and molecular probes to detect
10
phytoplankton responses to environmental stress in nature, Hydrobiologia, 401, 177–198, 1999.
Laemmli, U. K.: Cleavage of structural proteins during the assembly of the head of bacterio-phase T4, Nature, 227, 680–685, 1970.
Li, X., Yakunin, A. F., and McKay, R. M. L.: The Fe responsive accumulation of redox
pro-15
teins ferredoxin and flavodoxin from a marine cryptomonad, Eur. J. Phycol., 39, 73–82, doi:10.1080/09670260310001637306, 2004.
Lippermier, S., Hartig, P., and Colijin, F.: Direct impact of silicate on the photosynthetic perfor-mance of the diatomThalassiosira weissflogiiassessed by on- and off-line PAM fluorescence measurements, J. Plankton Res., 21, 269–283, 1999.
20
Marchetti, A., Schruth, D. M., Durkin, C. A., Parker, M. S., Kodner, R. B., Berthiaume, C. T., Morales, R., Allen, A. E., and Armbrust, E. V.: Comparative metatranscriptomics identifies molecular bases for the physiological responses of phytoplankton to varying iron availability, Proc. Nat. Acad. Sci. USA, 109, E317–E325, doi:10.1073/pnas.1118408109, 2012.
Martin, S., Drucker, R., and Yamashita, K.: The production of ice and dense shelf water in the
25
Okhotsk Sea polynyas, J. Geophys. Res., 103, C12, 27771–27782, 1998.
McKay, R. M. L., Geider, R. J., and LaRoche, J.: Physiological and biochemical response of the photosynthetic apparatus of two marine diatoms to Fe stress, Plant Physiol., 114, 615–622, 1997.
McKay, R. M. L., LaRoche, J., Yakunin, A. F., Durnfor, D. G., and Geider, R. J.: Accumulation
30
BGD
11, 373–415, 2014Iron nutritional status of large diatoms in the Sea of Okhotsk
K. Suzuki et al.
Title Page
Abstract Introduction
Conclusions References
Tables Figures
◭ ◮
◭ ◮
Back Close
Full Screen / Esc
Printer-friendly Version Interactive Discussion
Discussion
P
a
per
|
D
iscussion
P
a
per
|
Discussion
P
a
per
|
Discuss
ion
P
a
per
|
McKay, R. M. L., Villareal, T. A., and LaRoche, J.: Vertical migration byRhizosoleniaspp. ( Bacil-lariophyceae): implications for Fe acquisition, J. Phycol., 36, 669–674, 2000.
Medina, M. and Gómez-Moreno, C.: Interaction of ferredoxin-NADP+ reducatase with its sub-strates: optimal interaction for efficient electron transfer, Photosynth. Res., 79, 113–131, 2004.
5
Menden-Deuer, S. and Lessard, E. J.: Carbon to volume relationships for dinoflagellates, di-atoms, and other protist plankton, Limnol. Oceanogr., 45, 569–579, 2000.
Misumi, K., Tsumune, D., Yoshida, Y., Uchimoto, K., Nakamura, T., Nishioka, J., Mitsud-era, H., Bryan, F. O., Lindsay, K., Moore, J. K., and Doney, S. C.: Mechanisms con-trolling dissolved iron distribution in the North Pacific: a model study, 116, G03005,
10
doi:10.1029/2010JG001541, 2011.
Nagao, S., Terashima, M., Seki, O., Takata, H., Kawahigashi, M., Kodama, H., Kim, V. I., Shesterkin, V. P., Levshina, S. I., and Makinov, A. N.: Biogeochemical behavior of iron in the lower Amu River and Amur-Liman, in: Report on Amur-Okhotsk Project No. 6, Research Institute for Humanity and Nature, Japan, 41–50, 2010.
15
Nakatsuka, T., Fujimune, T., Yoshikawa, C., Noriki, S., Kawamura, K., Fukamachi, Y., Mizuta, G., and Wakatsuchi, M.: Biogenic and lithogenic particle fluxes in the western region of the Sea of Okhotsk: Implications for lateral material transport and biological productivity, J. Geophys. Res., 109, C09S13, doi:10.1029/2003JC001908, 2004.
Nishioka, J., Ono, T., Saito, H., Nakatsuka, T., Takeda, S., Yoshimura, T., Suzuki, K., Kuma, K.,
20
Nakabayashi, S., Tsumune, D., Mitsudera, H., Johnson, W. K., and Tsuda, A.: Iron supply to the western subarctic Pacific: importance of iron export from the Sea of Okhotsk, J. Geophys. Res., 112, C10012, doi:10.1029/2006JC004055, 2007.
Nishioka, J., Ono, T., Saito, H., Sakaoka, K., and Yoshimura, T.: Oceanic iron supply mech-anisms which support the spring diatom bloom in the Oyashio region, western subarctic
25
Pacific, J. Geophys. Res., 116, C02021, doi:10.1029/2010JC006321, 2011.
Nishioka, J., Nakatsuka, T., Watanabe, Y. W., Yasuda, I., Kuma, K., Ogawa, H., Ebuchi, N., Scherbinin, A., Volkov, Y. N., Shiraiwa, T., and Wakatsuchi, M.: Intensive mixing along an island chain controls oceanic biogeochemical cycles, Global Biogeochem. Cy., 27, 920–929, doi:10.1002/gbc.20088, 2013.
30
Nishioka, J., Nakatsuka, T., Ono, K., Volkov, Y. N., Scherbinin, A., and Shiraiwa, T.: Quantitative evaluation of iron transport processes in the Sea of Okhotsk, Prog. Oceanogr., submitted, 2013.