Spirometry reference values in the Brazilian population
R. Ru
fi
no
1, C.H. Costa
1, A.J. Lopes
1, A.I. Maiworm
1, K. Maynard
1, L.M.R.A. Silva
2and R.M. Dias
3 1Departamento de Doenc¸as do Tórax, Faculdade de Ciências Médicas, Universidade do Estado do Rio de Janeiro,
Rio de Janeiro, RJ, Brasil
2Faculdade de Economia, Universidade Federal do Rio de Janeiro, Rio de Janeiro, RJ, Brasil 3Departamento Cardiopulmonar, Escola de Medicina e Cirurgia, Universidade Federal do Estado do Rio de Janeiro,
Rio de Janeiro, RJ, Brasil
Abstract
The aim of the present study was to provide new spirometry reference equations in a sample of the Brazilian population for the following parameters: forced vital capacity (FVC), forced expiratory volume in 1 second (FEV1), FEV1/FVC ratio, peak of
expiratoryflow (PEF), forced expiratoryflow at 50% (FEF50%),75% average vital capacity (FEF25–75%), and average forced
expiratory flow time (FEFT). This was a prospective study using results from chest radiographs, electrocardiograms, and questionnaires to investigate the participants’ respiratory symptoms, sedentarism, and comorbidities (Charlson comorbidity index). From December 2010 to July 2014, individuals were randomly selected from various locations in the state of Rio de Janeiro. All individuals were examined by a single technician in the morning at the laboratory, and performed the spirometry with the same spirometer. Spirometry values were tabulated for the creation of three equation models: linear regression, logarithmic regression, and logarithms through a method that incorporates the lambda, median, and coefficient of variation (LMS method). Initially, 7003 individuals from both genders were contacted, and 454 were recruited. The data from the new equations were compared with one Brazilian and eight international equations, resulting in a high correlation (r40.9). The values derived from the LMS method and linear regression were very similar (P40.5), and both could be used to acquire the reference values for Brazilian spirometry. Data derived from the equations of this study were different from the current Brazilian equation, which could be justified by the different method used.
Key words: Spirometry; Lung function test; Reference values; FVC; FEV1
Introduction
Spirometric measurements can be interpreted by com-paring numbers derived from a certain population. Spirom-etry reference values (or standard numbers) are derived from healthy individuals (1). The reference population should represent the general population (2,3).
According to the Brazilian Institute of Geography and Statistics (IBGE - Instituto Brasileiro de Geografia e Estatística) (4), Brazil has had many spontaneous migratory
flows since 1884, which continue into the present day. Germans, Spaniards, Italians, Japanese, Portuguese, Syrians, Turks, Africans, along with the native indigenous popula-tion constitute the Brazilian gene pool (4). Thus, Brazilian spirometric reference values could and should present characteristics similar to other populations around the world.
The aim of this study is to present an equation for the Brazilian population using an alternate method in order to validate the present reference values for spirometry (5), yield new numbers, or support data from international literature.
Material and Methods
We conducted a cross-sectional study and evaluated healthy individuals (20 to 80 years old) with sedentary lifestyles from December 2010 to July 2014. The study was approved by the Research Ethics Committee of the Universidade do Estado do Rio de Janeiro (UERJ, 2782/2010-CAAE 0226.0.228.00-10). Volunteers were randomly selected from various regions of the state of Rio de Janeiro, in Southeastern Brazil. The locations chosen for pre-selection included the Sports Authority of Rio de Janeiro, Senior Citizens University, Herbert Viana Hemotherapy Unit, Greater Rio Samba Schools (Salgueiro, Vila Isabel, and Mangueira). Volunteers were undergraduate and graduate students from UERJ and Veiga de Almeida University, visitors of patients from Hospital Universitário Pedro Ernesto, and citizens from various neighborhoods in Rio de Janeiro. Ethnicity was self-defined.
Correspondence: R. Rufino:<rrufi[email protected]>
Considering a Brazilian population of 190,000,000 at the time this research started in December of 2010 (IBGE) (4), the sample size was calculated to yield a 95% confidence level with a 5% margin of error. Despite the population growth to 204,761,379 (IBGE 2015) from 2011 to 2015, the calculated number of individuals remained the same. Therefore, in order to obtain a representative sample of the Brazilian population, 377 individuals were necessary. The percentage of individuals for each age group was cal-culated based on IBGE (4) data.
The inclusion criteria were sedentary individuals between 20 and 80 years of age, and absence of a smoking history, and pulmonary, cardiac, and neurological diseases. A sed-entary lifestyle was defined as no or irregular physical activity less than 150 min a week according to the World Health Organization (6).
The exclusion criteria were smokers and ex-smokers, illegal drug users, and individuals with any of the following: active lifestyles; spirometry results not meeting the criteria for acceptability and reproducibility (2); radiographic evi-dence of pleuropulmonary lesions [including pulmonary masses, hyperinflation pattern (flattened hemidiaphragm) or interstitial disease]; specific abnormalfindings on electro-cardiograms such as ischemic region, myocardial infarc-tion, tachyarrhythmia, or complete ventricular blockages; respiratory infections of the upper and/or lower airways in the 6 weeks before the spirometry; a Charlson index above 1 (7); cognitive deficit preventing comprehension of the questionnaire and implementation of the pulmonary function test (8); debilitating and chronic diseases, such as cardiopathies, pneumopathies, and neuropathies; unstable angina or arterial hypertension (systolic arterial pressure
4200 mmHg or diastolic arterial pressure4110 mmHg) (2); a recent history of cardiac arrhythmia or myocardial infarc-tion (2,3); medicainfarc-tion use for treating cardiopathies (beta-blockers) (9); respiratory atopies (2,3,10); and hemoptysis. All chest radiographs were analyzed by a pulmonol-ogist holding a specialist title from the Brazilian Society of Pneumology and Tisiology (BSPT). The electrocardio-gram was performed by the Cardiology Service. The physician responsible for the report was a cardiologist from the Brazilian Society of Cardiology (BSC). Physical therapists received prior training for the administration of the pre-selection questionnaire (2), the Charlson index (7), and the International Physical Activity Questionnaire (11).
Spirometry
Spirometry exams were conducted from 8:00 am to 12:00 noon, at the Laboratory of Pulmonary Function of the UERJ, a referral center with 25 years of experience accredited by the BSPT for training professionals in pulmonary function in the state of Rio de Janeiro.
The exams followed the American Thoracic Society (ATS) 1987 protocol (12), which was adapted for the Brazilian Guidelines for Pulmonary Function Tests (2002) (2).
The device used was the Vitatrace VT 130 SL (Codax Ltda., Brazil) breath spirometer, which was integrated to the Spiromatic 2.0 program (Engelógica, Rio de Janeiro, Brazil). A maximum of 8 breaths (forced spirometry manip-ulations) and a minimum of 3 were taken in order to meet the acceptability and reproducibility criteria.
The acceptability criteria of the curves adhered to the following criteria proposed by ATS (12) and BSPT (2): a retroextrapolation volumeo5% of the forced vital capacity (FVC) or 150 mL; forced expiration duration of at least 6 s; occurrence of a plateau in the volume-time curve for at least 1 s, after a minimum expiratory time of 6 s, or a volume in the last second lower than 25 mL, and a number of 3 to 8 breaths, with at least 3 acceptable and 2 repro-ducible curves.
The criteria for curve reproducibility followed those proposed by ATS/ERS (European Respiratory society) (3) and BSPT (2): difference in FVC in the best two curves o150 mL, forced expiratory volume in 1 s (FEV1) in the best two curveso150 mL, and difference in the peak of expiratoryflow (PEF) in the best curveso10%.
The outcome variables were FVC, FEV1, FEV1/FVC, PEF, 25 to 75% forced expiratory flow from the curve (FEF25-75%), FEF50%, FEF75%, and average forced expira-toryflow time (FEFT).
Statistical analysis and derivation of equations Kolmogorov-Smirnov tests were performed in order to determine whether the study population was homoge-neous. Subsequently, parametric tests (Student’s t-test and the Pearson correlation equation) were used to analyze values with normal distribution, taking into account the average and standard deviation. Anthropometric and spirom-etry data are reported as medians and percentages, using number and point graphs. All analyses were carried out in Stata 14 (StataCorp LP, USA). Estimated coefficients with Po0.05 were considered to be significant.
In the univariate regression analysis, the dependent variables were the spirometric indices. Correlation coeffi -cient tests of the functional parameters with anthropomet-ric variables and their transformations were conducted. Variables that had a Po0.10 were selected for inclusion in the multivariate analysis.
After determining the multiple regression equations, residuals were identified and their adherence to the normal curve was graphically confirmed. In addition, the asymmetry of the equation was analyzed by 4 tests: Mardia’s asymmetric, Mardia’s kurtosis, Henze-Zirkler, and Doornik-Hansen. The one with the greatest value was noted.
The residual method was used to establish the thresh-old of the reference value, once the regression equation was calculated. The calculated value was subtracted from the average residual value of the equation and corrected by the standard deviation, in order to achieve 95%
The following three equations were calculated for FVC and FEV1: multivariate linear regression, logarithmic regres-sion, and logarithmic regression with the spline variable. This variable is being used for equations of the Global Lung Function Initiative (GLI) (13) and recent Japanese equa-tions (14).
Logarithmic spline equations were calculated with the lambda-median-coefficient of variation (LMS) method. The purpose of the spline is to turn the dependent variable into a non-linear variable (from parametric to non-parametric), allowing it to be an exploratory parameter that can vary slightly (non-linearly). The spline variable was defined after
finding the mean, deviation, and asymmetry of the equa-tion, considering the standard normal distribution:
z¼ g
m l 1
lm ;forla0 andz¼ log ym
s ;forl ¼0
where LMS (l, m, s) = l (asymmetry), m (mean),
s(deviation).
After the transformation and assuming that the vari-able (y) features a smooth curve, the Box-Cox method was applied, with age interpolation via the Box-Cox Cole and Green methods.
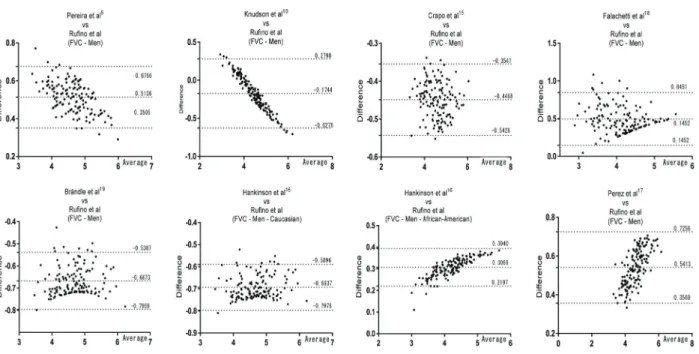
Regression equations were calculated according to Pereira et al. (5), Knudson et al. (10), Crapo et al. (15), Hankinson et al. (16), Pérez et al. (17), Falaschetti et al. (18), and Brändli et al. (19) and compared with the equa-tions of the present study (referred to as Rufino et al.). The values from Kubota et al. (14) and GLI (13) were compared using the spline method (or LMS). It was also used
the Bland-Altman method with GraphPad Prism 6:04 (USA) for agreement analysis.
Results
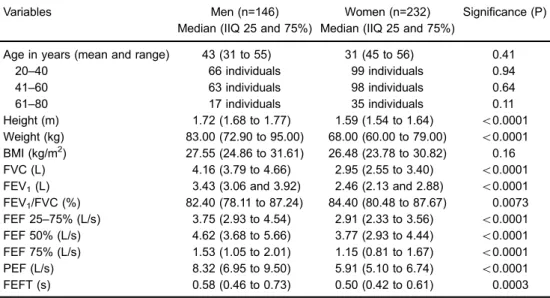
From December of 2010 to July of 2014, a total of 454 individuals were recruited, with 55 being excluded (Figure 1). The sample showed homogeneity when grouped accord-ing to age and accordaccord-ing to gender (Table 1). More women than men were recruited; this is due to the higher fre-quency of diseases among men, as well as a higher level of physical activity compared to women. The weight (in kg) was higher in men than in women. However, when cor-rected by height squared to calculate BMI, differences in weight were non-significant. The lack of significant differ-ences between BMI and age demonstrated that male and female groups were homogeneous (Table 1). The age varied between 20 and 74 in males, and between 20 and 80 in females. There were no differences among age groups selected in 20-year intervals, and between African and non-African descent, based on self-defined ethnicity (Figure 2).
Except for FEV1/FVC ratio, spirometric indices were all higher in males than in females. There was a decrease of approximately 20 mL per year of age in FVC and FEV1 for both genders. The correlations of anthropometric vari-ables were compared with spirometric indices and the r2value was identified (Tables 2 and 3; Figure 3).
the correlations between the proposed equations and the other eight equations currently used worldwide. The non-significant differences between thefindings obtained through the linear equation and the LMS (spline) equation are reported in Table 6.
Discussion
One of the most important tools in the sustainability of equations for reference values in a healthy population is the proper definition of health itself (1,20,21). Being "healthy" means not having a disease or having an effectively con-trolled disease. However, the drugs used for controlling diseases often change pulmonary function (e.g., beta-blockers) (9), which in turn decreases the pool of healthy people in lung analysis, as the frequency of diseases
increases with age (22,23). In a Scottish study (23) involv-ing 1,751,841 patients, a large proportion of individuals
460 had eight disorders. At the age of 85, all had at least one disorder and almost 10% had eight disorders, including systemic arterial hypertension, diabetes mellitus, osteo-porosis, obstructive chronic lung disease, and cancer. In other words, having multiple co-morbidities is a reality in older people. Therefore, to develop equations for the elderly is a challenge. In Brazil, the average life expectancy is about 74 years old (4), which is another limiting factor.
Enright et al. (24) derived regression equations from "healthy" adults aged 65 years or older with a smoking history of up to 5 pack-years, but that quit smoking before turning 50. There were 288 individuals, with 82 below the age of 70 years. The results demonstrated that PEF was greater than expected in 10% of the cases. Part of this Table 1.Anthropometric and spirometric data of the healthy population included in the study.
Variables Men (n=146) Women (n=232) Significance (P)
Median (IIQ 25 and 75%) Median (IIQ 25 and 75%)
Age in years (mean and range) 43 (31 to 55) 31 (45 to 56) 0.41
20–40 66 individuals 99 individuals 0.94
41–60 63 individuals 98 individuals 0.64
61–80 17 individuals 35 individuals 0.11
Height (m) 1.72 (1.68 to 1.77) 1.59 (1.54 to 1.64) o0.0001
Weight (kg) 83.00 (72.90 to 95.00) 68.00 (60.00 to 79.00) o0.0001
BMI (kg/m2) 27.55 (24.86 to 31.61) 26.48 (23.78 to 30.82) 0.16
FVC (L) 4.16 (3.79 to 4.66) 2.95 (2.55 to 3.40) o0.0001
FEV1(L) 3.43 (3.06 and 3.92) 2.46 (2.13 and 2.88) o0.0001
FEV1/FVC (%) 82.40 (78.11 to 87.24) 84.40 (80.48 to 87.67) 0.0073
FEF 25–75% (L/s) 3.75 (2.93 to 4.54) 2.91 (2.33 to 3.56) o0.0001
FEF 50% (L/s) 4.62 (3.68 to 5.66) 3.77 (2.93 to 4.44) o0.0001
FEF 75% (L/s) 1.53 (1.05 to 2.01) 1.15 (0.81 to 1.67) o0.0001
PEF (L/s) 8.32 (6.95 to 9.50) 5.91 (5.10 to 6.74) o0.0001
FEFT (s) 0.58 (0.46 to 0.73) 0.50 (0.42 to 0.61) 0.0003
IIQ: interquartile interval; BMI: body mass index; FVC: forced volume capacity; FEV1: forced expiratory
volume in 1 s; FEV1/FVC: ratio of FEV1to FVC; FEF 25–75%: forced expiratoryflow in 25 to 75%;
PEF: peak expiratoryflow; FEFT: time in seconds of FEF 25–75%. The unpairedt-test was used for
statistical analyses.
finding was attributed to the systemic arterial hypertension in the controlled "healthy" subjects. The higher the arterial pressure, the greater the maximum expiratory flow. The influence from arterial pressure was also afinding in the
work of Pereira et al. (5), which linked lower FVC and FEV1values to arterial hypertension.
Another analysis included healthy individuals who were physically active. It is well known that physical activity can Table 2.Correlations (r2) of spirometric indices with anthropometric data.
Variables Men Women
Height (cm) Weight (kg) Age (years) BMI Height (cm) Weight (kg) Age (years) BMI
FVC (L) 0.3553 0.01997 0.1969 0.0144 0.4628 0.0088 0.3328 0.0404
FEV1(L) 0.3079 0.0200 0.3446 0.0101 0.4497 0.0057 0.4496 0.0468
FEV1/FVC (%) 0.0023 0.0003 0.2201 0.0000 0.0065 0.0013 0.1258 0.0057
FEF25–75% (L/s) 0.1004 0.0227 0.3036 0.0003 0.1499 0.0063 0.2575 0.0079
FEF 50% (L/s) 0.0838 0.0417 0.1560 0.0076 0.1057 0.0087 0.1154 0.0021
FEF 75% (L/s) 0.0802 0.0039 0.3957 0.0032 0.1350 0.0000 0.3235 0.0269
PEF (L/s) 0.1462 0.0132 0.0712 0.0035 0.1700 0.0129 0.1054 0.0036
FEFT (s) 0.0000 0.0064 0.1292 0.0075 0.0002 0.0019 0.0306 0.0027
BMI: body mass index; FVC: forced volume capacity; FEV1: forced expiratory volume in 1 s; FEV1/FVC: ratio of FEV1to
FVC; FEF 25–75%: forced expiratoryflow in 25 to 75%; PEF: peak expiratoryflow; FEFT: time in seconds of FEF 25–75%.
The Pearson correlation test was used.
Table 3.Equation coefficients for spirometric variables for men and women.
Spirometric variables
Age Height Constant r2 Residual
(mean)
Asymmetry Prob4F
Men
FVC –0.0170** 0.0563** –4.7356 0.4583 0.5093 0.4775 0.0000
FEV1 –0.0234** 0.0447** –3.1952 0.5354 0.4389 0.0647 0.0000
FEV1/FVC –0.2149** –0.0628 102.475 0.2480 34.1228 0.8643 0.0000
PEF –0.0245* 0.0904 ** –6.2904 0.4235 3.1367 0.8151 0.0000
FEF25–75% –0.0464** 0.0394** 0.9972 0.3440 1.6117 0.7234 0.0000
FEF50% –0.0376* 0.0479 –1.9008 0.1993 2.2250 0.8012 0.0000
FEF75% –0.0328** 0.0175 0.0140 0.4179 0.5791 0.1550 0.0000
FEFT 0.0063** 0.0031 –0.1968 0.1689 0.0427 0.0230 0.0000
Women
FVC –0.0136** 0.0459** –3.7004 0.5656 0.3311 0.1081 0.0000
FEV1 –0.0160** 0.0359** –2.4790 0.6332 0.2574 0.2794 0.0000
FEV1/FVC –0.1434** –0.0683 101.5395 0.1314 30.3087 0.3633 0.0000
PEF –0.0156** 0.0635** –3.4612 0.1978 1.6069 0.3029 0.0000
FEF25–75% –0.0272** 0.0308** 0.6736 0.2942 0.9461 0.9033 0.0000
FEF50% –0.0179** 0.0360** –1.1238 0.1558 1.1815 0.0886 0.0000
FEF75% –0.0220** 0.0153** 0.1543 0.3435 0.4316 0.0824 0.0000
FEFTa 0.0204** 0.4984 1.4111* 0.0563 0.0850 0.0006 0.0041
FVC: forced vital capacity; FEV1: forced expiratory volume during the 1st second; PEF: peak
expiratoryflow; FEF: forced expiratoryflow; FEFT: time in seconds of forced expiratoryflow; r2: coefficient of determination; Prob: probability. aLogarithmic equation. **Po5%; *Po10%. Calculations for the
variables: Equations = (age*coefficient)+(height*coefficient)+constant. Logarithmic equations: FEFT=
e(Ln height*coefficient)+(age*coefficient)+(ageE2*coefficient##);##height coef
ficients (squared): all women=–1.41113**. For the FVC and FEV1spline equations: Men or women=e[a0+a1*Ln(height)+a2*Ln(age)+height-age spline+db]. The
interpolating height-age variable spline for men for FVC and FEV1were–0.0043 and–0.0109, respectively.
The interpolating height-age variable spline for women for FVC and FEV1 were –0.0041 e 0.0050,
increase lung volume, especially the practice of water polo, basketball, rowing (e.g., canoeing), handball, and soccer (25,26). The equations developed in this study were gen-erated from a sedentary population. This probably caused the values to be lower in comparison with the other equations.
Brändli et al. (19) and Crapo et al. (15) did not exclude smokers or ex-smokers from their sample. Today, smoking is seen as an unhealthy habit, since it is well-known that it can lead to an acute or chronic reduction in pulmonary function (2,3,27,28).
The place where the exams are carried out also have a relevant effect on pulmonary function. Values generated withfield devices generally use pneumotachographs and
are corrected or rendered homogeneous by BTPS (body temperature and pressure, saturated) conditions. However, the environmental pollution factor cannot be corrected and it directly interferes with lung function, especially in cities with high pollution levels (29). Equations of Crapo et al. (15) and Knudson et al. (10) featured this factor.
The values used in our equations were standardized by using only one device, by the same technique, taken in the same laboratory during the morning, which differs from all other equations presented and discussed in this article. In order to properly represent the population being studied, we enrolled the minimum number required. Quanjer et al. (30) considered 100 to be the minimum number per gender required for creating an equation. Similar to the study Figure 3.Results of the Bland-Altman test in the forced vital capacity (FVC) in men. Rufino et al. is the present study.
Table 4.FVC and FEV1(L) spline data.
Variables Men Women
FVC FEV1 FVC FEV1
Height logarithmic (a1) 2.3238 2.3824 2.5896 2.2555
Age logarithmic (a2) –0.0376 0.0525 –0.0843 –0.4132
Spline variable –0.0042 –0.0109 –0.0041 0.0050
Constant (a0) –10.23413 –10.8175 –11.58457 –9.1644
Ln: logarithmic. Men (or women)=e[a0+a1
*Ln(height)+a2
*Ln(age)+(spline)]
. For the forced vital capacity (FVC) and forced expiratory volume in 1 second (FEV1) spline
equations: men or women=e[a0+a1
*Ln(height)+a2
*Ln(age)+height-age spline+db]
. The inter-polating height-age variable spline for men for FVC and FEV1were–0.0043 and
–0.0109, respectively. The interpolating height-age variable spline for women for FVC
carried out by Knudson et al. (10) it took many years to obtain the appropriate sample size for our study. Knudson et al. (10) performed a double-triple questionnaire check. We performed a double questionnaire check for morbidity and mortality. The questionnaire by Charlson was also used as a check against thefirst, which was broader and included questions regarding symptoms. In order to avoid biases regarding "forgotten" diseases or disease denial or impaired respiratory function, chest radiographs were performed in all patients, similarly to Crapo et al. (15), as well as electro-cardiograms. These criteria made our sample selection a very rigorous process.
Ethnicity is an important variable of complex identifi ca-tion. In our data, self-declared ethnicity did not differ sig-nificantly among the groups from which the reference values were derived. It is understood that ethnicity affects body proportions, such as the Cormic index, which is the relation between the height measured at sitting position (encephalic-trunk height) and standing height. Lung volume would be more correlated with seating height than with standing height (stature). This can occur in up to 53% of African descendants and Caucasian-Americans (31). Our analysis did not confirm differences between ethnicities as it has
also been shown in some Brazilian genetic studies (32,33). This might be explained, at least in part, by the broad miscegenation in our population.
Gender can account for up to 30% of pulmonary func-tion variafunc-tion and the separafunc-tion of reference equafunc-tions by gender is common (34). We found differences of up to 31% in respiratory volumes between genders. It is understood that men’s larger lung size also interferes with all the other airway components (35). This partially explains the lower FEV1/FVC in men than women, implying that the airways are more subjected to dynamic compression (20).
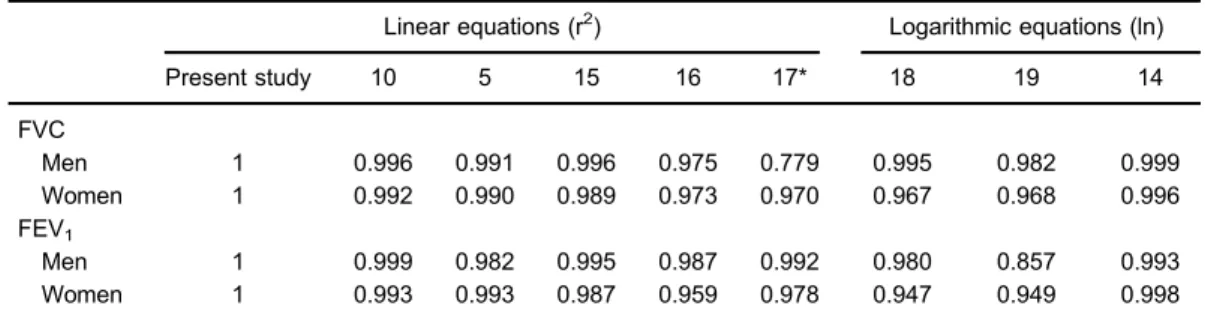
The choice of using a certain reference equation can result in the characterization of a specific respiratory disorder in some individuals (36). The GLI (13) used a new statistical model (LMS), which is the transformation of metric data into parametric data. The LMS is a method that can equalize errors. It turns nonparametric samples in parametric samples and it has been used in various parts of the world. Thus, the method can merge data from dif-ferent parts of the world using the interpolation variables. The ERS task force derived equations for reference values using a bank of 160,000 individuals from 72 pulmonary function laboratories in 33 countries. After applying the Table 5.Correlations of FVC and FEV1with different equations.
Linear equations (r2) Logarithmic equations (ln)
Present study 10 5 15 16 17* 18 19 14
FVC
Men 1 0.996 0.991 0.996 0.975 0.779 0.995 0.982 0.999
Women 1 0.992 0.990 0.989 0.973 0.970 0.967 0.968 0.996
FEV1
Men 1 0.999 0.982 0.995 0.987 0.992 0.980 0.857 0.993
Women 1 0.993 0.993 0.987 0.959 0.978 0.947 0.949 0.998
FVC: forced vital capacity; FEV1: forced expiratory volume during the 1st second. Linear and logarithmic refer to
the multiple regression equation model with variables that are entirely linear or entirely logarithmic. The numbers in the second row refer to the reference number of the studies. ln: natural logarithm. *X40 years old.
Table 6.FVC and FEV1values obtained through the LMS and linear method.
LMS (spline)*
Linear regression
Average difference in values (spline-linear)
P
FVC (L)
Men 4.296±0.474 4.355±0.540 –0.059 0.325
Women 3.044±0.479 3.021±0.445 0.023 0.592
FEV1(L)
Men 3.552±0.473 3.612±0.550 –0.060 0.323
Women 2.559±0.446 2.545±0.419 0.014 0.732
Data are reported as means±SD. *Based on the LMS method and reference 13. FVC: forced vital capacity; FEV1: forced expiratory volume in 1 s. The Student’st-test was used
exclusion criteria, a significant number of 97,759 "healthy," non-smoking individuals, who were 2.5 to 95 years of age with different ethnicities, were included, such as Caucasians, African-Americans, northern and southeastern Asians, Latin Americans, Native Americans, Polynesians, and Arabs. It is very difficult to obtain homogeneous data with such a mixture of numbers and ethnicities. Therefore, such research should be considered a proposal and not an operational standard, since it was not a prospective and controlled study and data were collected in pulmonary function labs with different quality levels. Despite these contradictory facts, the equations were made using the LMS method (13). When we compared the data from the linear equations for men and women, both FVC and FEV1 did not show statistical differences. In other words, the LMS method or linear regression should yield similar values, which can be beneficial when using the LMS method for international equations in the future.
The linear regression equations featured similar values for the coefficients, residuals, and asymmetry when com-pared to the logarithmic equations, including those for respiratory flows, which is also accepted by the Knudson et al. (10) and Hankinson et al. (16) equations.
Studies have suggested that FVC and FEV1 are proportional to body size (2,20,37–39). This means that a taller individual, with bigger lungs, would have a greater decrease in pulmonary volumes with age, while smaller individuals would have a smaller decrease (20,38). In our study, however, both men and women showed similar decreases with age.
The methodology used in our study of Brazilian equa-tions was crucial towards the differences in absolute values obtained in the study by Pereira et al. (5), whose research generated higher values than ours. The reference
values of Knudson et al. (10) are still valid for the Brazilian population.
The equations derived from the study by Pereira et al. (5) are being used in Brazil. However, the authors had not published spirometry equations for Afro-Brazilian ethnicity. Ourfindings did not differ between self-defined Afro-Brazilian and non-Afro-Brazilian. Thus, the equations presented can alsofill this gap. Another aspect to be noted is that there is a tendency in the literature to qualify the Brazilian ethnicity as the same of other Latin America countries. However, the migratory and colonizing currents among Latin American countries were different, which could interfere in spirometry values.
The coefficient of determinations of the spirometric equations were not close to 1. One of the reasons for this could be that the equations have frequently used the same variables (gender, age, height). One of the main advantages of our study is the use of a simple formula without logarithmic scales. Another important positive aspect is that we provide a new Brazilian equation obtained with a different method than previous studies. As in other countries, such as the United States, lung function laboratories may choose which equation is more suitable.
The LMS model for producing equations can be used in the Brazilian population. One of the characteristics of this method is statistical evolution and the potential to have standard spirometry reference values in the future.
Acknowledgments
We thank the Research Support Foundation of the State of Rio de Janeiro (FAPERJ - Fundac¸ão de Amparo a Pesquisa do Estado do Rio de Janeiro).
References
1. Sunderman FW Jr. Current concepts of "normal values", "reference values", and "discrimination values" in clinical chemistry.Clin Chem1975; 21: 1873–1877.
2. SBPT. Sociedade Brasileira de Pneumologia e Tisiologia. Diretrizes para Testes de Func¸ão Pulmonar. J Pneumol
2002; 28(Suppl 3): S1–S238.
3. Pellegrino R, Viegi G, Brusasco V, Crapo RO, Burgos F, Casaburi R, et al. Standardisation of spirometry.Eur Respir J2005; 26: 948–968, doi: 10.1183/09031936.05.00035205.
4. IBGE. Brasília: Instituto Brasileiro de Geografia e Estatística [updated 2015 Aug 28; cited 2016 May 3]. http://www.ibge. gov.br/home.
5. Pereira CAC, Sato T, Rodrigues SC. Novos valores de referência para espirometria forc¸ada em brasileiros adultos
de rac¸a branca.J Bras Pneumol 2007; 33: 397–406, doi:
10.1590/S1806-37132007000400008.
6. WHO. World Health Organization [updated 2016 June; cited 2016 Jul 12]. http://www.who.int/mediacentre/factsheets/ fs385/en/.
7. Charlson M, Szatrowski TP, Peterson J, Gold J. Validation of a combined comorbidity index.J Clin Epidemiol1994; 47: 1245–1251, doi: 10.1016/0895-4356(94)90129-5.
8. Allen SC, Charlton C, Backen W, Warwick-Sanders M, Yeung P. Performing slow vital capacity in older people with and without cognitive impairment - is it useful?Age Ageing
2010;39: 588–591, doi: 10.1093/ageing/afq084.
9. Salpeter S, Ormiston T, Salpeter E. Cardioselective beta-blockers for reversible airway disease.Cochrane Database Syst Rev 2002; (4): CD002992, doi: 10.1002/14651858. CD002992.
10. Knudson RJ, Lebowitz MD, Holberg CJ, Burrows B. Changes in the normal maximal expiratory flow-volume curve with growth and aging.Am Rev Respir Dis1983;127: 725–734. 11. Craig CL, Marshall AL, Sjostrom M, Bauman AE, Booth Ml,
Ainsworth Be, et al. International Physical Activity Question-naire: 12-Country Reliability and Validity.Med Sci Sports Exerc
2003; 35: 1381–1395, doi: 10.1249/01.MSS.0000078924.
12. ATS. American Thoracic Society. Standardization of spiro-metry - 1987 update.Am Rev Respir Dis1987; 136: 1285–
1298, doi: 10.1164/ajrccm/136.5.1285.
13. Quanjer PH, Stanojevic S, Cole TJ, Baur X, Hall GL, Culver BH, et al. ERS global lung function initiative. Multi-ethnic reference values for spirometry for the 3-95-yr age range: the global lung function 2012 equations.Eur Respir J2012; 40: 1324–1343, doi: 10.1183/09031936.00080312. 14. Kubota M, Kobayashi H, Quanjer PH, Omori H, Tatsumi K,
Kanazawa M. Clinical Pulmonary Functions Committee of the Japanese Respiratory Society. Reference values for spi-rometry, including vital capacity, in Japanese adults calcu-lated with the LMS method and compared with previous values.Respir Investig 2014; 52: 242–250, doi: 10.1016/
j.resinv.2014.03.003.
15. Crapo RO, Morris AH, Gardner RM. Reference spirometric values using techniques and equipment that meet ATS recommendations.Am Rev Respir Dis1981; 123: 659–664.
16. Hankinson JL, Odencrantz JR, Fedan KB. Spirometric reference values from a sample of the general U.S. population.
Am J Respir Crit Care Med1999; 159: 179–187, doi: 10.1164/
ajrccm.159.1.9712108.
17. Pérez-Padilla R, Valdivia G, Muiño A, López MV, Márquez MN, Montes de Oca M, et al. Spirometric reference values in 5 large Latin American cities for subjects aged 40 years or over.Arch Bronconeumol2006; 42: 317–325, doi: 10.1016/ S1579-2129(06)60540-5.
18. Falaschetti E, Laiho J, Primatesta P, Purdon S. Prediction equations for normal and low lung function from the Health Survey for England.Eur Respir J2004; 23: 456–463.
19. Brändli O, Schindler C, Künzli N, Keller R, Perruchoud AP. Lung function in healthy never smoking adults: reference values and lower limits of normal of a Swiss population.
Chest1996; 51: 277–283.
20. Clausen JL. Pulmonary function testing guidelines and controversies: equipment, methods, and normal values. New York: Academic Press; 1982.
21. Becklake MR. Concepts of normality applied to the measure-ment of lung function.Am J Med1986; 80: 1158–1164, doi:
10.1016/0002-9343(86)90678-9.
22. MacNee W, Rabinovich RA, Choudhury G. Ageing and the border between health and disease.Eur Respir J2014; 44: 1332–1352, doi: 10.1183/09031936.00134014.
23. Barnett K, Mercer SW, Norbury M, Watt G, Wyke S, Guthrie B. Epidemiology of multimorbidity and implications for health care, research, and medical education: a cross-sectional study.Lance. 2012; 380: 37–43, doi: 10.1016/S0140-6736 (12)60240-2.
24. Enright PL, Adams AB, Boyle PJ, Sherrill DL. Spirometry and maximal respiratory pressure references from healthy Minnesota 65- to 85-year-old women and men.Chest1995; 108: 663–669, doi: 10.1378/chest.108.3.663.
25. Mazic S, Lazovic B, Djelic M, Suzic-Lazic J, Djordjevic-Saranovic S, Durmic T, et al. Respiratory parameters in elite
athletes-does sport have an influence?Rev Port Pneumol
2015; 21: 192–197.
26. Durmic T, Lazovic B, Djelic M, Lazic JS, Zikic D, Zugic V, Dekleva M, et al. Sport-specific influences on respiratory patterns in elite athletes.J Bras Pneumol 2015; 41: 516–
522, doi: 10.1590/S1806-37562015000000050.
27. SBPT. I Consenso Brasileiro sobre Espirometria.J Pneumol
1996; 22: 105–164.
28. Cohen CA, Hudson AR, Clausen JL, Knelson JH. Respira-tory symptoms, spirometry, and oxidant air pollution in non-smoking adults.Am Rev Respir Dis1972; 105: 251–261.
29. da Silva LF, Saldiva SR, Saldiva PH, Dolhnikoff M, Bandeira Científica Project. Impaired lung function in individuals chronically exposed to biomass combustion.Environ Res
2012; 112: 111–117, doi: 10.1016/j.envres.2011.10.012.
30. Quanjer PH, Stocks J, Cole TJ, Hall GL, Stanojevic S; Global Lungs Initiative. Influence of secular trends and sample size on reference equations for lung function tests.
Eur Respir J 2011; 37: 658–664, doi: 10.1183/09031936.
00110010.
31. Harik-Khan RI, Muller DC, Wise RA. Racial difference in lung function in African-American and White children: effect of anthropometric, socioeconomic, nutritional, and environ-mental factors. Am J Epidemiol2004; 160: 893–900, doi:
10.1093/aje/kwh297.
32. Lins TC, Vieira RG, Abreu BS, Grattapaglia D, Pereira RW. Genetic composition of Brazilian population samples based on a set of twenty eight ancestry informative SNPs.Am J Hum Bio2010; 22: 187–192, doi: 10.1002/ajhb.20976.
33. Friedrich DC, Genro JP, Sortica VA, Suarez-Kurtz G, de Moraes ME, Pena SD, et al. Distribution of CYP2D6 alleles and phenotypes in the Brazilian population.PLoS One2014; 9: e110691., doi: 10.1371/journal.pone.0110691.
34. Collins DV, Cutillo AG, Armstrong JD, Crapo RO, Kanner RE, Tocino I, et al. Large airway size, lung size, and maximal expiratoryflow in healthy nonsmokers.Am Rev Respir Dis
1986; 134: 951–955, doi: 10.1164/arrd.1986.134.5.951.
35. Martin TR, Castile RG, Fredberg JJ, Wohl ME, Mead J. Airway size is related to sex but not lung size in normal adults.J Appl Physiol1987; 63: 2042–2047.
36. Vaz Fragoso CA, McAvay G, Van Ness PH, Casaburi R, Jensen RL, MacIntyre N, et al. Phenotype of normal spirom-etry in an aging population.Am J Respir Crit Care Med
2015;192: 817–825, doi: 10.1164/rccm.201503-0463OC. 37. Lowery EM, Brubaker AL, Kuhlmann E, Kovacs EJ. The
aging lung.Clin Interv Aging2013; 8: 1489–1496. 38. Knudson RJ, Slatin RC, Lebowitz MD, Burrows B. The
maximal expiratory flow-volume curve: normal standards, variability, effects of age. Am Rev Respir Dis 1976; 113: 587–599.
39. Quanjer PH, Capderou A, Mazicioglu MM, Aggarwal AN, Banik SD, Popovic S, et al. All-age relationship between arm span and height in different ethnic groups. Eur Respir J