Acid Hydrolysis and Molecular Density of
Phytoglycogen and Liver Glycogen Helps
Understand the Bonding in Glycogen
α
(Composite) Particles
Prudence O. Powell1,2, Mitchell A. Sullivan1,2, Joshua J. Sheehy1,2, Benjamin L. Schulz3, Frederick J. Warren2, Robert G. Gilbert1,2*
1Tongji School of Pharmacy, Huazhong University of Science and Technology, Wuhan, Hubei, China, 2Centre for Nutrition and Food Sciences, Queensland Alliance for Agriculture and Food Innovation, The University of Queensland, Brisbane, QLD, Australia,3School of Chemistry and Molecular Biosciences, Faculty of Science, The University of Queensland, Brisbane, QLD, Australia
Abstract
Phytoglycogen (from certain mutant plants) and animal glycogen are highly branched glu-cose polymers with similarities in structural features and molecular size range. Both appear to form compositeαparticles from smallerβparticles. The molecular size distribution of liver glycogen is bimodal, with distinctαandβcomponents, while that of phytoglycogen is monomodal. This study aims to enhance our understanding of the nature of the link between liver-glycogenβparticles resulting in the formation of largeαparticles. It examines the time evolution of the size distribution of these molecules during acid hydrolysis, and the size de-pendence of the molecular density of both glucans. The monomodal distribution of phytogly-cogen decreases uniformly in time with hydrolysis, while with glyphytogly-cogen, the large particles degrade significantly more quickly. The size dependence of the molecular density shows qualitatively different shapes for these two types of molecules. The data, combined with a quantitative model for the evolution of the distribution during degradation, suggest that the bonding betweenβintoαparticles is different between phytoglycogen and liver glycogen, with the formation of a glycosidic linkage for phytoglycogen and a covalent or strong non-co-valent linkage, most probably involving a protein, for glycogen as most likely. This finding is of importance for diabetes, whereα-particle structure is impaired.
Introduction
Phytoglycogen is a highly branched glucan found in certain mutant plants that arises as a con-sequence of a variety of mutations that result in disruptions in the gene encoding the isoamy-lase debranching enzyme. An example of one of these mutations is theSugary-1mutant maize line [1–4] Glycogen is a structurally similar polymer involved in glucose regulation synthesized OPEN ACCESS
Citation:Powell PO, Sullivan MA, Sheehy JJ, Schulz BL, Warren FJ, Gilbert RG (2015) Acid Hydrolysis and Molecular Density of Phytoglycogen and Liver Glycogen Helps Understand the Bonding in Glycogen
α(Composite) Particles. PLoS ONE 10(3): e0121337. doi:10.1371/journal.pone.0121337
Academic Editor:Marià Alemany, Faculty of Biology, SPAIN
Received:November 12, 2014
Accepted:February 10, 2015
Published:March 23, 2015
Copyright:© 2015 Powell et al. This is an open access article distributed under the terms of the
Creative Commons Attribution License, which permits unrestricted use, distribution, and reproduction in any medium, provided the original author and source are credited.
Data Availability Statement:All relevant data are within the paper and its Supporting Information files.
Funding:This work was funded by the Australian Research Council Discovery grant, DP130102461, and the Thousand-Talents Program of the Chinese Foreign Experts Bureau. The funders had no role in study design, data collection and analysis, decision to publish, or preparation of the manuscript.
by animals [5]. Both function as glucose storage polymers, and are made ofα-(1!4)-linked glucose units forming linear chains that are joined together viaα-(1!6) glycosidic linkages as branch points. Glycogen is also associated with small but significant amounts of protein [6–8]. The size distribution of liver glycogen, ranging from ~20 to 300 nm in diameter, shows two components [9]. The smaller comprises what appear in transmission electron microscopy (TEM) to be homogenous entities termedβparticles (~ 20 nm in size). These particles can join together, by a mechanism which is presently unclear, to form largerαparticles (50–300 nm) which have a composite, cauliflower-like, appearance. TEM images of phytoglycogen also show composite particles [10], and phytoglycogen has a monomodal size distribution of parti-cles with a similar size range to that of glycogen [9,11]. Here we use the termsβandαparticles to denote small particles with apparently homogeneous morphology, and large particles with apparently composite morphology, respectively, always recognizing thatβparticles in one gly-can may be structurally different from those in the other, and similarly forαparticles.
For liver glycogen, the formation of largeαparticles correlates with normal blood glucose regulation in mice [12,13]. This finding is based on the discovery thatdb/dbmice (which serve as a model for type II diabetes) display alteredα-particle formation [13]. It is not known if the lack of largeαparticles observed in the size distributions of liver glycogen dissolved in dimethyl sulfoxide fromdb/dbmice contributes to the development of type II diabetes, is a result of the disease, or if it is simply a feature of thedb/dbmouse. Nor is it known how the smallerβ parti-cles are bound to form largeαparticles in liver glycogen. Possible binding mechanisms previ-ously explored include aggregation through hydrogen bonding/hydrophobic effects [14], protein disulfide bonds [15,16] and glycosidic linkages [14]. In principle, proteomics could provide a direct answer to this problem by finding differences in the bound proteins inαandβ
particles, but this is not a simple task. Removing the abundant unbound proteins from a liver sample is a major challenge and even the best current work on this can be seen not to overcome this problem [8]. It is for this reason that we have undertaken the present work which seeks in-formation on this binding using indirect experimental evidence, especially the time evolution of the size distribution during acid hydrolysis and the size distribution of the molecular density.
Recent work looking at changes in glycogen particle size distributions during acid hydrolysis has determined that the bonding between components in liver glycogen is unlikely to be hydro-gen or glycosidic bonds, with the most likely candidate being a linkage where small particles formed by glycosidic linkages are joined by a covalent or non-covalent bond involving a pro-tein, which we have termed a protein“glue”[14].
The objective of this paper is to obtain information on the binding of smallβparticles into large compositeαparticles in liver glycogen. This binding is impaired in diabetic liver glyco-gen, and so the knowledge gained could prove useful in the management of diabetes. In this paper, this is done by comparing certain properties of glycogen (synthesized in animals) and phytoglycogen (synthesized in plants); these properties are the evolution of molecular size dis-tribution during acid hydrolysis and the size dependence of molecular density. Glycogen and phytoglycogen are structurally very similar. Further, the branching enzymes involved in the biosynthesis of both molecules have similarities, e.g. in the conserved sequences close to the binding sites. This makes phytoglycogen a good control to explore the binding in liver glyco-gen, especially because phytoglycogen biosynthesis and regulation involves fewer proteins than does glycogen synthesis in the liver.
Acid hydrolysis is expected to occur uniformly throughout the particles, while enzymatic degradation is probably confined to the exterior of the glycogen particles. Understanding any quantitative and qualitative differences in the time evolution of the size distributions of phyto-glycogen and liver phyto-glycogen during acid hydrolysis would help to understand any structural
differences. The reason for comparing these two particles is that a) liver glycogen has two dis-tinct populations, which may be assigned asαandβparticles, whereas phytoglycogen has only a single population which also contains some composite particles and covers a similar size range as theαandβparticles in liver glycogen. Comparing these two distinct glucans can aid in finding any structural differences between the isolatedβparticles in glycogen, the individual
βparticles in glycogenαparticles, and the individualβ-like particles in phytoglycogenα-like particles, particularly as theαandβparticle populations are extremely difficult to isolate from one another due to the overlap of the populations. Characterizing the fully branched structures of phytoglycogen and liver glycogen will aid in our understanding of the differences in their structures and could provide important clues to help us understandα-particle linkage. This may further our understanding of the role of these particles in type II diabetes.
Materials and Methods
Materials
Grain fromsugary-1mutant maize plants was obtained from Prof. Ian D. Godwin (The Uni-versity of Queensland, Brisbane, Australia) and ground to a fine powder in a cryo-mill (Freez-er.Mill 6870, SPEC CertiPrep, Metuchen, NJ, USA; 1 min precooling followed by 5 min grinding), a technique that has been shown to minimize degradation of glucan polymers [17]. Phytoglycogen in the ground grain was extracted and purified as described in a previous study [11]; it is noted that the mature grain does not show diurnal cycling in starch/phytoglycogen content. Kernel flour (100 mg) was weighed into a centrifuge tube and incubated in a 2.5 mL aqueous solution of protease (2.5 units/mL; bacterial type XIV, Sigma-Aldrich, Castle Hill, NSW, Australia) and tricine buffer (pH 7.5, 250 mM) solution at 37°C for 30 min. An addition-al 2.5 mL of cold tricine buffer was added to the sample after incubation then centrifuged at 4000 g for 10 min. The supernatant was collected and the phytoglycogen precipitated using ap-proximately four volumes of absolute ethanol. The solution was centrifuged at 4000 g for 10 min and the precipitate washed once more with ethanol. The pellet was re-suspended in deion-ized water before being lyophildeion-ized (freeze-dried; VirTis, Benchtop K).
Glycogen was extracted from pig livers and purified as described in a previous study [14]. The liver sample was collected from the central lobe of the liver, immediately frozen in dry ice and kept at -80°C for 6 weeks before glycogen analysis. The liver glycogen was homogenized in five volumes of cold (4°C) glycogen isolation buffer (50 mM Tris, pH 8, 150 mM NaCl, 2 mM EDTA, 50 mM NaF, 5 mM sodium pyrophosphate, and protease-inhibiting phenylmethansul-fonylfonylfluoride (PMSF). Tris has been shown to be a potent inhibitor of glycosidase activity [18]. The sample was centrifuged at 6000 g for 10 min at 4°C with the resulting supernatant centrifuged further at 50000 g for 30 min at 4°C. The pellet was re-suspended in glycogen isola-tion buffer and layered over a stepwise sucrose gradient (25, 50 and 75% in glycogen isolaisola-tion buffer) before being centrifuged at 300 000 g for 2 h at 4°C. The pellet containing the extracted glycogen was re-suspended in 80% ethanol and centrifuged at 4000 g for 10 min at 4°C before the supernatant was discarded. The ethanol washing step was repeated once more and the pel-let was re-suspended in deionized water before being lyophilized (freeze-dried; VirTis, Bench-top K).
Transmission Electron Microscopy (TEM)
1010 TEM (Tokyo, Japan) operating at 100 kV at the UQ Centre for Microscopy and Micro-analysis. Images were digitally recorded with a SIS Veleta CCD camera (Olympus, Münster, Germany) and AnalySiS image management software.
Size Exclusion Chromatography (SEC)
SEC (also termed GPC) separates polymers based on their hydrodynamic volume (Vh) or the
corresponding hydrodynamic radiusRh. The resulting information is presented here as the SEC weight distribution,w(logRh), which is the same asw(logVh) to within an arbitrary
factor.
One limitation of our earlier work on acid hydrolysis was that the distributions were ana-lyzed by DMSO/LiBr SEC. This system does not give clear separation of the peaks ofαandβ
particle populations in liver glycogen. Recently it has been found that aqueous-based SEC sys-tems are able to produce distributions with improved separation of these two particle popula-tions [19]. SEC for liver glycogen and phytoglycogen here uses an aqueous eluent [9,20]. An AF2000 SEC set-up (Postnova Analytics, Landsberg-Lech, Germany) with a flow rate of 0.3 mL/min was used to analyze the structures of branched phytoglycogen and liver glycogen. SU-PREMA preColumn 30 and 3000 (PSS Germany) analytical columns were used, which provide good resolution for glycogen in aqueous SEC [9]. These columns were placed in a column oven at 80°C with 50 mM NH4NO3containing 0.02% sodium azide as the eluent. A refractive index
detector (RID; Shimadzu RID-10A, Shimadzu, Japan) was used.
Universal calibration curves were obtained using pullulan standards (PSS) with a molecular weight range of 342 to 2.35 × 10⁶. The Mark-Houwink parameters used wereK= 1.0176 × 10⁻³ dL g–1andα= 0.525, giving anR
hupper limit of calibration of ~44 nm (Prof. Katja Loos,
Uni-versity of Groningen, private communication). Elugrams were smoothed using a 5-point mov-ing-point average.
A significant disadvantage of SEC is the occurrence of band-broadening, which can distort the shape of the distribution and mask fine features. For the present purposes, these problems do not affect the conclusions drawn from the data.
Acid Hydrolysis
Previous examination of the effects of low pH on liver glycogen structure indicated that protein may be involved in the binding of small liver glycogenβparticles to formαparticles [14]. A modified method to that used previously [14] was employed here for acid hydrolysis of both phytoglycogen and liver glycogen.
Phytoglycogen and liver glycogen were dissolved in 0.1 M sodium acetate buffer (2 mg/mL; pH ~3.5) and heated to 80°C in a thermomixer for timed intervals between 10 min and 14 days. All samples were run in duplicate. The samples were removed from the thermomixer after the designated period of time and the phytoglycogen and liver glycogen precipitated with four volumes of ethanol. Samples were centrifuged for 10 min at 4000 g and the supernatant discarded. Samples were dissolved in aqueous (ammonium nitrate) eluent (50 mM NH4NO3
with 0.02% sodium azide) for SEC analysis. As an additional control, phytoglycogen and liver glycogen were dissolved in deionized water (2 mg/mL; performed in duplicate) and heated in the thermomixer at 80°C for 7 days. The samples were precipitated in four volumes of absolute ethanol then centrifuged (4000 g for 10 min). They were then dissolved in the aqueous eluent and characterized by SEC.
Model for the Uniform Degradation of Glucans during Acid Hydrolysis
over Time
Data interpretation was aided by the following mathematical model describing the time evolu-tion of the size distribuevolu-tion for the ideal case where acid hydrolysis of (phyto)glycogen occurs uniformly and randomly throughout the molecule. This assumption is reasonable because of the mobility and small size of hydrogen ions. It is also assumed that the radius of gyration is ap-proximately the SEC hydrodynamic radius,RgRh, which seems to be the case for amylopec-tin [21], whose structure in solution has many similarities to that of liver glycogen and
phytoglycogen. It is further assumed that the“local dispersity”is unity: that number and weight averages of the molecular weight are the same for a given size,MnðRhÞ ¼
MwðRhÞ. This is
prob-ably a reasonable approximation because liver glycogen and phytoglycogen particles are large and randomly hyperbranched, and this relation is indicated by theory under these circum-stances [22]; this monodispersity is also indicated by data from multiple-detection SEC [19]. For notational simplicity, we putVh =VandRh =R.
The SEC size distribution and number distribution are denotedw(logR) andN(R), respec-tively. Under the assumption of unit local dispersity [23], one has:
wðlogRÞ ¼ ½MðRÞ2
NðRÞ ð1Þ
HereMðRÞ ¼M
nðRÞ ¼
MwðRÞ. Further, because of the hyperbranched nature of the
polymer, if one assumes that the internal density inside a glycogen molecule is uniform, then M(R)/V/R3.
By a straightforward change in the derivation of the time evolution of the particle size distri-bution of the growth of synthetic polymer colloids [24], one then has the following evolution equation for the number distribution under uniform degradation:
@NðR;tÞ
@t ¼
@
@VðKNÞ ð2Þ
HereK(V) is the rate of degradation. The derivation of this result is given inS1 Text. It is as-sumed thatK(V) is independent of the internal structure of the molecule but proportional to the amount of glucose monomer within it; one then has
KðVÞ ¼kV ð3Þ
where the rate coefficientkis a constant.Eq. 2is solved numerically usingfinite difference, as set out inS1 Text. As also shown inS1 Text, when one treats the data by comparing results in terms of dimensionless timeτ=kt, there are no adjustable parameters in this model, and one then obtains the value ofkbyfinding the value ofτgiving the bestfit between the calculated and observed size distributions for a given experimental timet.
starting sample and 10 and 30 min time points, subsequent discussion of the acid hydrolysis re-sults does not consider the starting distribution.
Density Distributions of Phytoglycogen and Liver Glycogen
The molecular density at a given hydrodynamic radius is defined here as (weight-average molar mass)/(z-average volume of gyration), withMwandRgz both being functions of
hydro-dynamic radius:
rðRhÞ ¼
Mw 4 3pRgz
3 ð4Þ
Some workers who have examined molecular density (e.g. Fernandez, Rojas and Nilsson [25]) have omitted the factor of 4/3π, but the definition given here enables comparison with macro-scopic densities: thus for example one expects the definition defined as above to be commensu-rate with that of water, ~ 1 g cm–3. The densities of phytoglycogen and liver glycogen were obtained using SEC with differential refractive index (DRI) and multi-angle laser light scatter-ing (MALLS) detection to measureM
wandRgz. Three phytoglycogen samples were extracted
fromsu-1maize grain (Phyto 1, Phyto 2 and Phyto 3; extracted as described in a previous study [11]), and liver glycogen from mice and pigs (Mouse 1, Mouse 2, Mouse 3 and Pig 1) were extracted using methods outlined previously [14]. Approximately 1–2 mg of each sample was dissolved in 500μL of 50 mM NH4NO3containing 0.02% sodium azide in an Eppendorf
tube. Samples were placed in a thermomixer at 80°C at 350 rpm for 8 h, before being centri-fuged at 4000gfor 10 min.
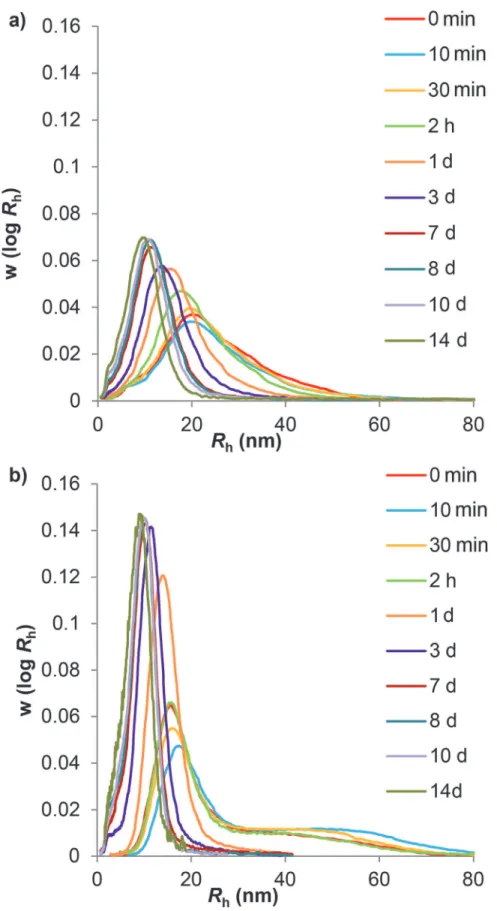
SEC was performed using an Agilent 1100 Series SEC system (Agilent Technologies, Santa Clara, USA) with a MALLS detector (Wyatt, Santa Barbara, CA, USA), and a flow rate of 0.3 mL/min. SUPREMA preColumn 1000 and 10000 (PSS Germany) analytical columns were Fig 1. Aqueous SEC weight distributions of acid hydrolyzed glucans.Phytoglycogen (a) and liver glycogen (b) particle samples were taken over 14 days of acid hydrolysis. The following terms have been abbreviated: minute: min; hours: h; days: d. Curves have been normalized to equal areas.
doi:10.1371/journal.pone.0121337.g001
used, which provide good resolution for glycogen in aqueous SEC [9]. These columns were placed in a column oven at 80°C with the aqueous eluent. Data were reduced toM
w(logRh)
andRgz(logRh) using a Berry plot.
Results
TEM
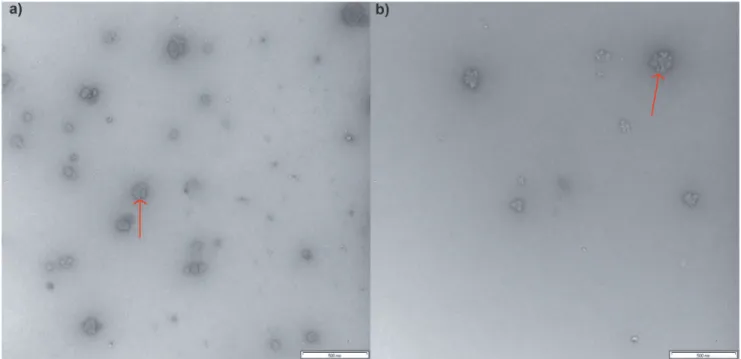
TEM of phytoglycogen and liver glycogen (Fig. 2) indicated the presence ofαparticles in glyco-gen and in phytoglycoglyco-gen, as seen previously, e.g. [10,11,14,26,27]. These particles consist of smallerβparticle subunits which are joined through an unknown binding. Phytoglycogen and liver glycogen appear to have similar morphological structures under TEM and have particles and subunits of approximately similar size which extend over a similar size range. This could possibly indicate that they have a similar structure, but one has to be very wary of such a con-clusion as will be subsequently discussed.
Acid Hydrolysis
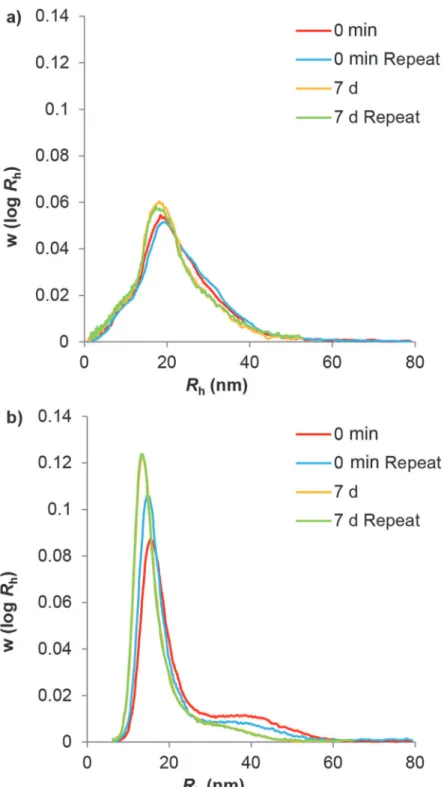
Fig. 3illustrates the effect on the size distributions of heating phytoglycogen and liver glycogen at 80°C in water. Water hydrolysis acted as a control to ensure any effects of hydrolysis is acid were not due to water hydrolysis. Phytoglycogen and liver glycogen show significantly different distributions: monomodal and bimodal respectively, the latter showing two distinctαandβ
particle populations. The particles for each type of glucan had a similar size range. These differ-ences in the distributions of phytoglycogen and liver glycogen have only recently been ob-served, as the SEC method previously used (employing DMSO as the eluent) is unable to properly separateα- andβ-particle peaks, masking this bimodality [9].
After one week of heating phytoglycogen in water, it was observed that there was only slight degradation, resulting in a small change in the overall shape of the distribution. For liver glyco-gen, in contrast, the largerαparticle population was more hydrolyzed by water at an elevated temperature than theβparticle population.
Aqueous SEC was used to characterize and analyze phytoglycogen and liver glycogen during acid hydrolysis (pH ~ 3.5) at 80°C for 10 min, 30 min, 2 h, 1 day, 3 days, 7 days, 8 days, 10 days and 14 days to observe any changes in the particle distribution (Fig. 1). This shows that liver glycogen changes from a bimodal to a monomodal distribution. The composite particles of the liver glycogen are degraded preferentially to small particles: the large composite particles in liver glycogen were completely degraded after 1 day, but the non-composite particle population was much more resistant, as previously reported [14].
While it is tempting to infer from these results that the larger component in liver glycogen is structurally different to the smaller one, this is not unambiguous. This is because one expects that acid hydrolysis will occur essentially uniformly throughout the particles, and thus larger particles will always be degraded more quickly. It is for this reason that the quantitative model of this degradation explicitly includes this size dependence (Eq. 3). The mathematical model is then used to fit the observed time evolution of the size distribution during hydrolysis, to elimi-nate this ambiguity in data interpretation.
Modeling Glucan Hydrolysis
protein between glycosydically-boundβparticles) then this model should fit the degradation of
βbut notαparticles. As stated, the size distribution of each time point was calculated from in-putting an initial size distribution (e.g. the 10 min data as the initial distribution for calculating 30 min, etc.). The only fitting parameter is the dimensionless time,τ=kt. The value ofτis
Fig 2. TEM images of glucans.Typical compositeαparticles of phytoglycogen (a) and liver glycogen (b) particles are indicated by an arrow. Scale bars are 500 nm, images taken at 50K magnification.
doi:10.1371/journal.pone.0121337.g002
chosen to give the best fit to the size distribution at the succeeding time pointt, and the value ofkthen found ask=τ/t.
As seen inFig. 4, the model for uniform degradation gives a relatively good fit to the shape of the phytoglycogen size distribution at each time point, although the value ofkshows signifi-cant variation at different times. The liver glycogen data, in contrast, rapidly deviates from the model predictions. Although the model predicts that the larger component in glycogen de-grades more quickly than the smaller component, the model also predicts that bimodality would be maintained, with the ratio of height of both peaks remaining constant. As can be ob-served inFig. 5andFig. 1, the bimodality of the distribution disappeared after one day of Fig 4. Fittings of phytoglycogen acid hydrolysis experimental data to the model of uniform degradation.Blue lines are values of the dimensionless timeτ=k/t(seeS1 Text), while red lines are experimental acid hydrolysis data. The following terms have been abbreviated: minute: min; hours: h; days: d.
doi:10.1371/journal.pone.0121337.g004
hydrolysis. This discrepancy between model and experiment cannot be ascribed to an experi-mental artifact, particularly band-broadening, as proven inS1 TextandS1 Fig.
Particle Molecular Density
As discussed in detail later, the smallest (largelyβ) particles, having little composite nature, would be expected to show a higher molecular density than the larger particles, which have an extensive composite nature and thus more“empty space”between the components. Thus the naïve expectation is that molecular density would be a decreasing function of molecular size, Fig 5. Fittings of liver glycogen acid hydrolysis data to the model of uniform degradation.Blue lines are values of the dimensionless timeτ=kt(seeS1
Text), while the red lines are the experimental acid hydrolysis data. The following terms have been abbreviated: minute: min; hours: h; days: d.
until flattening out to a final size-independent value which would be that of a sufficiently large
αparticle. As will be seen, the actual behavior is not this simple.
Comparison of phytoglycogen and liver glycogen particle densities (those given here show more detail but are similar to those reported elsewhere [25,27–30]) shows significant differ-ences and similarities between the particles (Fig. 6). As expected, the densities are ~ 1 g cm–3 but slightly less than that of starch in DMSO, density ~ 1.2 g cm–3 [30]. It is seen that the den-sity distribution of phytoglycogen shows an increase associated with the smaller particles fol-lowed by a decrease at larger sizes (extensiveαparticles). The densities of the phytoglycogen particles are larger within theβ-particle population (small particles with little composite na-ture), and are significantly more dense thanβparticles in liver glycogen. Liver glycogen has a bimodal density distribution, where there is an initial shoulder followed by a large peak in the
α-particle population before the density decreases sharply. The different size dependences and values of the densities of phytoglycogen and liver glycogen suggest that these particles differ structurally.
Discussion
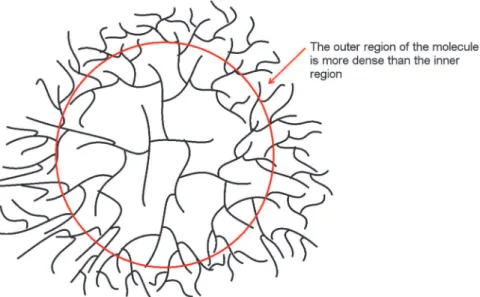
There are many enzymes that both starch (and hence phytoglycogen) and glycogen utilize dur-ing their biosynthesis. Phytoglycogen and glycogen are similar in that neither have a debranch-ing enzyme controlldebranch-ing branch spacdebranch-ing durdebranch-ing their synthesis. This lack of debranchdebranch-ing activity means that the glucans are unable to crystallize like normal starch [31]. Although the biosyn-thetic enzymes for the glycosidic bonds in glycogen and phytoglycogen are similar, they are not the same. This suggests that a major determinant of the size ofβparticles (which are very simi-lar for both polymers) is physical rather than biochemical. This is consistent with mathematical models and is termed a“crowding”mechanism [14,27,32–37]. In this mechanism, as aβ parti-cle grows through addition of anhydroglucose monomer units, the local molecular density in the periphery eventually becomes so high that the biosynthetic enzymes for this process cannot operate freely, hindering further growth (Fig. 7). This“crowding”mechanism is absent in amy-lopectin, where the branching structure (especially the close spacing between branches) is quite different from that in (phyto)glycogen; this is the reason that starch can crystallize while (phyto)glycogen cannot.
Synthesis of largeαparticles, apparently similar to those observed inFig. 2, has been achieved by incubating glucose-1-phosphate with phosphorylase and branching enzyme in an in vitrosystem [38]. As a glucan morphologically resembling phytoglycogen is formed in this simplein vitrosystem [38], it is unlikely that phytoglycogen is synthesized via any enzyme that would involve enzymatic action outside of normal starch biosynthesis. This suggests that the bonds used to form large composite particles in phytoglycogen are glycosidic, and indi-cates that phytoglycogen is most probably formed via the“crowding”mechanism previously outlined.
As was observed inFig. 1andFig. 3, the largeαparticle population of liver glycogen was hy-drolyzed faster than the similar sized population of phytoglycogen, suggesting a different bind-ing mechanism. This is consistent with similar work hypothesizbind-ing that peptides may be the bonding factor which results in the formation of largeαparticles in liver glycogen [14]. Peptide hydrolysis is readily catalyzed by acidic conditions. Additionally, there are many more proteins present in the liver in addition to those involved in glycogen biosynthesis [8] which may have a possible role as a bonding factor. The extraction methods used here have been shown to also extract contaminating proteins; however, due to the much smaller size of proteins compared to glycogen, there is no overlap of the protein contamination peak with the glycogen peak in the SEC weight distributions [39]. Furthermore, any protein which is strongly linked to the
glycogen is inherently part of the molecule and thus of its characterization. Complete hydroly-sis of proteins requires low pH values and high temperatures, while partial hydrolyhydroly-sis of pro-teins can occur under much milder conditions and can occur spontaneously in water at neutral pH [40,41]. Because a protein backbone is covalently linear, the hydrolysis of a single peptide bond would be enough to sever any link involving a protein (Fig. 8) [14]. In addition, it has been previously shown that the rate of hydrolytic degradation of liver-glycogenαparticles is more consistent with protein rather than glycosidic-linkage degradation.
An alternative hypothesis is that multiple glycosidic linkages bondβparticles together. This is similar to the hypothesized mechanism for the formation of phytoglycogen particles; howev-er, in liver glycogen it is likely that if glycosidic linkages are responsible for the formation of composite particles, there are fewer linkages present than in similar sized phytoglycogen parti-cles. This is because the large liver glycogen particles are more acid-labile than their
phytoglycogen counterparts.
By fitting the results of uniform acid hydrolysis of the glucans (as seen inFig. 4andFig. 5) to the distributions generated by a model that assumes uniform degradation (as observed inS1 Fig.), two important observations were made: a) phytoglycogen fits the uniform-degradation model well as far as size distribution is concerned, although the rate coefficientkvaries with the extent of degradation; and b) liver glycogen rapidly and qualitatively deviates from the pre-dicted distribution: in particular, the uniform-degradation model predicts that theα-particle population would remain present. The disappearance of theα-particle population of liver gly-cogen can be most easily explained if the dominant mode of breakdown for liver glygly-cogen is di-rectly into smallerβparticles. The degradation of phytoglycogen, on the other hand, appears to be consistent with non-preferential bond cleavage throughout all regions of the molecule. The relatively good fit of theβparticle population of liver glycogen to the model is consistent with Fig 6. Aqueous SEC weight and molecular density distributions of glucans.Phytoglycogen (a) and liver glycogen (b) weight distributions (dashed lines) and molecular density distributions (c) (solid lines). Weight distributions have been normalized to the distribution peak while the density distributions are absolute.
doi:10.1371/journal.pone.0121337.g006
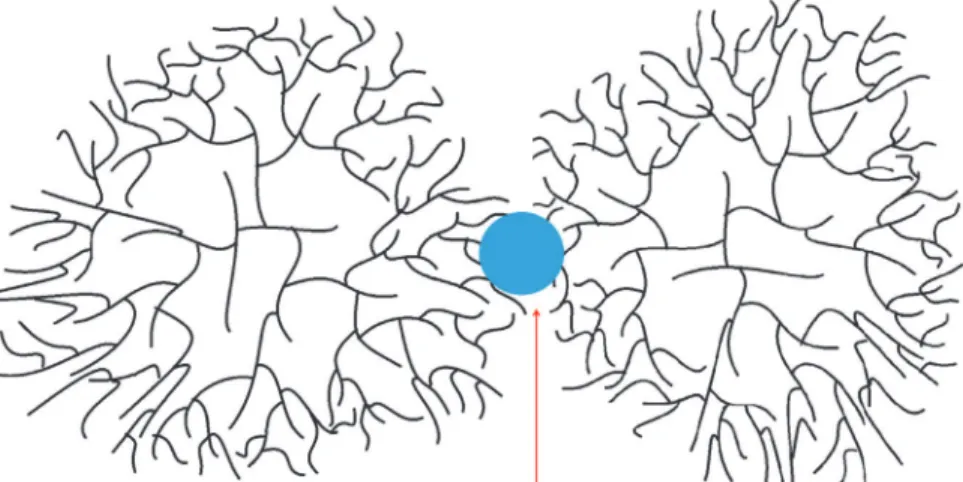
Fig 7. The“crowding”model of particle synthesis.The smallβparticle grows via the synthesis of glycosidic linkages until the density of branches in the periphery becomes so high the biosynthetic enzymes cannot operate freely, hindering growth. The dense periphery is indicated by the red circle and arrow.
doi:10.1371/journal.pone.0121337.g007
non-preferential bond cleavage and thus indicatesβparticles are likely to link through glyco-sidic linkages, as has been demonstrated in the past [36]. These results demonstrate conclusive-ly that the bonding leading to the formation ofαparticles in liver glycogen is different from that leading to the formation ofβparticles.
The uniform degradation of the particles in phytoglycogen supports the theory of a“ crowd-ing/budding”mechanism [14] which builds on the theory of“crowding”discussed previously. In a“crowding/budding”mechanism, once the maximum periphery density has been reached, budding can occur: a growing branch wanders outside the dense outer layer to the uncrowded regions outside the particle’s periphery, whereupon rapid growth can occur and a new particle can form (Fig. 9).
The density distribution of phytoglycogen can be explained by the“crowding-budding” model assuming glycosidic linkages. This model is similar to the“crowding”model described Fig 8. The“crowding-assembly”model of particle synthesis.The smallβparticles are linked (red arrow) to form larger alpha particles
doi:10.1371/journal.pone.0121337.g008
Fig 9. The“crowding/budding”model of particle synthesis.Much like the“crowding model, however a branch is able to escape the dense periphery (red arrow) and is subsequently acted upon by biosynthetic enzymes resulting in a new‘bud’to form large“α-like”particles.
previously With an increase in branching, a theoretical maximum density is approached, leav-ing buddleav-ing of individual branches as the only expansion mechanism, which in turn requires the branching process to start once more. Therefore, while the new bud is incomplete, the den-sity of the molecule is less than that of a phytoglycogen molecule with no budding at a maxi-mum density. As the probability of new buds increases with an increasing radius, the
competition for space between the buds would increase, possibly resulting in impeded bud for-mation, whereby a bud is unable to reach maximum density. As the size of the molecule in-creases, the chance of impeded and incomplete buds also inin-creases, resulting in a decrease of the density.
Liver glycogen density also increases with size initially due to the growing size of theβ parti-cle population, as outlined above. Under the“crowding-assembly”model (Fig. 8) whereβ par-ticles bind together intoαparticles, the formation ofαparticles will also result in a decrease in density, as observed in the liver glycogen density distribution.
While the nature of the linkage between particles in particles in glycogen is unclear, the re-sults obtained here and those described elsewhere are consistent with this being a covalent or strong non-covalent linkage involving a protein. Some candidates are glycogenin or a lectin.
It has been hypothesized that glycogenin is the protein responsible for the binding ofβ par-ticles to formαparticles, as it is the precursor for glycogen synthesis [42,43]. Glycogenin is rel-atively abundant in rat and mouse livers and it has been theorized that it is possibly present on the surface of glycogen particles [8]. If there were an increase in the population ofβparticles, after treating the samples with protease, this would provide strong evidence that protein is re-sponsible for the bonds to formαparticles. However, there is little effect of protease (which hy-drolyses amide linkages in protein) on the distributions of either phytoglycogen or liver glycogen [14], which is ascribed to the large protease molecule being hindered from diffusing within the liver glycogen molecules and thus unable to digest internally-located proteins [14] (seeS2 TextandS4 Fig.).
The data are consistent with the inference that large, composite phytoglycogen particles are most likely formed via a crowding/budding mechanism, whereby steric hindrance in the pe-riphery of smallβparticles slows their growth beyond a certain radius, and further growth oc-curs as a few chains protruding outside this radius themselves become the growth point for forming a new, but linked,βparticle through a glycosidic linkage. The data are consistent with the hypothesis that smallβparticles within liver glycogen are most likely formed via a crowding mechanism, as are the small phytoglycogen“β-like”particles, and that liver-glycogenβ parti-cles are synthesized separately initially and are then joined to form largeαparticles, a mecha-nism of synthesis we term the“crowding/assembling”model.
Conclusions
Liver glycogen, a glucose polymer which is important for blood-sugar storage in animals, com-prises smallβparticles which are linked to form much largerαparticles. The present study in-vestigated the nature of the linkage wherebyβparticles join together to formαparticles, by comparing certain aspects of liver glycogen structure to those of phytoglycogen. Phytoglycogen was used as a tool for comparison, as although both appear to form large compositeαparticles, phytoglycogen contains only glycosidic linkages. Taken together, the present data on molecular density and on the time evolution of size distributions under acid hydrolysis show that liver-glycogenαparticles have a different structure to liver glycogenβparticles. There is circumstan-tial but strong evidence that the binding ofβintoαparticles in liver glycogen is a covalent or strong non-covalent linkage involving a protein.
Given the discovery that formation ofαparticles is impaired in diabetes [13], and that the formation ofαparticles reaches a maximum some time after most glucose storage in liver gly-cogen has already occurred (a process that would optimize blood-sugar control in healthy ani-mals) [12], the discoveries in the present paper on the nature of the bonding resulting inα -particle formation have significant implications for developing new types of drug targets for diabetes.
Supporting Information
S1 Fig. The model of uniform degradation over an extended time period.Each colored line indicates a different value of dimensionless timeτ=ktas calculated from an initial liver glyco-gen distribution. Curves have been normalized to the distribution peak. As can be observed, using the data obtained from liver glycogen for this model, the distribution maintains its bimo-dality over the course of hydrolysis. If band-broadening were qualitatively affecting the distri-bution, it would be expected that the peak at higher hydrodynamic size would turn into an extended tail. This is qualitatively different from what is seen experimentally, suggesting that band broadening does not affect the conclusions drawn from fitting to the model.
(TIF)
S2 Fig. Comparison of fittings generated from the uniform model of hydrolysis.The uni-form model of hydrolysis (h) was fitted to liver glycogen to small“non-composite”particles (a-d) and to largeαparticles (e-g). Theα-particle population can only be fitted up to 2 h as the population has disappeared by the time the next sample was taken, at 1 day. The actual (red) and fitted dimensionless (blue) times are shown. Curves have been normalized to the popula-tion peak of interest. The following terms have been abbreviated: minute: min; hours: h; days: d.
(TIF)
S3 Fig. Modified crowding budding models.The full-bud model reflects the protein mediated binding-assembly model where the structure of the molecule is most likely to be loosely ran-domized resulting in a decreased density. The semi-bud model represents the crowding-bud-ding model where new buds are incomplete decreasing the density of the molecules as the buds are unable to reach maximum density.
(TIF)
S4 Fig. Aqueous SEC weight distributions of glucans subjected to protease treatment. Phy-toglycogen (a) and pig liver glycogen (b) were treated with protease over a range of tempera-tures (20–80°C). Curves have been normalized to equal areas.
(TIF)
S1 Table. Densities of phytoglycogen and starch samples.Molecular weight (Mw) and radius of gyration (Rgz) results were taken from the literature [44]. The densities (ρ)of the samples were re-analyzed to include the factor of 4/3πto enable comparison with macroscopic densi-ties as outlined in materials and methods (Density Distributions of Phytoglycogen and Liver Glycogen).
(DOCX)
S1 Text. Derivation, numerical solution and data fitting of evolution equation for size dis-tribution during acid hydrolysis.
S2 Text. Effects of proteases on glucan structure. (DOCX)
Acknowledgments
The authors gratefully acknowledge Mr Zhou Shiqing (Wuhan) for SEC technical assistance, Mr. Lachlan Kann and Mr Shihan Li (Brisbane) for experimental assistance, the UQ Centre of Microscopy and Microanalysis for technical assistance with TEM analysis, and Drs. Barbara Williams, Helen Keates, Eugeni Roura, and the staff at the University of Queensland Centre for Advanced Animal Science, for pig-liver sample collection.
Author Contributions
Conceived and designed the experiments: POP MAS FJW RGG. Performed the experiments: POP JJS. Analyzed the data: POP JJS MAS RGG. Contributed reagents/materials/analysis tools: POP MAS RGG. Wrote the paper: POP MAS JJS BLS FJW RGG.
References
1. Kubo A, Akdogan G, Nakaya M, Shojo A, Suzuki S, Satoh H, et al. Structure, physical, and digestive properties of starch fromwx aedouble-mutant rice. J Agric Food Chem. 2010 Apr 14; 58(7): 4463–
4469. doi:10.1021/jf904074kPMID:20205452
2. Orzechowski S. Starch metabolism in leaves. Acta Biochim Pol. 2008; 55(3): 435–445. PMID: 18787712
3. Wattebled F, Dong Y, Dumez S, Delvalle D, Planchot V, Berbezy P, et al. Mutants of Arabidopsis lack-ing a chloroplastic isoamylase accumulate phytoglycogen and an abnormal form of amylopectin. Plant Physiol. 2005 May; 138(1): 184–195. PMID:15849301
4. Zeeman SC, Kossmann J, Smith AM. Starch: its metabolism, evolution, and biotechnological modifica-tion in plants. Annu Rev Plant Biol. 2010 Feb 1; 61: 209–234. doi: 10.1146/annurev-arplant-042809-112301PMID:20192737
5. Ball S, Guan HP, James M, Myers A, Keeling P, Mouille G, et al. From glycogen to amylopectin: a model for the biogenesis of the plant starch granule. Cell. 1996 Aug 9; 86(3): 349–352. PMID:8756717 6. Meyer F, Heilmeyer LM Jr., Haschke RH, Fischer EH. Control of phosphorylase activity in a muscle
gly-cogen particle. I. Isolation and characterization of the protein-glygly-cogen complex. J Biol Chem. 1970 Dec 25; 245(24): 6642–6648. PMID:4320610
7. Rybicka KK. Glycosomes—the organelles of glycogen metabolism. Tissue Cell. 1996 Jun; 28(3): 253–
265. PMID:8701432
8. Stapleton D, Nelson C, Parsawar K, McClain D, Gilbert-Wilson R, Barker E, et al. Analysis of hepatic glycogen-associated proteins. Proteomics. 2010 Jun; 10(12): 2320–2329. doi:10.1002/pmic. 200900628PMID:20391537
9. Sullivan MA, Powell PO, Witt T, Vilaplana F, Roura E, Gilbert RG. Improving size-exclusion chromatog-raphy separation for glycogen. J Chromatogr A. 2014 Mar 7; 1332(1): 21–29.
10. Putaux JL, Buleon A, Borsali R, Chanzy H. Ultrastructural aspects of phytoglycogen from cryo-trans-mission electron microscopy and quasi-elastic light scattering data. Int J Biol Macromol. 1999 Nov; 26 (2–3): 145–150. PMID:10628537
11. Powell PO, Sullivan MA, Sweedman MC, Stapleton DI, Hasjim J, Gilbert RG. Extraction, isolation and characterisation of phytoglycogen fromsu-1maize leaves and grain. Carbohydr Polym. 2014 Jan 30; 101(1): 423–431. doi:10.1016/j.carbpol.2013.08.034PMID:24299742
12. Sullivan MA, Aroney ST, Li S, Warren FJ, Joo JS, Mak KS, et al. Changes in glycogen structure over feeding cycle sheds new light on blood-glucose control. Biomacromolecules. 2014 Feb 10; 15(2): 660–
665. doi:10.1021/bm401714vPMID:24372590
13. Sullivan MA, Li J, Li C, Vilaplana F, Stapleton D, Gray-Weale AA, et al. Molecular structural differences between type-2-diabetic and healthy glycogen. Biomacromolecules. 2011 Jun 13; 12(6): 1983–1986. doi:10.1021/bm2006054PMID:21591708
14. Sullivan MA, O'Connor MJ, Umana F, Roura E, Jack K, Stapleton DI, et al. Molecular insights into gly-cogen alpha-particle formation. Biomacromolecules. 2012 Nov 12; 13(11): 3805–3813. doi:10.1021/ bm3012727PMID:23004915
15. Chee NP, Geddes R. The structure of liver glycogen. FEBS Lett. 1977 Feb 1; 73(2): 164–166. PMID: 838057
16. Orrell SA, Bueding E. A comparison of products obtained by various procedures used for the extraction of glycogen. J Biol Chem. 1964 Dec; 239: 4021–4026. PMID:14247641
17. Syahariza ZA, Li E, Hasjim J. Extraction and dissolution of starch from cereal grains for accurate struc-tural analysis. Carbohydr Polym. 2010; 82(1): 14–20.
18. Ortiz de Apodaca MA, Fernandez E, de la Fuente G. Tris discriminates between the differentα -glucosi-dase activities from extracts of human neutrophils. J Inherit Metab Dis. 1992 Mar 1; 15(2): 213–219. PMID:1527988
19. Sullivan MA, Vilaplana F, Cave RA, Stapleton D, Gray-Weale AA, Gilbert RG. Nature of alpha and beta particles in glycogen using molecular size distributions. Biomacromolecules. 2010 Apr 12; 11(4): 1094–
1100. doi:10.1021/bm100074pPMID:20196533
20. Ciric J, Oostland J, de Vries JW, Woortman AJ, Loos K. Size exclusion chromatography with multi de-tection in combination with matrix-assisted laser desorption ionization-time-of-flight mass spectrometry as a tool for unraveling the mechanism of the enzymatic polymerization of polysaccharides. Anal Chem. 2012 Dec 4; 84(23): 10463–10470. doi:10.1021/ac302704qPMID:23121513
21. Vilaplana F, Gilbert RG. Characterization of branched polysaccharides using multiple-detection size separation techniques. J Sep Sci. 2010 Nov; 33(22): 3537–3554. doi:10.1002/jssc.201000525PMID: 20960448
22. Konkolewicz D, Gilbert RG, Gray-Weale A. Randomly hyperbranched polymers. Phys Rev Lett. 2007 Jun 8; 98(23): 238301. PMID:17677941
23. Gaborieau M, Gilbert RG, Gray-Weale A, Hernandez JM, Castignolles P. Theory of multiple-detection size-exclusion chromatography of complex branched polymers. Macromol Theory Simul. 2007 Jan 16; 16(1): 13–28.
24. Lichti G, Gilbert RG, Napper DH. The growth of polymer colloids. J Polym Sci A Polym Chem. 1977; 15 (8): 1957–1971.
25. Fernandez C, Rojas CC, Nilsson L. Size, structure and scaling relationships in glycogen from various sources investigated with asymmetrical flow field-flow fractionation and 1H NMR. Int J Biol Macromol. 2011 Nov 1; 49(4): 458–465. doi:10.1016/j.ijbiomac.2011.05.016PMID:21640751
26. Ryu JH, Drain J, Kim JH, McGee S, Gray-Weale A, Waddington L, et al. Comparative structural analy-ses of purified glycogen particles from rat liver, human skeletal muscle and commercial preparations. Int J Biol Macromol. 2009 Dec 1; 45(5): 478–482. doi:10.1016/j.ijbiomac.2009.08.006PMID: 19720076
27. Huang L, Yao YA. Particulate structure of phytoglycogen nanoparticles probed using amyloglucosi-dase. Carbohydr Polym. 2011 Feb 1; 83(4): 1665–1671.
28. Barber AA, Orrell SA Jr., Bueding E. Association of enzymes with rat liver glycogen isolated by rate-zonal centrifugation. J Biol Chem. 1967 Sep 25; 242(18): 4040–4044. PMID:6061696
29. Konkolewicz D, Gray-Weale AA, Gilbert RG. Molecular weight distributions from size separation data for hyperbranched polymers. J Polym Sci A Polym Chem. 2007 Jul 15; 45(14): 3112–3115.
30. Rolland-Sabate A, Mendez-Montealvo MG, Colonna P, Planchot V. Online determination of structural properties and observation of deviations from power law behavior. Biomacromolecules. 2008 Jul; 9(7): 1719–1730. doi:10.1021/bm7013119PMID:18547102
31. Ball SG, Morell MK. From bacterial glycogen to starch: understanding the biogenesis of the plant starch granule. Annu Rev Plant Biol. 2003; 54: 207–233. PMID:14502990
32. Gunja-Smith Z, Marshall JJ, Mercier C, Smith EE, Whelan WJ. A revision of the Meyer-Bernfeld model of glycogen and amylopectin. FEBS Lett. 1970 Dec 28; 12(2): 101–104. PMID:11945551
33. Marshall JJ, Whelan WJ. Multiple branching in glycogen and amylopectin. Arch Biochem Biophys. 1974; 161(1): 234–238.
34. Melendez-Hevia E, Waddell TG, Shelton ED. Optimization of molecular design in the evolution of me-tabolism: the glycogen molecule. Biochem J. 1993 Oct 15; 295(2): 477–483. PMID:8240246 35. Melendez R, Melendez-Hevia E, Canela EI. The fractal structure of glycogen: A clever solution to
opti-mize cell metabolism. Biophys J. 1999 Sep; 77(3): 1327–1332. PMID:10465745
36. Melendez R, Melendez-Hevia E, Cascante M. How did glycogen structure evolve to satisfy the require-ment for rapid mobilization of glucose? A problem of physical constraints in structure building. J Mol Evol. 1997; 45(4): 446–455. PMID:9321423
38. Mordoh J, Leloir LF, Krisman CR.In vitrosynthesis of particulate glycogen. Proc Natl Acad Sci U S A. 1965 Jan; 53(1): 86–91.
39. Sullivan MA, Li S, Aroney ST, Deng B, Li C, Roura E, et al. A rapid extraction method for glycogen from formalin-fixed liver. Carbohydr Polym. 2015 Mar 15; 118(1): 9–15.
40. Lawrence L, Moore WJ. Kinetics of the hydrolysis of simple glycine peptides. J Am Chem Soc. 1951; 73 (8): 3973–3977.
41. Radzicka A, Wolfenden R. Rates of uncatalyzed peptide bond hydrolysis in neutral solution and the transition state affinities of proteases. J Am Chem Soc. 1996 Jul 3; 118(26): 6105–6109.
42. Graham TE, Yuan Z, Hill AK, Wilson RJ. The regulation of muscle glycogen: the granule and its pro-teins. Acta physiologica. 2010 Aug; 199(4): 489–498. doi:10.1111/j.1748-1716.2010.02131.xPMID: 20353490
43. Roach PJ, Depaoli-Roach AA, Hurley TD, Tagliabracci VS. Glycogen and its metabolism: some new developments and old themes. Biochem J. 2012 Feb 1; 441(3): 763–787. doi:10.1042/BJ20111416 PMID:22248338
44. Wong K-S, Kubo A, Jane J-l, Harada K, Satoh H, Nakamura Y. Structures and properties of amylopec-tin and phytoglycogen in the endosperm ofsugary-1mutants of rice. J Cereal Sci. 2003; 37(2): 139–
149.