A Mathematical Model of Bimodal
Epigenetic Control of miR-193a in Ovarian
Cancer Stem Cells
Frank H. C. Cheng1,2., Baltazar D. Aguda4., Je-Chiang Tsai3., Marek
Kochan´czyk5, Jora M. J. Lin1,2, Gary C. W. Chen1,2, Hung-Cheng Lai6,7,8,9,10, Kenneth P. Nephew11, Tzy-Wei Hwang3*, Michael W. Y. Chan1,2*
1.Department of Life Science, National Chung Cheng University, Min-Hsiung, Chia-Yi, Taiwan, Republic of China,2.Institute of Molecular Biology, National Chung Cheng University, Min-Hsiung, Chia-Yi, Taiwan, Republic of China,3.Department of Mathematics, National Chung Cheng University, Min-Hsiung, Chia-Yi, Taiwan, Republic of China,4.DiseasePathways LLC, Bethesda, Maryland, United States of America,5. Institute of Fundamental Technological Research, Polish Academy of Sciences, Warsaw, Poland,6. Department of Obstetrics and Gynecology, School of Medicine, College of Medicine, Taipei Medical University, Taipei, Taiwan, Republic of China,7.Department of Obstetrics and Gynecology, Shuang Ho Hospital, Taipei Medical University, Taipei, Taiwan, Republic of China,8.Department of Clinical
Pharmacology, Xiangya Hospital, Central South University, Changsha, People’s Republic of China,9.Institute of Clinical Pharmacology, Central South University, Changsha, People’s Republic of China,10.Hunan Key Laboratory of Pharmacogenetics, Changsha, People’s Republic of China,11.Medical Sciences, Department of Cellular and Integrative Physiology, Indiana University School of Medicine, Bloomington, Indiana, United States of America
*biowyc@ccu.edu.tw (MWYC);twhwang@math.ccu.edu.tw (TWH)
.These authors contributed equally to this work.
Abstract
Accumulating data indicate that cancer stem cells contribute to tumor
chemoresistance and their persistence alters clinical outcome. Our previous study has shown that ovarian cancer may be initiated by ovarian cancer initiating cells (OCIC) characterized by surface antigen CD44 and c-KIT (CD117). It has been experimentally demonstrated that a microRNA, namely miR-193a, targets c-KIT mRNA for degradation and could play a crucial role in ovarian cancer development. How miR-193a is regulated is poorly understood and the emerging picture is complex. To unravel this complexity, we propose a mathematical model to explore how estrogen-mediated up-regulation of another target of miR-193a, namely E2F6, can attenuate the function of miR-193a in two ways, one through a competition of E2F6 and c-KIT transcripts for miR-193a, and second by binding of E2F6 protein, in association with a polycomb complex, to the promoter of miR-193a to down-regulate its transcription. Our model predicts that this bimodal control increases the expression of c-KIT and that the second mode of epigenetic regulation is required to generate a switching behavior in c-KIT and E2F6 expressions. Additional analysis of the TCGA ovarian cancer dataset demonstrates that ovarian cancer patients with
OPEN ACCESS
Citation:Cheng FHC, Aguda BD, Tsai J-C, Kochan´czyk M, Lin JMJ, et al. (2014) A Mathematical Model of Bimodal Epigenetic Control of miR-193a in Ovarian Cancer Stem Cells. PLoS ONE 9(12): e116050. doi:10.1371/journal.pone. 0116050
Editor:David Wai Chan, The University of Hong Kong, Hong Kong
Received:September 22, 2014
Accepted:November 30, 2014
Published:December 29, 2014
Copyright:ß2014 Cheng et al. This is an
open-access article distributed under the terms of the
Creative Commons Attribution License, which permits unrestricted use, distribution, and repro-duction in any medium, provided the original author and source are credited.
Data Availability:The authors confirm that all data underlying the findings are fully available without restriction. All relevant data are within the paper and its Supporting Information files.
Funding:This study was supported by the research grants from the Ministry of Science and Technology, Taiwan (NSC102-2320-B-194-006, NSC102-2115-M-194-007-MY2, MOST103-2911-I-194-504 and MOST103-2320-B-194-002), National Center for Theoretical Sciences (NCTS), and National Chung Cheng University (NCCU Interdisciplinary Science grant 103-03), Taiwan. The funders had no role in study design, data collection and analysis, decision to publish, or preparation of the manuscript. Co-author Baltazar D. Aguda is employed by DiseasePathways LLC. DiseasePathways LLC provided support in the form of salary for author BDA, but did not have any additional role in the study design, data collection and analysis, decision to publish, or preparation of the manuscript. The specific role of this author is articulated in the ‘‘author contributions’’ section.
low expression of EZH2, a polycomb-group family protein, show positive correlation between E2F6 and c-KIT. We conjecture that a simultaneous EZH2 inhibition and anti-estrogen therapy can constitute an effective combined therapeutic strategy against ovarian cancer.
Introduction
Ovarian cancer is the most lethal gynecological malignancy and the 5th leading cause of cancer death among women [1]. As ovarian cancer has few symptoms early in its course, the majority of patients are diagnosed with late stages (III and IV) of the disease. The 5-year survival rate is generally less than 20% for patients with advanced-stage disease despite therapeutic advances, whereas survival rate for patients with stage I or II disease is greater than 80% for the same period [2]. Although current chemotherapeutics demonstrate a more than 90% complete response rate in early-stage tumors, only a 20–30% partial response rate is observed in advanced stage tumors as well as in chemo-resistant relapsed tumors [3]. A better understanding of the molecular changes of ovarian carcinogenesis may lead to better therapeutic strategies for this deadly disease.
An emerging hypothesis states that cancer arises from a small population of self-renewing cancer initiating cells (CIC) [4]. These CICs are thought to possess tumorigenic potential and enhanced drug resistance within a tumor, and are able to repopulate tumor colonies in vivo. We have previously isolated ovarian CICs
(OCICs) from ovarian cancer patients [5]. These OCICs exhibit increased drug resistance towards cisplatin and taxol, and are characterized by the expression of several cell surface markers, including c-KIT (CD117, or stem cell factor receptor). However, the mechanism of how OCICs arise and how these cell surface markers are transcriptionally controlled are not fully understood.
Estrogen is an important regulator of growth and differentiation in normal ovaries [6] and is involved in the development of ovarian cancer [7]. In this regard, studies have explored the risk of ovarian cancer among women using hormone replacement therapy (HRT) in the treatment of menopausal symptoms [8,9,10]. For example, a study involving a million women suggested that women treated with HRT were associated with an increased risk of ovarian cancer [11]. However, the role of estrogen in ovarian carcinogenesis is not fully understood. Epigenetic modifications in the genome play a crucial role in transcriptional control and aberrant epigenetic modification is now considered a hallmark of cancer [12]. Epigenetic modifications are responsible for controlling gene expressions that allow for specific phenotypes [13,14]. Among them, DNA methylation is one of the most characterized epigenetic modification which takes place at the 59position of cytosine in CpG dinucleotides resulting in the
formation of 5-methylcytosine. DNA methylation which occurs at the clusters of CpG sites (called CpG islands) in the promoter region of a tumor suppressor gene
results in transcriptional repression and tumorigenesis in some cases [15]. Also considered as crucial regulators of gene expression, miRs are referred to as tumor suppressor-miRs if they regulate the expression of an oncogene [14]. Studies found that tumor suppressor-miRs are frequently down-regulated by genetic or epigenetic mechanisms leading to the up-regulation of oncogenes and acceleration of tumorigenesis [16]. For example, miR-34b/c (which resides at the promoter CpG island of a gene) was found to be epigenetically silenced by DNA methylation in metastatic cancer cells [17]. Re-expression of miR-34b/c suppressed cancer invasion in vitro andin vivo.
We are interested in miR-193a which is located at chromosome 17q11.2 and embedded in a CpG island. Studies have found that miR-193a was epigenetically silenced by promoter hypermethylation in acute myeloid leukemia (AML) and lung cancer [18,19]. Importantly, miR-193a targets the stem cell marker, c-KIT, for repression in AML [18,20]. Another experimentally confirmed target of miR-193a is E2F6 [21]. Up-regulation of E2F6 has been observed in breast cancer cells upon treatment with estrogen [22]. Within the E2F family of transcription factors which are involved in cell cycle control through transcriptional activation or repression [23], E2F6 was found to be a transcriptional repressor capable of associating with the histone-lysine N-methyltransferase EZH2, which is an important constituent of the polycomb complex [24,25], and with DNA methyl-transferase DNMT3b, allowing for its recruitment to the repressive complex [26].
As the role of miR-193a in ovarian cancer is currently unknown, we
hypothesize that E2F6 protein may suppress the expression of miR-193a, both directly as a DNA-binding transcriptional repressor and indirectly through promotion of the polycomb complex assembly. Indeed, the existence of the binding sites for E2F6 protein in the promoter of miR-193a as demonstrated by ENCODE ChIP-Seq data [27] seems to suggest that long-term suppression of miR-193a by E2F6 may lead to epigenetic silencing of miR-193a. These events may lead to the up-regulation of c-KIT and trigger the onset of the OCIC phenotype, thus promoting ovarian carcinogenesis. In this study, we use a mathematical model to explore the intricacies of this epigenetic control of miR-193a which could prove to be significant as it predicts a switching behavior in c-KIT that could be critical for ovarian carcinogenesis.
Materials and Methods
Cell culture
Cloning of miR-193a expressing vector
The sequences which transcribe miR-193a pre-miRNA was amplified by PCR using specific primers F: 59-CGCGGATCCAGTTTCTCGGCGCATAACTC-39and R: 59-CCCAAGCTTCGCTATTTCTCCAGCGAAGTG-39, using genomic DNA of IOSE cells which express miR-193a. The PCR products were ligated into yT&A Cloning Vector (Yeastern Biotech, Taiwan) for sequencing confirmation. miR-193a-yT&A was digested with BamH I and Hind III, and inserted into multiple cloning site of pSilencer4.1-CMV puro siRNA expression vector, which was
predigested with BamHI and HindIII.
Extraction of RNA and Quantitative RT-PCR
RNA extraction was performed using TRIzol reagent (Invitrogen Carlsbad, CA) according to the manufacturer’s protocol. To remove potential contaminating DNA from the complementary DNA, 1 mg of total RNA was treated with DNase I (Amplification Grade, Invitrogen) prior to reverse transcription. RNA was then reverse-transcribed using random primers (for c-KIT or E2F6 expression) or TaqMan reverse transcription kit (Applied Biosystems, Foster City, CA, USA). Quantitative real-time RT-PCR was then performed using ABI StepOne real-time PCR system (Applied Biosystems). Primers are available upon request. Relative expression of miR-193a, c-KIT and E2F6 was calculated using the comparative Ct method.
Results
miR-193a targets c-KIT and E2F6
To investigate the relationship between miR-193a and c-KIT/E2F6 in ovarian cancer (Fig. 1A), we over-expressed miR-193a in A2780 ovarian cancer cells which have low levels of miR-193a expression. Expression of miR-193a resulted in a significant down-regulation of c-KIT mRNA and E2F6 mRNA, thus suggesting that c-KIT mRNA and E2F6 mRNA are targets of miR-193a in ovarian cancer cells (Fig. 1B).
Model equations
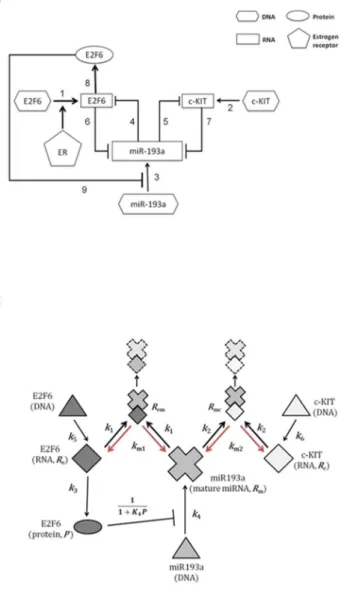
Interactions between the components of the miR-193a–E2F6–c-KIT regulatory module are shown in Fig. 2A. Tight coupling of network components and potential non-linear kinetics can give rise to complex system dynamics, which can be understood with the help of a mathematical model. In our kinetic model (Fig. 2B) there are six components, which represent: miR-193a (Rm), E2F6 mRNA
(Re), c-KIT mRNA (Rc), the complex of miR-193a with E2F6 mRNA (Rem),
complex of miR-193a with c-KIT mRNA (Rmc), and E2F6 protein (P). The
dRm
dt ~
k4
1zK4Pzkm1Remzkm2Rmc{k1ReRm{k2RcRm{dmRm, ð1Þ
dRe
dt ~k5zkm1Rem{k1ReRm{deRe, ð2Þ
Fig. 1. miR-193a repress E2F6 and c-KIT.(A) Schematic diagram of c-KIT and E2F6 mRNA showing predicted miR-193a binding site at their 39UTR. The detailed binding sequences (MREs) of these sites are also shown along with miRNA sequence alignments. (B) qPCR analysis of miR-193a, c-KIT and E2F6 in A2780 ovarian cancer cells. Overexpression of miR-193a in A2780 cells leads to down-regulation of c-KIT and E2F6 mRNAs.
dRc
dt ~k6zkm2Rmc{k2RcRm{dcRc, ð3Þ
dRem
dt ~k1ReRm{km1Rem{demRem, ð4Þ
Fig. 2. The proposed miR-193a regulatory network.(A) Activation of estrogen receptor (ER) signaling may increase the increase the transcription of E2F6 which may subsequently increase the expression of c-KIT through miR-193a mediated ceRNA mechanism. On the other hand, in addition to transcriptional repressor, E2F6 may lead to epigenetic silencing of the miR-193a promoter resulting in the up-regulation of c-KIT. The description for each number in the pathway is listed inS1 Table. (B) The biochemical interaction for this proposed miR-193a regulatory network. Model variables names for molecule species are also given.
dRmc
dt ~k2RcRm{km2Rmc{dmcRmc, ð5Þ
dP
dt ~k3Re{dpP: ð6Þ
Here, the association rate of miR-193a–E2F6 mRNA isk1 and association rate
of miR-193a–c-KIT mRNA is k2; the dissociation rate of complexes miR-193a–
E2F6 mRNA is km1and miR-193a–c-KIT mRNA is km2; the translation rate of
E2F6 protein is k3; the transcription rate of miR-193a is k4, of E2F6 mRNA isk5
and of c-KIT mRNA isk6; the degradation rate of miR-193a isdm, of E2F6 mRNA
isde, of c-KIT mRNA isdc, of miR-193a–E2F6 mRNA isdem, and of
miR-193a–c-KIT mRNA isdmcand the degradation rate of E2F6 protein isdp; and the strength
of the miR-193a transcription inhibition by E2F6 protein is denoted as K4.
The first term on the right-hand side of Eq. (1) corresponds to arrow 9 in
Fig. 2A expressing miR-193a transcription inhibition by, primarily, E2F6 protein, but also by polycomb complex proteins activity. The value of the parameterK4is
thus intended to account for both the direct transcription repression by E2F6 and for the long-term gene silencing performed by and dependent of the levels of EZH2 and DNMT3b. (The concentration of E2F6 is a variable of the dynamical model while levels of essential polycomb proteins, which are not explicitly present in model equations, are not subjects to regulation by the module and their levels are assumed constant at least at the module equilibration time scale.) The second (respectively, third) term on the right-hand side of Eq. (1) is the rate of miR-193a release from the complex with E2F6 mRNA (respectively, the complex with c-KIT mRNA). Interactions corresponding to arrows 6 and 7 in Fig. 2A, expressing hybrid mRNA complex formation, are given, respectively, by the fourth and the fifth term on the right-hand side of Eq. (1). The last term in Eq. (1) is a first-order miR-193a degradation term.
The rate of constitutive E2F6 gene transcription (arrow 1 inFig. 2A) is k5(Eq.
(2)). This rate depends on the level of hormonal stimulation and, as our model describes simplified regulation in ovarian cells, we will directly associate k5 with
the level of estrogen. The second term in Eq. (2) represents the release of E2F6 mRNA from the complex with miR-193a, whereas the third term is the rate of the opposite binding reaction. The last term in Eq. (2) is a degradation of E2F6 mRNA. The terms on the right-hand side of Eq. (3) are analogous. The first term in Eq. (4) is the rate for the binding of E2F6 mRNA and miR-193a. The second term in Eq. (4) stands for the opposite reaction, and the third term represents the degradation of Rem. The terms on the right-hand side of Eq. (5) are analogous.
Steady States
Steady states give the long-term behavior of the system. The steady states of system (1)–(6) can be obtained by equating the right-hand sides of the equations to zero. LetS5(Rm,Re,Rc,Rem,Rmc,P), be any steady state of system (1)–(6). The
steady state S satisfies the following equations
Re~
k5Ae
RmzdeAe, ð7Þ
Rc~
k6Ac
RmzdcAc, ð8Þ
Rem~
k1ReRm
km1zdem, ð9Þ
Rmc~
k2RcRm
km2zdmc, ð10Þ
P~
Mk5Ae
RmzdeAe, ð11Þ
k4~h Rð mÞ, ð12Þ
where
Ae~
km1zdem
k1dem ,Ac~
km2zdmc
k2dmc ,M~
k3
dP,
and
h Rð mÞ~ dmRmz
k5Rm
RmzdeAe z
k6Rm
RmzdcAc
R
mzðdezK4k5MÞAe
RmzdeAe : ð13Þ
We note that onceRmis determined by Eq. (12), then the other components of
the steady stateScan be determined by Eqs. (7)–(11). Hence the condition for the
existence of the steady stateSis thatk4lies inh[0,‘), the range of the functionh.
We are interested in threshold or switching behavior of system (1)–(6),
k5zk6w
dmdeðkm1zkemÞ
k1dem ð14Þ
dP
k3K4vk5
km1zdem
k1dem maxx§0
l xð Þ
: ð15Þ
wheremax x§0
l xð Þis the maximal value ofl xð Þon the interval [0,‘), andl xð Þis given
by
l xð Þ:~ 1
xzdeAe
dmzx k5 zdeAez
k6 xzdcAc
dmz k5deAe
xzdeAe
ð Þ2z
k6dcAc xzdcAc
ð Þ2 :
x
xzdeAe {1
0
@
1
A:
The proof for the criterion (14)–(15) is given in theS1 Text.
The Steady State Bifurcation Diagram in the (
k
5,
R
c) plane
In view of Eqs. (7)–(8), the steady states of Re and Rc increase or decrease in the
same direction. This model prediction is consistent with the ceRNA hypothesis [28,29] that the expression of E2F6 positively correlates with that of c-KIT.
As mentioned before,k5is an experimentally controllable parameter associated
with the addition of hormones (e.g., estrogen), and K4 is a measure of the
inhibition efficiency of, primarily, E2F6 protein against miR-193a. As we will see in the discussion below, the interplay between k5 and K4 can generate an
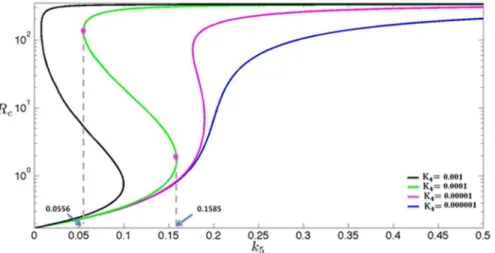
over-expression of c-KIT mRNA. Hence, it would be interesting to see the dependence of the steady state on the parameterk5for different values ofK4– this is shown in
Fig. 3. This diagram is referred to as a ‘‘steady-state bifurcation diagrams’’, andk5
is referred to as a bifurcation parameter. To generate experimental curves similar to those shown inFig. 3, one can design an experiment in which cells are cultured at different concentrations of estrogen, and then measure the long-term mRNA levels.
With parameters satisfying Eq. (14)–(15), the model predicts that there is a range of k5 for which the system admits three coexisting steady states. For
instance, forK450.0001 (i.e., a lower inhibition efficiency;Fig. 3, green line) and k5is between 0.0556 and 0.1585, the model gives three steady states (out of which
the high Rc and the low Rc states are stable; see the curve associated with K450.0001 in Fig. 3). The importance of the right knee in a steady-state
bifurcation diagram lies in the following fact: as the control parameter k5 is
increased from the low value up through the critical value k5Rassociated with the
right knee, the corresponding steady state level of Rc will increase and, due to the
and then stay on the upper branch (see Fig. 3). There is a sharp difference in c-KIT mRNA levels between the steady states ofRcon the lower and upper branches
in the steady-state bifurcation diagram, which would suggest cancer phenotype-promoting over-expression of c-KIT mRNA fork5.k5R. On the other hand, if one
is initially at the steady state on the upper branch which is associated with the over expression of c-KIT mRNA, one can decrease the k5 value to reduce the steady
state level of Rc. Moreover, if one continues to decrease thek5 value below the
critical value k5Lassociated with the left knee, then the corresponding steady state
level of Rc will decrease and, due to the instability (respectively, stability) of the
steady states on the middle branch (respectively, the lower branch) in the steady-state bifurcation diagram, the system will descend to the steady steady-state on the lower branch at the critical value k5L(seeFig. 3). This would recover the normal c-KIT
mRNA level.
To summarize, the model predicts that there exists a threshold valuek5R
(respectively, k5L) in the transcriptional ratek5 for cells to turn on (respectively,
turn off) the expression of OCIC marker c-KIT. Hence, it is important to adjust the transcriptional rate k5 to affect the expression of OCIC marker c-KIT.
Significance of the Parameter
K
4Although decreasing the value of k5 (associated with low estrogen level) can
reduce the expression of the OCIC marker c-KIT, some clinical evidence suggests that anti-estrogen therapy is only partially effective in the treatment of ovarian cancer [30,31]. The model suggests that this might be due to the inhibition of miR-193a expression by E2F6 protein as reflected in the value of the parameterK4
of the first term on the right-hand side of Eq. (1). This term is motivated by the fact that the expression of miR-193a depends on the transcriptional suppressive
Fig. 3. Steady-state bifurcation diagrams.The dependence of the steady states of variableRc(RNA level of c-KIT) on parameterk5(transcription rate of E2F6) for difference values of the parameterK4(inhibition efficiency of E2F6). The value of parameters are listed inS2 Text.
activity of E2F6 protein (associated with the level of EZH2 and DNMTs). In particular, sufficiently strong inhibition (sufficiently large K4) would lead to a
more long-term silencing of the expression of miR-193a by DNA methylation (see Eq. (1)), and thus would entail the over-expression of c-KIT mRNA; whereas for the extreme case K450, the system (1)–(6) can only support at most one steady
state (seeS1 Text), which implies the non-existence of the right and left knees in the steady state diagram and loss of the bistable switch.
Letk5bdenote the basal transcription rate constant of E2F6 mRNA. In the
following, depending on the interplay between thek5bandK4, we will describe two
scenarios in which the second one would correspond to the clinical observation that anti-estrogen therapy are only partially effective in the treatment of ovarian cancer [30,31].
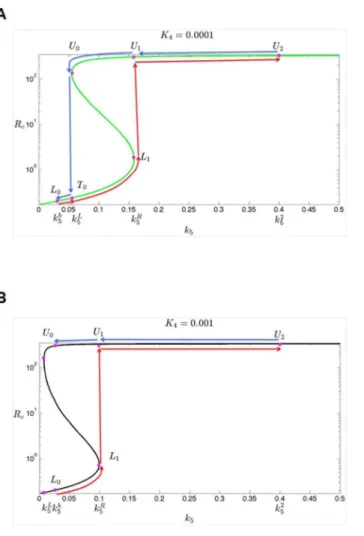
In cells with low inhibition efficiency of E2F6 (i.e., a lowerK4), as the parameter k5is increased fromk5btok52(red solid line inFig. 4A), the steady state ofRcwill
first move from L0to L1 via the lower branch, and, due to the instability of the
steady states in the middle branch, switch fromL1toU1in the upper branch, and
finally move along the upper branch toU2. On the other hand, as the parameterk5
is decreased fromk52 tok5b(blue solid line inFig. 4A), the steady state ofRcwill
first move fromU2to U0 via the upper branch, and, due to the instability of the
steady states in the middle branch, then switch fromU0toT0in the lower branch,
and finally move back to L0. Hence for low inhibition efficiency of E2F6 (i.e., low K4) and small basal rate constant (i.e., smallk5b), addition of estrogen may turn
on over-expression of c-KIT mRNA, whereas retraction of estrogen can turn off over-expression of c-KIT mRNA and make the cells recover the normal c-KIT mRNA level.
In cells with high inhibition efficiency of E2F6 (i.e., a higherK4), as the
parameterk5is increased fromk5btok52(red solid line inFig. 4B), the steady state
ofRcwill first move fromL0toL1via the lower branch, and, due to the instability
of the steady states in the middle branch, switch from L1 to U1 in the upper
branch, and finally move along the upper branch toU2. On the other hand, as the
parameter k5 is decreased from k52 to k5b(blue solid line in Fig. 4B), the steady
state ofRcwill first move fromU2toU0via the upper branch, and, due to the fact
that k5b is the basal transcription rate constant of E2F6 mRNA and k5bis larger
than thek5component of left-knee point, then has to stop atU0which is the state
associated with over-expression of c-KIT mRNA. Hence for high inhibition efficiency of E2F6 (i.e., a higherK4) and large basal rate constant (i.e., largek5b),
retraction of estrogen cannot attenuate the expression of c-KIT mRNA. We make one important observation: for sufficiently large K4, thek5 value associated with
the left knee is very close to zero. Hence for sufficiently large K4, it would fit the
scenario discussed in this paragraph. This suggests that for sufficiently large K4,
Validation of the model in TCGA ovarian cancer dataset
In light of the above model, we reasoned that in ovarian cancer patients with low EZH2 (i.e., low K4), increase of E2F6 mRNA (which results from an increase of
transcription rate of E2F6, k5) may induce the expression of c-KIT mRNA (Rc),
through miR-193a-mediated ceRNA mechanism. However, such correlation may not exist in patients with high EZH2 (i.e., high inhibition constant of E2F6 to miR-193a, K4) as miR-193 is epigenetically silenced. To provide an independent
support for this hypothesis, we analyzed the expression microarray data in TCGA ovarian cancer dataset [32]. Interestingly, ovarian cancer patients with low EZH2 level show a positive correlation between the expression of E2F6 and c-KIT (Fig. 5A). Analysis of another set of microarray data in ovarian cancer (GDS2785) also demonstrated a similar phenomenon (S1 Fig.). However, such relationship is not observed in patients with high EZH2 (Fig. 5B and S1 Fig.) or in the
Fig. 4. Steady-state bifurcation diagrams.The dependence of the steady states of variableRc(RNA level of c-KIT) on parameterk5(transcription rate of E2F6) for different values ofK4: (A)K450.1 (i.e., low inhibition efficiency of E2F6), (B)K451 (i.e., high inhibition efficiency of E2F6). The red and blue arrow line indicates abrupt shifts of the steady state ofRcwith at differentk5values which indicated below. The value of
parameters are listed inS2 Text.
Fig. 5. Correlation between expression level of E2F6 and c-KIT in expression microarray dataset from TCGA ovarian cancer patients.Expression microarray data from 568 ovarian cancer patients are sorted according to the expression level of EZH2. The scatter plot demonstrates the correlation between expression level of E2F6 and c-KIT in ovarian cancer patients with (A) low EZH2 (bottom 12.5%) and (B) high EZH2 (top 12.5%). The R and P-value of the Pearson correlation are shown. Interestingly, as predicted by our model, patients with low EZH2 shows a positive correlation of E2F6 and c-KIT (A, R50.322, P,0.005). Such correlation is not observed in patients with high EZH2 (B, R50.2148. P.0.05). However, patients with high EZH2 can be further separated into 2 sub-groups based on the median value of c-KIT (high, red color; low, blue color). Neither of these sub-groups demonstrates a positive correlation between E2F6 and c-KIT.
correlation between E2F6 and a non-miR-193a target (S2 Fig.). Taken together, this phenomenon is consistent with our prediction (Fig. 3) that mRNA of E2F6 and c-KIT demonstrates a ceRNA relationship at low K4.
Discussion
Our mathematical model postulates the existence of a bimodal epigenetic control of miR-193a in ovarian carcinogenesis. In cells with low inhibition efficiency of E2F6, there is a ,linear relationship between transcription of E2F6 and c-KIT mRNA, thus suggesting a ceRNA relationship between these 2 genes. In this ceRNA hypothesis [28,29], the 39UTRs of several mRNAs contain the miR-binding element(s) (MRE) and therefore compete for miR-binding with the miR. Theoretically, a miR can be epigenetically controlled by both promoter hypermethylation and its ceRNA in a bimodal fashion.
It is also noteworthy to point out that this ceRNA relationship is a reversible event, such that retraction of estrogen which results in lower expression of E2F6, may reduce the expression of c-KIT (Fig. 6, upper panel). Such phenomenon can be observed in normal ovarian epithelial cells or ovarian cancer cells in which the E2F6 inhibition efficiency is low. Indeed, components of transcriptional
repressors such as EZH2 which is required for transcriptional suppression of E2F6 is found to be low in normal ovarian cells and a sub-set of ovarian cancer [33,34].
Fig. 6. Proposed model for ovarian carcinogenesis.Under the condition of low EZH2 and DNMT3b expression (upper panel, as indicated by light blue and red color), E2F6 only leads to a minimal suppression of miR-193a (i.e., lowK4) and the relationship between E2F6 and c-KIT exhibits a ceRNA relationship. As a result, the amount of c-KIT in the ovarian cancer cells depends on the amount of estrogen (this information is mediated by the level of E2F6). On the contrary, under the condition of high expression level of EZH2 and DNMT3b (lower panel, as indicated by dark blue and red color), E2F6 exerts a high inhibition efficiency (i.e., highK4). Slight increment of E2F6 results in the epigenetic silencing of miR-193a and subsequently an over-expression of c-KIT. Without miR-193a, the cells may be ‘‘locked’’ in a high c-KIT state resulting in ovarian carcinogenesis.
Importantly, this is also consistent with the clinical evidence that the expression of E2F6 and c-KIT are correlated in ovarian cancer patients with low expression of EZH2 but not in cases of high EZH2 expression.
However, in cells with high inhibition efficiency of E2F6, our model predicts a highly non-linear relationship between expression of E2F6 and c-KIT. Under the condition of low expression level of E2F6, there follows a ceRNA relationship between E2F6 and c-KIT. However, at high expression of E2F6 together with high expression of transcriptional repressor such as EZH2, E2F6 may lead to epigenetic silencing of the expression of miR-193a through trimethylated H3K27 and DNA methylation (Fig. 6, lower panel). Taken together, these mechanisms may lead to a non-reversible expression of c-KIT and activation of the cell growth signaling in ovarian cancer [35]. This prediction is also consistent with the previous findings that high expression of EZH2 is associated with poor survival in ovarian cancer patients [34]. Inhibition of the EZH2 activity together with anti-estrogen therapy may therefore be effective against ovarian cancer.
In summary, due to the nonlinearities and non-intuitive dynamics of the bimodal regulation of miR-193a, we developed a mathematical model that predicts c-KIT switching behavior. Importantly, a positive correlation of E2F6 and c-KIT is only observed in ovarian cancer patients with low EZH2 expression. Combination treatment of EZH2 inhibitor together with anti-estrogen therapy may be a novel strategy against ovarian cancer.
Supporting Information
S1 Fig. Correlation between expression level of E2F6 and c-KIT in expression microarray dataset from ovarian cancer patients (GDS2785).Scatter plot shows the correlation between expression level of E2F6 mRNA and c-KIT in ovarian cancer patients with (A) low EZH2 (n516) or (B) high EZH2 (n517) according to the median level of EZH2 expression. The R and P-value of the Pearson correlation are also shown. Although not statistically significant, a more positive correlation between expression of c-KIT and EZH2 were observed in patients with low EZH2 (R50.3516, P50.0766) than that of patients with high EZH2
(R50.2938, P50.1729).
doi:10.1371/journal.pone.0116050.s001 (TIF)
S2 Fig. Correlation between expression level of E2F6 and CDK5 in expression microarray dataset from TCGA ovarian cancer patients. To examine if the observation in S1 Fig. is a random event, we analyzed the correlation between expression level of E2F6 and CDK5, a non-miR-193a target in ovarian cancer patients with (A) low EZH2 (bottom 12.5%) and (B) high EZH2 (top 12.5%) as demonstrated in S1 Fig. Positive correlation is not observed in these 2 group of patients (p.0.05).
doi:10.1371/journal.pone.0116050.s002 (TIF)
S1 Text. The existence of steady states. doi:10.1371/journal.pone.0116050.s004 (PDF)
S2 Text. The values of parameters in Fig. 3 andFig. 4. doi:10.1371/journal.pone.0116050.s005 (PDF)
Acknowledgments
The authors would like to thank Dr. Yu-Fen Huang and Dr. Jia-Chiun Pan for the assistance in statistical calculation. Co-authors J.-C. Tsai and T.-W. Hwang would like to thank Prof. Ching-An Wang for many years of encouragement in the study of interdisciplinary subjects. Part of this work was carried out during the visit of co-author B.D. Aguda at the National Center for Theoretical Sciences, Taiwan.
Author Contributions
Conceived and designed the experiments: BDA JCT TWH KPN HCL MWYC. Performed the experiments: FHCC JMJL MK GCWC. Analyzed the data: FHCC BDA JCT MK HCL KPN TWH MWYC. Contributed reagents/materials/analysis tools: JCT MK TWH. Wrote the paper: FHCC BDA JCT MK KPN TWH MWYC.
References
1. Siegel R, Ma J, Zou Z, Jemal A(2014) Cancer statistics, 2014. CA Cancer J Clin 64: 9–29. 2. Nossov V, Amneus M, Su F, Lang J, Janco JM, et al.(2008) The early detection of ovarian cancer:
from traditional methods to proteomics. Can we really do better than serum CA-125? Am J Obstet Gynecol 199: 215–223.
3. Fung-Kee-Fung M, Oliver T, Elit L, Oza A, Hirte HW, et al.(2007) Optimal chemotherapy treatment for women with recurrent ovarian cancer. Curr Oncol 14: 195–208.
4. Visvader JE, Lindeman GJ (2008) Cancer stem cells in solid tumours: accumulating evidence and unresolved questions. Nat Rev Cancer 8: 755–768.
5. Zhang S, Balch C, Chan MW, Lai HC, Matei D, et al. (2008) Identification and characterization of ovarian cancer-initiating cells from primary human tumors. Cancer Res 68: 4311–4320.
6. Auersperg N, Wong AS, Choi KC, Kang SK, Leung PC(2001) Ovarian surface epithelium: biology, endocrinology, and pathology. Endocr Rev 22: 255–288.
7. Cunat S, Hoffmann P, Pujol P(2004) Estrogens and epithelial ovarian cancer. Gynecol Oncol 94: 25– 32.
8. Weiss NS, Lyon JL, Krishnamurthy S, Dietert SE, Liff JM, et al.(1982) Noncontraceptive estrogen use and the occurrence of ovarian cancer. J Natl Cancer Inst 68: 95–98.
9. Lacey JV Jr, Brinton LA, Leitzmann MF, Mouw T, Hollenbeck A, et al.(2006) Menopausal hormone therapy and ovarian cancer risk in the National Institutes of Health-AARP Diet and Health Study Cohort. J Natl Cancer Inst 98: 1397–1405.
10. Glud E, Kjaer SK, Thomsen BL, Hogdall C, Christensen L, et al.(2004) Hormone therapy and the impact of estrogen intake on the risk of ovarian cancer. Arch Intern Med 164: 2253–2259.
11. Beral V, Bull D, Green J, Reeves G(2007) Ovarian cancer and hormone replacement therapy in the Million Women Study. Lancet 369: 1703–1710.
13. Jones PA, Baylin SB(2002) The fundamental role of epigenetic events in cancer. Nat Rev Genet 3: 415–428.
14. Esquela-Kerscher A, Slack FJ(2006) Oncomirs - microRNAs with a role in cancer. Nat Rev Cancer 6: 259–269.
15. Esteller M (2007) Cancer epigenomics: DNA methylomes and histone-modification maps. Nat Rev Genet 8: 286–298.
16. Garzon R, Marcucci G, Croce CM(2010) Targeting microRNAs in cancer: rationale, strategies and challenges. Nat Rev Drug Discov 9: 775–789.
17. Lujambio A, Calin GA, Villanueva A, Ropero S, Sanchez-Cespedes M, et al.(2008) A microRNA DNA methylation signature for human cancer metastasis. Proc Natl Acad Sci U S A 105: 13556–13561. 18. Gao XN, Lin J, Li YH, Gao L, Wang XR, et al.(2011) MicroRNA-193a represses c-kit expression and functions as a methylation-silenced tumor suppressor in acute myeloid leukemia. Oncogene 30: 3416– 3428.
19. Heller G, Weinzierl M, Noll C, Babinsky V, Ziegler B, et al.(2012) Genome-wide miRNA expression profiling identifies miR-9-3 and miR-193a as targets for DNA methylation in non-small cell lung cancers. Clin Cancer Res 18: 1619–1629.
20. Li Y, Gao L, Luo X, Wang L, Gao X, et al.(2013) Epigenetic silencing of microRNA-193a contributes to leukemogenesis in t(8;21) acute myeloid leukemia by activating the PTEN/PI3K signal pathway. Blood 121: 499–509.
21. Kozaki K, Imoto I, Mogi S, Omura K, Inazawa J(2008) Exploration of tumor-suppressive microRNAs silenced by DNA hypermethylation in oral cancer. Cancer Res 68: 2094–2105.
22. Carroll JS, Meyer CA, Song J, Li W, Geistlinger TR, et al.(2006) Genome-wide analysis of estrogen receptor binding sites. Nat Genet 38: 1289–1297.
23. Chen HZ, Tsai SY, Leone G(2009) Emerging roles of E2Fs in cancer: an exit from cell cycle control. Nat Rev Cancer 9: 785–797.
24. Trimarchi JM, Fairchild B, Wen J, Lees JA(2001) The E2F6 transcription factor is a component of the mammalian Bmi1-containing polycomb complex. Proc Natl Acad Sci U S A 98: 1519–1524.
25. Attwooll C, Oddi S, Cartwright P, Prosperini E, Agger K, et al. (2005) A novel repressive E2F6 complex containing the polycomb group protein, EPC1, that interacts with EZH2 in a proliferation-specific manner. J Biol Chem 280: 1199–1208.
26. Velasco G, Hube F, Rollin J, Neuillet D, Philippe C, et al.(2010) Dnmt3b recruitment through E2F6 transcriptional repressor mediates germ-line gene silencing in murine somatic tissues. Proc Natl Acad Sci U S A 107: 9281–9286.
27. Gerstein MB, Kundaje A, Hariharan M, Landt SG, Yan KK, et al.(2012) Architecture of the human regulatory network derived from ENCODE data. Nature 489: 91–100.
28. Salmena L, Poliseno L, Tay Y, Kats L, Pandolfi PP(2011) A ceRNA hypothesis: the Rosetta Stone of a hidden RNA language? Cell 146: 353–358.
29. Poliseno L, Salmena L, Zhang J, Carver B, Haveman WJ, et al.(2010) A coding-independent function of gene and pseudogene mRNAs regulates tumour biology. Nature 465: 1033–1038.
30. Makar AP(2000) Hormone therapy in epithelial ovarian cancer. Endocr Relat Cancer 7: 85–93. 31. Smyth JF, Gourley C, Walker G, MacKean MJ, Stevenson A, et al.(2007) Antiestrogen therapy is
active in selected ovarian cancer cases: the use of letrozole in estrogen receptor-positive patients. Clin Cancer Res 13: 3617–3622.
32. Network TR(2011) Integrated genomic analyses of ovarian carcinoma. Nature 474: 609–615. 33. Li H, Cai Q, Godwin AK, Zhang R(2010) Enhancer of zeste homolog 2 promotes the proliferation and
invasion of epithelial ovarian cancer cells. Mol Cancer Res 8: 1610–1618.
34. Lu C, Han HD, Mangala LS, Ali-Fehmi R, Newton CS, et al.(2010) Regulation of tumor angiogenesis by EZH2. Cancer Cell 18: 185–197.