Glioma-Associated Microglia/Macrophages
Display an Expression Profile Different from
M1 and M2 Polarization and Highly Express
Gpnmb
and
Spp1
Frank Szulzewsky1, Andreas Pelz1,2, Xi Feng3, Michael Synowitz1,5, Darko Markovic1,6, Thomas Langmann7, Inge R. Holtman8, Xi Wang1, Bart J. L. Eggen8, Hendrikus W. G. M. Boddeke8, Dolores Hambardzumyan3,4, Susanne A. Wolf1‡,
Helmut Kettenmann1*‡
1Max-Delbrueck-Center for Molecular Medicine, Berlin, Germany,2Department of Experimental
Neurology, Charité–University Medicine Berlin, Berlin, Germany,3Department of Neurosciences, Cleveland Clinic, Cleveland, Ohio, United States of America,4Department of Molecular Medicine, Cleveland Clinic Lerner College of Medicine, Case Western Reserve University, Cleveland, Ohio, United States of America, 5Department of Neurosurgery, Charité–Universitätsmedizin Berlin, Berlin, Germany,6Department of Neurosurgery, Helios Clinics, Berlin, Germany,7Department of Ophthalmology, University of Cologne, Cologne, Germany,8Department of Neuroscience, Section Medical Physiology, University of Groningen, University Medical Center Groningen, Groningen, The Netherlands
‡These authors contributed equally to this work. *[email protected]
Abstract
Malignant glioma belong to the most aggressive neoplasms in humans with no successful treatment available. Patients suffering from glioblastoma multiforme (GBM), the highest-grade glioma, have an average survival time of only around one year after diagnosis. Both microglia and peripheral macrophages/monocytes accumulate within and around glioma, but fail to exert effective anti-tumor activity and even support tumor growth. Here we use mi-croarray analysis to compare the expression profiles of glioma-associated microglia/macro-phages and naive control cells. Samples were generated from CD11b+MACS-isolated cells from naïve and GL261-implanted C57BL/6 mouse brains. Around 1000 genes were more than 2-fold up- or downregulated in glioma-associated microglia/macrophages when com-pared to control cells. A comparison with published data sets of M1, M2a,b,c-polarized mac-rophages revealed a gene expression pattern that has only partial overlap with any of the M1 or M2 gene expression patterns. Samples for the qRT-PCR validation of selected M1 and M2a,b,c-specific genes were generated from two different glioma mouse models and isolated by flow cytometry to distinguish between resident microglia and invading macro-phages. We confirmed in both models the unique glioma-associated microglia/macrophage phenotype including a mixture of M1 and M2a,b,c-specific genes. To validate the expres-sion of these genes in human we MACS-isolated CD11b+microglia/macrophages from GBM, lower grade brain tumors and control specimens. Apart from the M1/M2 gene analy-sis, we demonstrate that the expression ofGpnmbandSpp1is highly upregulated in both murine and human glioma-associated microglia/macrophages. High expression of these
OPEN ACCESS
Citation:Szulzewsky F, Pelz A, Feng X, Synowitz M,
Markovic D, Langmann T, et al. (2015) Glioma-Associated Microglia/Macrophages Display an Expression Profile Different from M1 and M2 Polarization and Highly ExpressGpnmbandSpp1. PLoS ONE 10(2): e0116644. doi:10.1371/journal. pone.0116644
Academic Editor:Jeffrey K. Harrison, University of
Florida, UNITED STATES
Received:June 28, 2014
Accepted:December 11, 2014
Published:February 6, 2015
Copyright:This is an open access article, free of all
copyright, and may be freely reproduced, distributed, transmitted, modified, built upon, or otherwise used by anyone for any lawful purpose. The work is made available under theCreative Commons CC0public domain dedication.
Data Availability Statement:All data sets are
available at (http://www.ebi.ac.uk/arrayexpress) under the accession number E-MTAB-2660. All other relevant data are within the paper and its Supporting Information files.
Funding:This work was supported by the Deutsche
genes has been associated with poor prognosis in human GBM, as indicated by patient sur-vival data linked to gene expression data. We also show that microglia/macrophages are the predominant source of these transcripts in murine and human GBM. Our findings pro-vide new potential targets for future anti-glioma therapy.
Introduction
Malignant glioma (WHO grade III and IV), such as glioblastoma multiforme (GBM), are high-ly aggressive and account for almost 50% of all brain neoplasms. As of today no successful treatment exists, offering glioma patients an average survival time of about one year after diag-nosis, despite surgical tumor resection, radio-, and chemotherapy [1]. Glioma are highly inva-sive and the cellular and genetic inter- and intra-tumor heterogeneity has lead to the failure of current anti-glioma therapy [2,3,4,5].
Among other immune cells, brain-resident microglia and peripheral macrophages/mono-cytes are attracted toward glioma in large numbers and they can amount up to 30% of the cells in the tumor tissue [6,7,8]. Experimental findings by us and others show that a tumoricidal ac-tivity of glioma-associated microglia/macrophages (GAMs) is counteracted by the glioma cells, which reprogram GAMs into tumor supportive cells. GAMs actively support tumor growth, e.g. by secreting matrix-degrading enzymes as well as immunosuppressive factors [9,10,11,12]. Thus, these stromal cells might serve as an attractive target for anti-glioma therapy and the identification of factors produced by GAMs might help to better understand disease progres-sion [11,13,14,15,16].
Based onin vitroactivation states macrophage polarization is divided into classical inflam-matory (M1) activation (responsible for Th1 responses, type I inflammation, killing of intracel-lular pathogens) and alternative (M2) activation. Alternative activation can be further divided into M2a (Th2 responses, type II inflammation, killing of pathogens, allergy), M2b (Th2 activa-tion, immunoregulation), and M2c (immunoregulaactiva-tion, matrix deposiactiva-tion, tissue remodeling) activation [17]. Although the definition of these pure activation states is based on definedin vitroconditions, and macrophage activation is likely to be much more diverse and complex in thein vivosetting, several studies have addressed the expression of polarization marker genes in GAMs, eitherin vitroorin vivo[9,13,18,19]. Similar to solid tumors in other organs, GAMs produce factors associated with an alternative macrophage activation, such as increased pro-duction of anti-inflammatory molecules (e.g. TGF-β1, ARG1, and IL-10), and molecules sup-porting tissue remodeling and angiogenesis (e.g. VEGF, MMP2, MMP9, and MT1-MMP). However, GAMs also produce pro-inflammatory molecules (e.g. TNF-α, IL1-β, and CXCL10) [9,10,11,18,20,21]. To date no comprehensive comparison of GAMs expression pattern with M1, M2a,b,c macrophages has been performed. In this study, we isolated CD11b+cells from GL261 mouse gliomas and naïve control mice and performed a genome-wide microarray ex-pression analysis. We compared the GAMs exex-pression profile to datasets of M1, M2a, M2b, and M2cin vitro-stimulated macrophages. Using flow cytometry to distinguish between resi-dent microglia and invading macrophages/monocytes, we investigated the expression of select-ed genes in resident and invading GAMs in two different glioma mouse models by qRT-PCR. To show the relevance for potential therapeutic applications, we investigated some key genes in CD11b+GAMs isolated from human GBM samples compared to cells isolated from lower grade brain tumors, control microglia, and CD11b-cells in GBM. Last, we used the The Cancer
Competing Interests:The authors have declared
Genome Atlas (TCGA) database for glioma-patient survival data linked to gene expression data.
Materials and Methods
Ethics statement
This study was carried out in strict accordance with the recommendations in the Guide for the Care and Use of Laboratory Animals of the National Institutes of Health. This study was ap-proved by the local ethics committees for animal experiments: the Institutional Animal Care and Use Committees of Cleveland Clinic, Lerner Research Institute–approved protocol num-ber 2013-1029 (LRI, last approved June 25 2013) and the Committee on the Ethics of Animal Experiments in Berlin (LaGeSo, Permit Numbers: GO 268-10, GO 343-10, GO 438-12). All surgery was performed under anesthesia, and all efforts were made to minimize suffering.
Freshly resected patient samples were provided by the Department for Neurosurgery Char-ité University Hospital and the Helios Clinics (both Berlin, Germany). Handling and analysis of these tissues was performed according to the rules and with the approval of the Ethical Committee and with patient’s written consents (Ethics Committee:“Ethikkommission der Charité—Universitätsmedizin Berlin”, application number: EA4/098/11).
Animals
Allin vivowork with GL261 glioma cells was done in C57BL/6 wild-type mice (Charles River Laboratories, Wilmington, MA, USA). Age matched naïve C57BL/6 wild-type mice were used as controls.
To broaden the relevance of our findings, we employed another murine model where the tumor is initiated by the overexpression of PDGFb inNestin-expressing cellsin vivo:Ntv-a/
Ink4a-Arf-/-mice develop pro-neural high-grade gliomas 6 to 8 weeks following intracranial injection of RCAS-PDGFb-producing DF-1 chicken fibroblast cells at 4.5 to 10 weeks of age [22]. The genetic backgrounds of tv-a mice are FVB/N, C57BL/6, BALB/C, and tv-a. RCAS-PDGFb tumors were dissociated as described below and intracranially re-transplanted into
Cx3cr1GFP/wtCcr2RFP/wtmice (kind gift of Richard Ransohoff, [23]) to distinguish between microglia and peripheral monocytes that invaded the brain. Naïve age-matchedCx3cr1GFP/wt Ccr2RFP/wtmice were used as controls. 5 to 7 weeks after intracranial injection of RCAS tumor cells intoCx3cr1GFP/wtCcr2RFP/wtmice these mice develop tumors that are histologically identi-cal to the original tumors inNtv-a/Ink4a-Arf-/-mice.
Generation of intracranial mouse gliomas
Injections were performed using a stereotactic frame (Stoelting, Wood Dale, IL, USA). Mice used for these experiments were 8 to 10-week-old (C57BL/6 mice for GL261 injection), 4.5 to 10-week-old (Ntv-a/Ink4a-Arf-/-mice for DF-1 RCAS-PDGFb injection), or 6–10-week-old (Cx3cr1GFP/wtCcr2RFP/wtmice for RCAS-PDGFb tumor cell re-implantation). Mice were anes-thetized with intraperitoneal injections of ketamine (0.1 mg/g, Pharmazeutischen Handelsge-sellschaft, Garbsen, Germany) and xylazine (0.02 mg/g, Bayer, Leverkusen, Germany). Animals were also provided 0.25% Marcaine in the volume of about 0.1ml/25g administered right before the surgery, which provided pain relief from the sutures for 6–8 hours.
dural surface. Coordinates for injections of DF-1 cells, and RCAS-PDGFb tumor cells into Ntv-a/Ink4a-Arf-/-mice, andCx3cr1GFP/wtCcr2RFP/wtmice, respectively were bregma 1.5 mm ante-rior, Lat -0.5 mm, and a depth 2.0 mm. Mice were monitored daily for the first two weeks and twice a day starting from day 15 post-injection for symptoms of tumor development (lethargy, hydrocephalus, head tilting). The size of resulting tumors ranged from 1.5–2.5 mm (GL261 tu-mors) and 2.5–3.5 mm (RCAS-PDGFb tutu-mors).
Cultivation of Cell Lines
Cells of the murine GL261 glioma cell line (National Cancer Institute, MD, USA) were grown in Dulbecco’s modified Eagle’s medium (DMEM) with 10% fetal calf serum (FCS), 200 mM glutamine, 100 U/mL penicillin, and 100 mg/ml streptomycin (all from Invitrogen, Carlsbad, CA, USA). DF-1 cells were purchased from ATCC (Manassas, VA, USA). Cells were grown at 39°C according to ATCC instructions. Transfections with RCAS-PDGFb were performed using Fugene 6 transfection kit (no. 11814443001; Roche, Mannheim, Germany) according to manufacturer’s protocol.
Tumorsphere Culture
RCAS-PDGFb tumors were excised from tumor brains using a scalpel, minced, and incubated with Accutase (eBioscience, San Diego, CA, USA) for 15 minutes at 37°C. Tissue pieces were mechanically dissociated using a 1 ml pipette and washed in Dulbecco modified Eagle medium (DMEM; Sigma-Aldrich, St. Louis, MO, USA). Cells were passed through a 70μm cell strainer
and seeded into a T25 cell culture flask. Cells were grown in GIC medium containing DMEM-F12 GlutaMAX (GIBCO-Invitrogen, Carlsbad, CA, USA), 1% penicillin G/streptomycin sulfate (Aldrich), B-27 without vitamin A (1:50; GIBCO-Invitrogen), HEPES (0.2 mM, Sigma-Aldrich), insulin (20 ng/ml, Sigma-Sigma-Aldrich), supplemented with fibroblast growth factor 2 (FGF2, 20 ng/ml, Cell Systems, Kirkland, WA, USA) and epidermal growth factor (EGF, 20 ng/ml, Cell Systems).
Human tissue
Tumor and control tissue was taken during surgery while patients were under a general anes-thetic, and was placed immediately in culture medium for transportation. Cells were isolated from the tissue as described below no later than 2 hours after resection. Cell sorting was per-formed via MACS isolation, using anti-CD11b microbeads (described below).
Cell Isolation
GL261-implanted mice were sacrificed 20 days post-injection, RCAS-PDGFb-implanted mice were sacrificed 4–5 weeks post-injection. Tumor-bearing and control mice were euthanized by i.p. injection of 200μl pentobarbital-sodium (Narcoren, Pharmazeutischen
Handelsge-sellschaft) and perfused using a 0.9% NaCl solution. The brain and spleen were extracted and stored in ice-cold HBSS (Gibco-Invitrogen). For naïve mouse brains, the olfactory bulbs and the cerebellum were cut by a scalpel and discarded. The rest of the tissue was used for dissocia-tion. In tumor-bearing mouse brains, only the visible tumor area around the injection site was used.
and a layer of 5 ml cold PBS (Gibco-Invitrogen) was added on top. Centrifugation at 950 g with slow acceleration and without breaks created a gradient that separated the cell pellet on the bottom of the tube from the myelin which was carefully aspirated. For the isolation of GAMs from RCAS-PDGFb tumors-bearing and corresponding naïveCx3cr1GFP/wtCcr2RFP/wt
mice a 30%/70% Percoll gradient was used. After 25 min of centrifugation at 800 g GAMs and naïve microglia were enriched at the 30%/70% interphase. Cells were collected, washed once with PBS, and subsequently centrifuged again at 300 g for 10 min. Subsequently, the cell pellet was resuspended in sorting buffer for subsequent magnetic-activated cell sorting (MACS) or fluorescence-activated cell sorting (FACS) isolation.
Spleens were processed through a 70μm cell strainer with a syringe plunger and the mesh
rinsed with 10 ml of PBS per spleen. The cells were centrifuged and the pellet subjected to erythrocyte lysis by adding 5 ml of 1x RBC lysis buffer (Cat# 420301, Biolegend, San Diego, CA, USA). The lysis was carried out by shaking the tube mildly for 5 min at RT and subse-quently stopped with 20 ml of PBS. The pellet was washed once with PBS and resuspended in PBS, containing 0.5% FCS and 2mM EDTA (FACS buffer) for subsequent FACS isolation.
For RCAS-PDGFb tumors blood monocytes were used as peripheral controls (instead of monocytes isolated from spleens). To obtain blood monocytes, 200μl of blood was mixed with
500μl of PBS, containing 2.5 mM EDTA, centrifuged, the clear phase aspirated and the
re-maining phase mixed with 1 ml 1x RBC lysis buffer and incubated for 3 min on ice. The reac-tion was stopped by adding PBS, cells were centrifuged, washed once in 1x RBC lysis buffer and resuspended in FACS buffer.
MACS sorting
The CD11b+samples for the microarray were generated using magnetic activated cell sorting (MACS). Following percoll gradient centrifugation, tumor and control cell pellets were resus-pended in PBS, containing 0.5% FCS and 2 mM EDTA and labeled with anti-CD11b microbe-ads (Miltenyi Biotec, 130-093-634). The MACS isolation was carried out according to the manufacturer’s instructions and cells were subsequently used for RNA isolation.
FACS sorting
Samples for qRT-PCR validation of target genes that were generated from GL261-bearing and corresponding naïve control mice were FACS sorted using CD11b, CD45, Ly6C, and Ly6G to distinguish between resident microglia (CD11b+/CD45low) and invading macrophages/ monocytes (CD11b+/CD45high/Ly6G-/Ly6Chigh). Following percoll gradient centrifugation, cell pellets were resuspended in FACS buffer (containing 2% FCS) and stained with 2μl of
dye-coupled antibodies per 1107cells. The staining was done with CD45-e450 (48-0451-82), Ly6G-PE (12-5931-82), Ly6C-PerCpCy5.5 (45-5932-82) and CD11b-APC (17-0112-82) (all eBioscience, San Diego, CA, USA) for 30 min at 4°C. Thereafter, the cells were washed and re-suspended in 500μl FACS buffer per 5106cells for sorting at a BD FACSAria II (BD
Biosci-ence). Compensation was calculated with single-stained beads (552844, BD Bioscience, Franklin Lakes, NJ, USA) and unstained cells.
RNA Protocols
Total RNA from MACS or FACS-sorted cells was isolated using the RNeasy Plus Mini Kit (Qiagen, Hilden, Germany). On-column DNase 1 (Qiagen) digestion was performed and total RNA was eluted in RNase-free water. RNA yield was measured using a Nanodrop 1000 (Nano-drop, Wilmington, DE, USA) spectrophotometer and quality was assessed using an Agilent 2100 Bioanalyzer (Agilent, Santa Clara, CA, USA). Samples were stored at -80°C until further use. For qRT-PCR, first strand cDNA synthesis of RNA was done using the Superscript II (Invitrogen) reverse transcriptase according to the manufacturer’s instructions. For mRNA transcription oligo-dT primers (Invitrogen) were used. cDNA was stored at -20°C until further processing.
Microarray
For the microarray MACS-isolated CD11b+cells from GL261 gliomas (injected into 6–8-week-old C57BL/6 mice; 3 samples; one tumor sample per RNA sample), and age-matched naïve control mice (3 samples; three control brains were pooled per sample). We obtained yields of 500ng to 1μg of total RNA of good quality (Agilent RNA Integrity Number, RIN = 8.2–10.0).
Sample preparation for microarray hybridization was carried out as described in the Ambion WT Expression Kit Protocol (Life Technologies, Carlsbad, CA, USA) and the Affyme-trix WT Terminal Labeling and Hybridization User Manual (AffymeAffyme-trix, Inc., Santa Clara, CA, USA). In brief, 300 ng of total RNA were used to generate double-stranded cDNA. 12μg of
subsequently synthesized cRNA was purified and reverse transcribed into sense-strand (ss) cDNA, whereat unnatural dUTP residues were incorporated. Purified ss cDNA was frag-mented using a combination of uracil DNA glycosylase (UDG) and apurinic/apyrimidinic en-donuclease 1 (APE 1) followed by a terminal labeling with biotin. 3,8μg fragmented and
labeled ss cDNA were hybridized to Affymetrix Mouse Gene 1.0 ST arrays for 16 h at 45°C in a rotating chamber. Hybridized arrays were washed and stained in an Affymetrix Fluidics Station FS450, and the fluorescent signals were measured with an Affymetrix GeneChip Scanner 3000 7G.
Sample processing was performed at an Affymetrix Service Provider and Core Facility,
“KFB—Center of Excellence for Fluorescent Bioanalytics”(Regensburg, Germany;
www.kfb-regensburg.de). Data sets are available athttp://www.ebi.ac.uk/arrayexpressunder the acces-sion number E-MTAB-2660.
Bioinformatic Analysis
Two additional data sets consisting of three samples each that were generated from CD11b+ MACS-isolated peritoneal myeloid cells were downloaded fromhttp://www.ebi.ac.uk/ arrayexpress[25]—E-MEXP-3623; [26]—E-GEOD-25585) and used as peripheral controls. Two independent approaches were used for bioinformatic data analysis. For the first method the Affymetrix Expression Console Software Version 1.0 was used to create summarized ex-pression values (CHP-files) from the exex-pression array feature intensities (CEL-files). The Ro-bust Multichip Analysis (RMA) algorithm was applied [27]. Integrative analysis of genome-wide expression activities from DNA-microarray datasets was performed with the Gene Ex-pression Dynamics Inspector (GEDI), a Matlab (Mathworks, Natick, MA) freeware program which uses self-organizing maps (SOMs) to translate high-dimensional data into a 2D mosaic [28]. Each tile of the mosaic represents an individual SOM cluster and is color-coded to repre-sent high or low expression of the cluster's genes, thus identifying the underlying pattern.
and data was normalized with expresso-function, set to quantile normalization, and pmonly correcte.method and medianpolish summary method. Gene annotation was done with mogen-e10sttranscriptcluster [30], and only annotated probes were included in the analysis. Subse-quently, collapseRows, was used to obtain a single representative probe for each gene, resulting in 13,943 genes taken into the analysis [31]. Signed network analysis was done with Weighted Gene Coexpression Network Analysis (WGCNA [32]). An adjacency network was made using a softpower (β) value of 20, based upon the scale free criteria, and low connected genes were fil-tered out of the analysis, resulting in 10,875 genes. Dendrogram formation and module deter-mination was done by average linkage clustering and an arbitrary cut-off, determined by WGCNA. From each module, the Module Eigengene (ME) was calculated, which is the first principal component and functions as a representative of the expression profile of the module. Next, as a measure for intramodular connectivity, the ME was correlated to the expression pro-file of all intramodular genes, resulting in a kME-table, to determine which genes are most im-portant, e.g. hub-genes. These module Membership values were multiple testing corrected using R package Stats. Genes significantly associated to these modules (FDR p value<0.01)
were used for further analysis.
Heat maps were generated using heatmap.2 function of Bioconductor Package Gplots [33]. Functional annotation and transcription factor binding site enrichment analysis of the modules was done using Webgestalt [34,35]. The WGCNA UserlistEnrichment method was used to de-termine the significance of the overlap of several gene lists with the induced gene lists using a Hypergeometric test [31].
For the Gene Set Enrichment Analysis (GSEA) the 438 upregulated genes from our GAMs dataset were taken to form a gene set, and it was tested if this gene set is overrepresented in the upregulated or downregulated genes in the M1 or M2a,b,c macrophage data sets in comparison to M0. For each of M1, M2a, M2b, and M2c polarization, in total 4 runs of GSEA were execut-ed. Taking M1 as an example, we fed the gene expression values of M1 and M0, each with 3 replicates, to the GSEA software; signal-to-noise ratios of each gene were calculated to rank the genes in a descending manner. An enrichment score (ES) for the gene set of 438 genes was then computed based on the gene ranking, which corresponds to the magnitude of the overrep-resentation. Thereafter, the significance level of the ES was evaluated by a gene-set permutation test with 1000 permutations.
qRT-PCR
Quantitative RT-PCR reactions were performed using the SYBR Select Mastermix (Applied Biosystems, Foster City, CA, USA) according to the manufacturer’s instructions on a 7500 Fast Real-Time PCR System (Applied Biosystems).
Survival outcome analysis
Cbioportal (http://www.cbioportal.org/public-portal/) was used to access patient survival in-formation and tumor gene expression data of GBM patients (Study: Glioblastoma multiforme, TCGA Provisional, mRNA Expression z-Scores (microarray), accessed in August 2014) [36,37]. Subtype information was retrieved from [38]. The standard deviation of the gene ex-pression values of all patients was calculated. Patients with a gene exex-pression lower than the negative standard deviation were clustered into the low expression group, whereas patients with a gene expression higher than the positive standard deviation were clustered into the high expression group. For subtype analysis the patients were clustered according to the standard deviation of gene expression within that subtype. Survival plots were generated and Kaplan-Meier curves were produced and statistical significances between high and low expression groups were calculated with the Log Rank (Mantel-Cox) test using GraphPad Prism 5. To test for a proportional risk increase with each unit of gene expression, we fitted a Cox proportional hazards regression model to our data including a test for the proportional hazards assumption [39]. Analysis was done using the statistical script language R [40].
Results
Gene expression profile of glioma-associated microglia/macrophages
(GAMs)
To identify glioma-regulated transcripts in glioma-associated microglia/macrophages, we iso-lated microglia/macrophages from GL261 glioma-bearing brains using MACS sorting with anti-CD11b antibodies. As controls we isolated microglia from age-matched healthy mouse brain and performed an Affymetrix Genechip Mouse Gene 1.0ST microarray on these samples. Additionally, we also used two data sets that were generated from CD11b+MACS-isolated peritoneal myeloid cells as peripheral controls. These data sets were downloaded fromhttp:// www.ebi.ac.uk/arrayexpress[25]—E-MEXP-3623; [26]—E-GEOD-25585). The two additional data sets consisted of three samples each, generated from either CD11b+MACS-sorted [26] or CD11b+MHC-IIhiB220-Gr1-flow-sorted cells [25]. When comparing the GAMs data set to the three naïve control data sets, 783 genes were significantly upregulated at least 2-fold and 198 genes downregulated at least 2-fold (S2 Table).
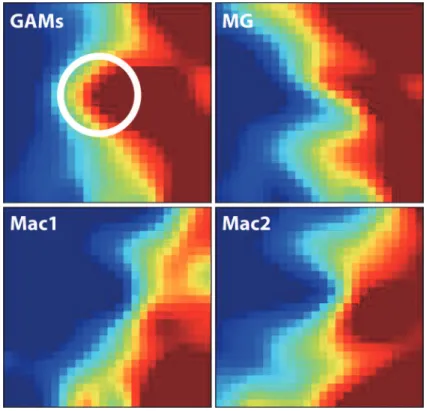
We first applied the Gene Expression Dynamics Inspector (GEDI) on these datasets to visu-alize the global patterns of gene expression in GAMs versus naive microglia and macrophages. GEDI uses self-organizing maps to capture genome-wide transcriptome activity via‘gestalt’ recognition [28]. GEDI facilitates the identification of genome-wide patterns with each mosaic tile in the map representing a gene cluster that is expressed at similar levels. The four GEDI maps, with blue colour indicating low and red colour high mRNA expression levels, show that the gene expression patterns of GAMs and naive microglia are more similar to each other than both macrophage datasets. Closer inspection of both microglia GEDI patterns then revealed a central cluster of highly expressed genes in GAMs that is different from naive microglia (white circle) (Fig. 1).
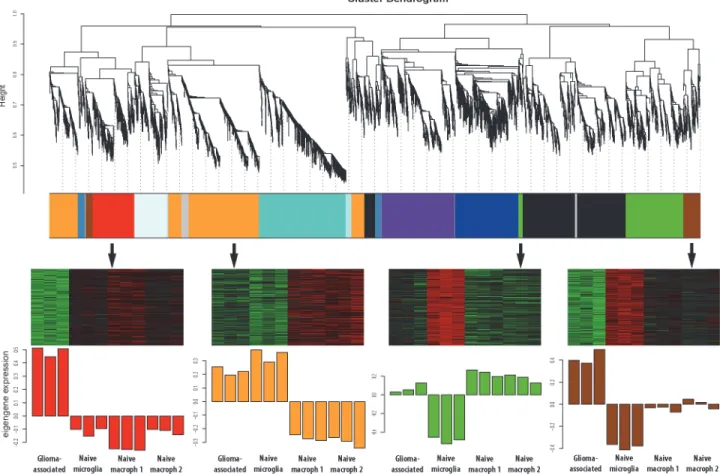
Weighted Gene Coexpression Network Analysis of the data sets
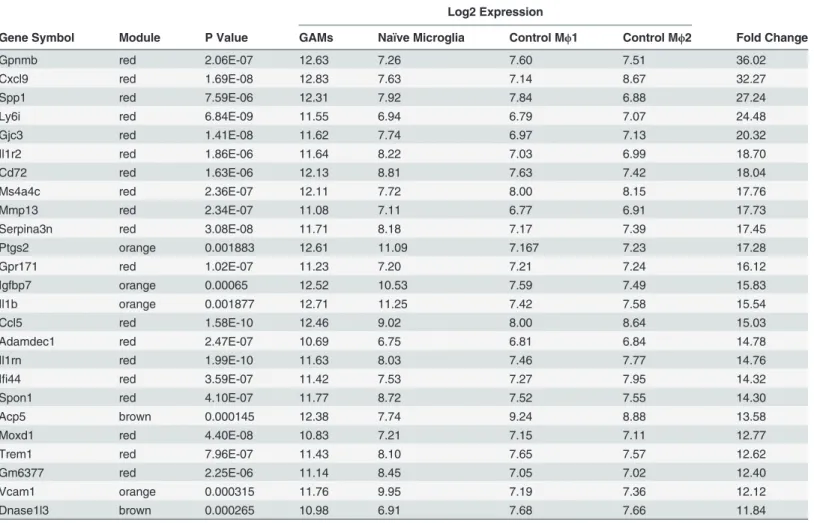
modules contained genes that were upregulated in glioma-associated samples compared to the three control data set (labeled red and brown inFig. 2).Table 1shows the genes with the stron-gest upregulation in GAMs and the modules they were clustered into.S3 Tablelists all 10,875 genes and the corresponding modules they were clustered into.
In addition, the gene clustering revealed genes that were specific for either microglia or mac-rophages. The orange module contains genes that were highly expressed in GAMs and already showed high expression in naïve microglia, but low expression in naïve macrophages (Fig. 2). Genes that showed high expression in GAMs and naïve macrophages, but low expression in naïve microglia were clustered into the green module (Fig. 2). Two studies used RNA sequenc-ing and microarray analysis to determine microglia and macrophage-specific genes [42,43]. Genes that were found to be microglia-specific in these reports predominantly clustered into our orange module, whereas macrophage-specific genes are enriched in our green module, vali-dating our findings.
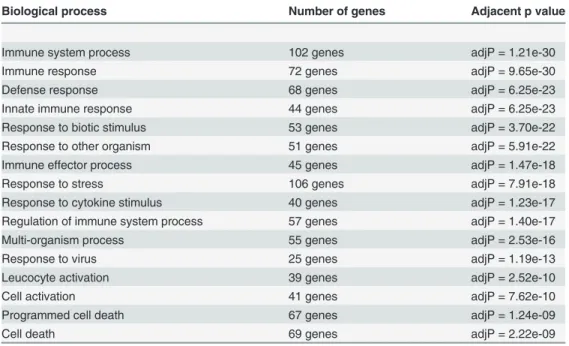
We used Webgestalt to perform gene ontology (GO) enrichment analysis on all>2 fold
upregulated genes that clustered into the glioma-regulated (red and brown) modules (438 genes in total) to identify overrepresented GO terms (Table 2). Several GO terms were overrep-resented in the GAMs data set that can be grouped into three main groups: regulation of im-mune response/activation, programmed cell death, and response to other organism/to virus. All genes included in the overrepresented GO terms are listed inS4 Table. Next, we used Webgestalt to identify transcription factor binding sites that are enriched in the same set of Fig 1. Graphical representation of gene expression patterns in the four data sets.The four GEDI maps show that the gene expression patterns of GAMs and naive microglia are more similar to each other than both macrophage datasets (blue colour indicating low and red colour high mRNA expression levels). The white circle highlights a central cluster of highly expressed genes in GAMs that is different from naive microglia. GAMs: glioma-associated microglia/macrophage microarray data; MG: naive microglia microarray data; Mac1: external data set from Keller, Mazuch et al. 2009; Mac2: external data set from Young, Eksmond et al. 2012.
genes (Table 3). This analysis revealed that enriched binding sites included known sites for IRF1, IRF2, IRF7, IRF8, IRF9/STAT1/STAT2, STAT5A, STAT5B, and NFAT. BothStat1and
Stat2clustered into the glioma-regulated brown module and were around 2.5 fold upregulated. In contrast,Stat5aandStat5bwere not significantly regulated at the transcriptional level.Irf7
andIrf9were 6.9-fold and 1.4-fold upregulated and clustered into the brown and red module, respectively.
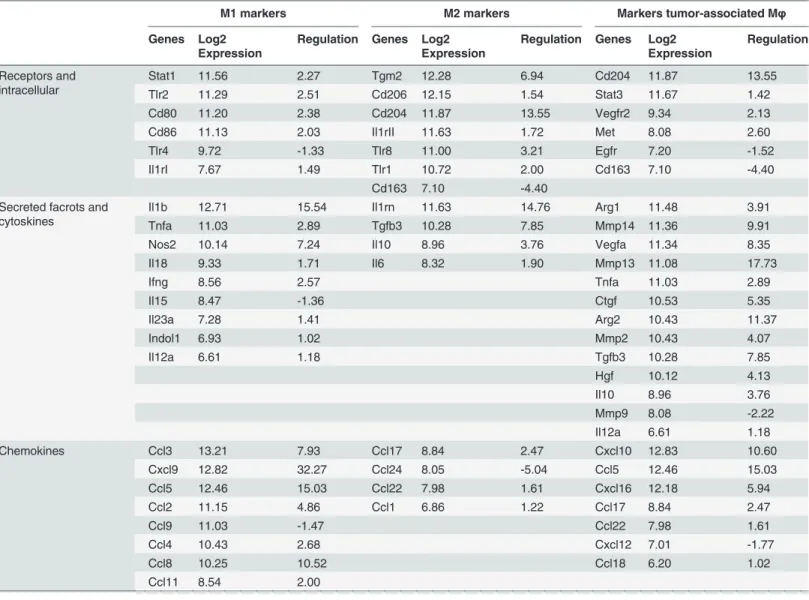
GAMs transcriptome only partially resembles an M1 or M2 polarization
To further analyze the phenotype of GAMs, we compared our glioma-associated data set with typical markers for an M1 and M2 macrophage phenotype (Table 4). Furthermore, we com-pared our data set with data sets of macrophages that were polarizedin vitrointo an M1 or M2a,b,c phenotype. We used data sets (Data set: E-GEOD-32690; [44]) that contained data of macrophages stimulatedin vitrofor 24 h with LPS and IFN-γ(M1 polarization), IL4 (M2a po-larization), IFN-γand complexed Ig (M2b polarization), and Dexamethasone (M2c polariza-tion)–in comparison to unstimulated M0 macrophages.For this analysis we considered genes in our GAMs dataset that were glioma-regulated (genes that clustered into the red and brown module) and were>2-fold upregulated and
Fig 2. WGCNA gene clustering reveals glioma-regulated gene modules.Each color represents a different module and each module contains genes with similar expression patterns over all four sample sets. The glioma-regulated modules (labeled as red and brown) were further analyzed, as they contained genes that were upregulated in the glioma-associated set when compared to all three control sets. A third module (labeled as green module) contained genes that were highly expressed in GAMs when compared to naïve microglia, but were already highly expressed in peripheral macrophages. The module that is
depicted as orange contains genes that were highly expressed in GAMs, and also highly expressed in naïve microglia, however expressed at lower levels in
peripheral macrophages. All other clusters contained genes that did not seem to be glioma-regulated.
compared them with genes that were>2-fold up- or downregulated in the four M1/M2a,b,c
data sets (in comparison to the M0 state). GAMs: 438 upregulated genes; M1: 1243 genes up-, 1704 genes downregulated; M2a: 227 genes up-, 322 genes downregulated; M2b: 501 genes up-, 483 genes downregulated; M2c: 381 genes up-, 358 genes downregulated. We found that all gene sets are significantly enriched in our GAM profile, but the M1 and M2b subsets were most significantly affected: M1 (138 out of 438 upregulated genes in GAMs were also upregu-lated in M1 macrophages, 31.5%, Bonferroni p value: 2.01e-60), M2b-polarized macrophages (80 out of 438 upregulated genes in GAMs were also upregulated in M2b macrophages, 18.3%, p value: 5.29e-43). The enrichment of M2c- (34 out of 381 genes, 7.8%, p value: 1.62e-11) and M2a (23 out of 438 genes, 5.3%, p value: 6.88e-09) was less strong (Fig. 3A).Table 5lists all genes that are significantly enriched in our GAMs data set and are specific for either M1, M2a, M2b, or M2c polarization. Using Gene Set Enrichment Analysis (GSEA) we found that the 438 upregulated genes in GAMs are significantly enriched in the upregulated genes of all four mac-rophage polarization sets (Fig. 3B). Furthermore we tested the enrichment of the>2 fold
up-and downregulated M1, M2a,b,c genes in the entire GAMs data set that resulted from the WGCNA analysis (10,875 genes) (S1 Fig.). Six out of eight sets were significantly enriched in the up- and downregulated genes of the GAMs data set. However, 59.6% of the genes that were upregulated in GAMs (261 out of 438 genes) were not upregulated in any of the four
Table 1. The 25 highest-upregulated genes in the glioma-associated data set compared to all three control sets.
Log2 Expression
Gene Symbol Module P Value GAMs Naïve Microglia Control Mϕ1 Control Mϕ2 Fold Change
Gpnmb red 2.06E-07 12.63 7.26 7.60 7.51 36.02
Cxcl9 red 1.69E-08 12.83 7.63 7.14 8.67 32.27
Spp1 red 7.59E-06 12.31 7.92 7.84 6.88 27.24
Ly6i red 6.84E-09 11.55 6.94 6.79 7.07 24.48
Gjc3 red 1.41E-08 11.62 7.74 6.97 7.13 20.32
Il1r2 red 1.86E-06 11.64 8.22 7.03 6.99 18.70
Cd72 red 1.63E-06 12.13 8.81 7.63 7.42 18.04
Ms4a4c red 2.36E-07 12.11 7.72 8.00 8.15 17.76
Mmp13 red 2.34E-07 11.08 7.11 6.77 6.91 17.73
Serpina3n red 3.08E-08 11.71 8.18 7.17 7.39 17.45
Ptgs2 orange 0.001883 12.61 11.09 7.167 7.23 17.28
Gpr171 red 1.02E-07 11.23 7.20 7.21 7.24 16.12
Igfbp7 orange 0.00065 12.52 10.53 7.59 7.49 15.83
Il1b orange 0.001877 12.71 11.25 7.42 7.58 15.54
Ccl5 red 1.58E-10 12.46 9.02 8.00 8.64 15.03
Adamdec1 red 2.47E-07 10.69 6.75 6.81 6.84 14.78
Il1rn red 1.99E-10 11.63 8.03 7.46 7.77 14.76
Ifi44 red 3.59E-07 11.42 7.53 7.27 7.95 14.32
Spon1 red 4.10E-07 11.77 8.72 7.52 7.55 14.30
Acp5 brown 0.000145 12.38 7.74 9.24 8.88 13.58
Moxd1 red 4.40E-08 10.83 7.21 7.15 7.11 12.77
Trem1 red 7.96E-07 11.43 8.10 7.65 7.57 12.62
Gm6377 red 2.25E-06 11.14 8.45 7.05 7.02 12.40
Vcam1 orange 0.000315 11.76 9.95 7.19 7.36 12.12
Dnase1l3 brown 0.000265 10.98 6.91 7.68 7.66 11.84
macrophage phenotypes (Fig. 3C). This indicates that the GAMs phenotype shows only partial overlap with the classical M1 or M2 macrophage phenotype.
Validation of M1 and M2a,b,c marker gene expression in GAMs
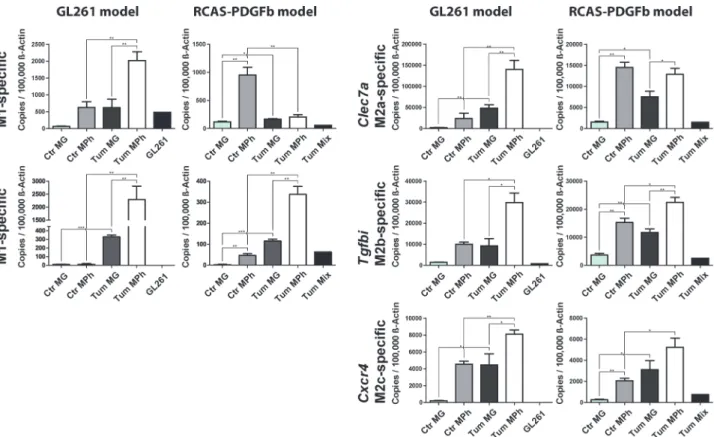
In addition we selected five genes that were upregulated in GAMs, clustered into the glioma-regulated (red and brown) modules, and were specifically upglioma-regulated in either M1, M2a, M2b, or M2c-polarized macrophages and validated the expression of these genes by qRT-PCR in FACS-sorted samples. We selectedIl1rn, Isg20(both specific for M1-polarized macrophages),
Clec7a(M2a),Tgfbi(M2b), andCxcr4(M2c).
We FACS-isolated GAMs from GL261 tumors and RCAS-PDGFb tumors and measured the expression by qRT-PCR in comparison to microglia and peripheral macrophages isolated from control animals. For GAMs isolated from the GL261 mouse model, we distinguished be-tween resident microglia (CD11b+/CD45low) and invading macrophages/monocytes (CD11b+/ CD45high/Ly6G-/Ly6Chigh) by FACS sorting (Fig. 4A; [45]). In addition to microglia derived from naïve animals we also used spleen-derived macrophages/monocytes as
additional controls.
As a further validation we used the RCAS-PDGFb tumor model, which produces pro-neural high-grade glioma, as a second glioma model system [22]. For this tumor model primary RCAS-PDGFb tumors were re-transplanted intoCx3cr1GFP/wtCcr2RFP/wtmice, which allowed us to FACS-isolate RFP-/GFP+microglia and RFP+/GFPlowmacrophages/monocytes from tu-mors, as well as RFP-/GFP+microglia from control brains and RFP+/GFPlowmonocytes from peripheral blood without further antibody staining (Fig. 4B; [23]).
In the GL261 model a significant higher expression of all selected genes could be confirmed in glioma-associated macrophages/monocytes and forIl1rn, Clec7a, andCxcr4in glioma-asso-ciated microglia, compared to the respective control cells (Fig. 5).
Table 2. We used Webgestalt to identify overrepresented GO terms in>2 fold upregulated genes in the glioma-regulated (red and brown) modules.
Biological process Number of genes Adjacent p value
Immune system process 102 genes adjP = 1.21e-30
Immune response 72 genes adjP = 9.65e-30
Defense response 68 genes adjP = 6.25e-23
Innate immune response 44 genes adjP = 6.25e-23
Response to biotic stimulus 53 genes adjP = 3.70e-22
Response to other organism 51 genes adjP = 5.91e-22
Immune effector process 45 genes adjP = 1.47e-18
Response to stress 106 genes adjP = 7.91e-18
Response to cytokine stimulus 40 genes adjP = 1.23e-17
Regulation of immune system process 57 genes adjP = 1.40e-17
Multi-organism process 55 genes adjP = 2.53e-16
Response to virus 25 genes adjP = 1.19e-13
Leucocyte activation 39 genes adjP = 2.52e-10
Cell activation 41 genes adjP = 7.62e-10
Programmed cell death 67 genes adjP = 1.24e-09
Cell death 69 genes adjP = 2.22e-09
In the RCAS model we saw a significant higher expression of all selected genes when com-paring glioma-associated microglia to naïve microglia. When comcom-paring glioma-associated macrophages/monocytes to naïve monocytes, only the expression ofIl1rn, Tgfbi, andCxcr4
was significantly higher. ForIsg20we detected a lower expression in glioma-associated macro-phages/monocytes when compared to naïve monocytes. Furthermore, the expression ofClec7a
was unchanged in glioma-associated macrophages/monocytes when compared to naïve mono-cytes. All investigated genes were expressed at higher levels in naïve monocytes when compared to naïve microglia. In part the expression was as high as in glioma-associated microglia. The dif-ference of gene expression between the RCAS and the GL261 model might be partially caused by the different isolation procedures. We usedGFP/RFPexpression inCx3cr1GFP/wtCcr2RFP/wtmice for the RCAS model, as compared to antibody staining for CD11b/CD45/Ly6G/Ly6C in the GL261 model.
Furthermore, the expression of the selected genes was lower in the RCAS model when com-pared to the GL261 model–this was most notable forIsg20, Il1rn, andClec7a. This might rep-resent differences in the tumor biology of both models, but might also be owed to the different growth pattern and kinetics of the tumors. Mice injected with GL261 tumors were sacrificed 20 days post-injection, whereas mice implanted with RCAS tumors were sacrificed 4–5 weeks post-operation. Thus, GAMs in RCAS tumors were exposed to the tumor environment over Table 3. We used Webgestalt to identify enriched transcription factor binding sites in>2 fold upregulated genes in the glioma-regulated (red and brown) modules.
Enriched transcription factor targets Genes Statistics
mmu_STTTCRNTTT_V$IRF_Q6 Bst2, Ddr2, Dhx58, Dtx3l, Epsti1, Hgf, Ifi44, Ifit2, Ifit3, Il18bp, Isg15, Lgals3bp, Nampt, Tap1, Tnfsf13b, Usp18, Xaf1, Zbp1
adjP = 2.16e-05
mmu_V$ISRE_01 Ammecr1, Bst2, Cxcr4, Dhx58, Dtx3l, Epsti1, Gpr65, Ifi44, Ifih1, Ifit2, Ifit3, Isg15, Kynu, Met, Mmp25, Pgk1, Tnfsf13b, Usp18, Xaf1, Zbp1
adjP = 2.84e-05
mmu_V$ICSBP_Q6 Adam8, Bst2, Cxcr4, Dtx3l, Emp1, Ifi44, Ifih1, Ifit3, Il18bp, Isg15, Kynu, Parp12, Tap1, Tfec, Tnfsf13b, Usp18, Zbp1, Zmynd15
adjP = 0.0004
mmu_V$IRF7_01 Bst2, Cxcr4, Dll4, Dtx3l, Epsti1, Ifit2, Il18bp, Isg15, Lgals3bp, Nr4a2, Nr4a3, Parp12, Pdgfc, Tap1, Usp18, Xaf1, Zmynd15
adjP = 0.0012
mmu_V$IRF_Q6 Bst2, Cd80, Cxcr4, Dhx58, Dnase1l3, Dtx3l, Fcgr2b, Ifi44, Ifit2, Il18bp, Isg15, Kynu, Parp12, Tnfsf13b, Ube2l6, Zbp1
adjP = 0.0026
mmu_V$IRF1_01 Bst2, Ccl5, Dnase1l3, Dtx3l, Isg15, Kynu, Neto1, Pdgfc, Slamf8, Tap1, Tfec, Tgfb3, Tnfsf13b, Usp18, Xaf1
adjP = 0.0083
mmu_TTCYNRGAA_V$STAT5B_01 Ccl5, Cish, Crem, Dll4, Gzmb, Il18bp, Nfil3, Nkg7, Nr4a3, Pcolce, Plagl1, Plscr1, Serping1, Socs2, Stc1, Tnfrsf9, Trim25
adjP = 0.0213
mmu_TGGAAA_V$NFAT_Q4_01 Adam9, Adamtsl4, Adm, Aig1, Arrdc4, Bhlhe40, Ccl5, Cd72, Cdkn1a, Chl1, Cish, Creb5, Crem, Ctgf, Ctla4, Dab2, Ddr2, Dll4, Emp1, Erbb3, Gsn, Has2, Hgf, Hif1a, Htr7, Htra4, Ifng, Igfbp3, Il1rn, Impa2, Inhba, Irs2, Isg15, Kynu, Lgals1, Mcam, Mdfic, Mmp14, N4bp1, Nfil3, Nr4a2, Nr4a3, Pde4b, Pdk3, Pgam1, Plod2,
Prr11, Prrx1, Sema6a, Socs2, Spp1, Stc1, Tgfb3, Tmem97, Tnfsf10, Trim25, Vegfa
adjP = 0.0221
mmu_V$STAT5B_01 Ccl5, Cish, Crem, Dll4, Nfil3, Nr4a2, Nr4a3, Pcolce, Plagl1, Plscr1, Serping1, Socs2, Stc1, Trim25
adjP = 0.0221
mmu_V$STAT5A_01 Ccl5, Cish, Crem, Dll4, Nfil3, Nr4a2, Nr4a3, Pcolce, Plagl1, Plscr1, Serping1, Socs2, Stc1, Tnfrsf9
adjP = 0.0249
mmu_TGANTCA_V$AP1_C Adm, Aig1, Ass1, Atp6v0d2, Ccr7, Cd109, Cdkn1a, Creb5, Cst7, Emp1, Furin, Gpnmb, Gpr141, Gzmb, Hspb6, Il10, Il1rn, Isg20, Itgax, Krt8, Lgals1, Mmp12, Mmp13, Mmp19, N4bp1, Osmr, Plp2, Procr, Prrg4, Stat1, Stc1, Tm4sf19, Tnfrsf9, Trim25, Vat1, Vdr, Vegfa
adjP = 0.0460
mmu_V$STAT_01 Cish, Crem, Gzmb, Il18bp, Nfil3, Nkg7, Nr4a3, Pcolce, Plscr1, Runx3, Serping1, Socs2, Trim25
adjP = 0.0460
mmu_V$IRF2_01 Bst2, Dnase1l3, Dtx3l, Pdgfc, Tap1, Tgfb3, Tnfsf13b, Usp18, Xaf1 adjP = 0.0460
longer times and the transcriptional program might have changed over the duration of the stimulus.
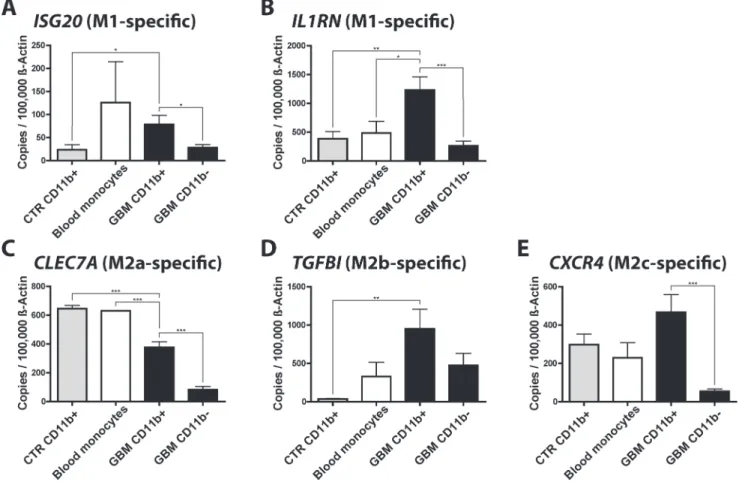
Next, we collected human glioma samples and isolated CD11b+microglia/macrophages via MACS. We analyzed the gene expression of GAMs (CD11b+sorted cells) in GBM samples, the flow through of these tumor samples (the CD11b-negative fraction after MACS-isolation), control microglia samples (taken from brain resections of hippocampus, epilepsy, and trauma patients), and blood monocytes (Fig. 6).
We detected high expression of all genes in CD11b+GAMs isolated from GBM samples, however only the gene expression ofIL1RN, ISG20(both M1-specific), andTGFBI (M2b-spe-cific) was significantly higher in CD11b+cells isolated from GBM samples, when compared to CD11b+cells isolated from control brain samples. The expression ofCXCR4was not signifi-cantly higher, whereas the expression ofCLEC7Awas significantly lower in CD11b+cells iso-lated from GBM samples. This might be in part due to the fact that the control brain specimen Table 4. Expression of known M1, M2, and TAM marker genes in our GAMs data set.
M1 markers M2 markers Markers tumor-associated Mφ
Genes Log2 Expression
Regulation Genes Log2 Expression
Regulation Genes Log2 Expression
Regulation
Receptors and intracellular
Stat1 11.56 2.27 Tgm2 12.28 6.94 Cd204 11.87 13.55
Tlr2 11.29 2.51 Cd206 12.15 1.54 Stat3 11.67 1.42
Cd80 11.20 2.38 Cd204 11.87 13.55 Vegfr2 9.34 2.13
Cd86 11.13 2.03 Il1rII 11.63 1.72 Met 8.08 2.60
Tlr4 9.72 -1.33 Tlr8 11.00 3.21 Egfr 7.20 -1.52
Il1rI 7.67 1.49 Tlr1 10.72 2.00 Cd163 7.10 -4.40
Cd163 7.10 -4.40
Secreted facrots and cytoskines
Il1b 12.71 15.54 Il1rn 11.63 14.76 Arg1 11.48 3.91
Tnfa 11.03 2.89 Tgfb3 10.28 7.85 Mmp14 11.36 9.91
Nos2 10.14 7.24 Il10 8.96 3.76 Vegfa 11.34 8.35
Il18 9.33 1.71 Il6 8.32 1.90 Mmp13 11.08 17.73
Ifng 8.56 2.57 Tnfa 11.03 2.89
Il15 8.47 -1.36 Ctgf 10.53 5.35
Il23a 7.28 1.41 Arg2 10.43 11.37
Indol1 6.93 1.02 Mmp2 10.43 4.07
Il12a 6.61 1.18 Tgfb3 10.28 7.85
Hgf 10.12 4.13
Il10 8.96 3.76
Mmp9 8.08 -2.22
Il12a 6.61 1.18
Chemokines Ccl3 13.21 7.93 Ccl17 8.84 2.47 Cxcl10 12.83 10.60
Cxcl9 12.82 32.27 Ccl24 8.05 -5.04 Ccl5 12.46 15.03
Ccl5 12.46 15.03 Ccl22 7.98 1.61 Cxcl16 12.18 5.94
Ccl2 11.15 4.86 Ccl1 6.86 1.22 Ccl17 8.84 2.47
Ccl9 11.03 -1.47 Ccl22 7.98 1.61
Ccl4 10.43 2.68 Cxcl12 7.01 -1.77
Ccl8 10.25 10.52 Ccl18 6.20 1.02
Ccl11 8.54 2.00
Marker genes were taken from literature reviews [10,17,65].
Fig 3. Comparison of GAMs with data sets of M1, M2a,b,c-stimulated macrophages.We retrieved data sets fromhttp://www.ebi.ac.uk/arrayexpress(Data set: E-GEOD-32690; [44]), containing data of
macrophages that were stimulated for 24 hin vitrointo different polarization states (M0 (unstimulated), M1 (IFNγ+ LPS), M2a (IL4), M2b (IFNγ+ complexed Ig), and M2c (Dexamethasone)) and compared which
were not taken from healthy patients, but patients suffering from epilepsy (3 samples) and trauma injury (1 sample). In these conditions the microglia might have already been polarized toward an M2-like phenotype.
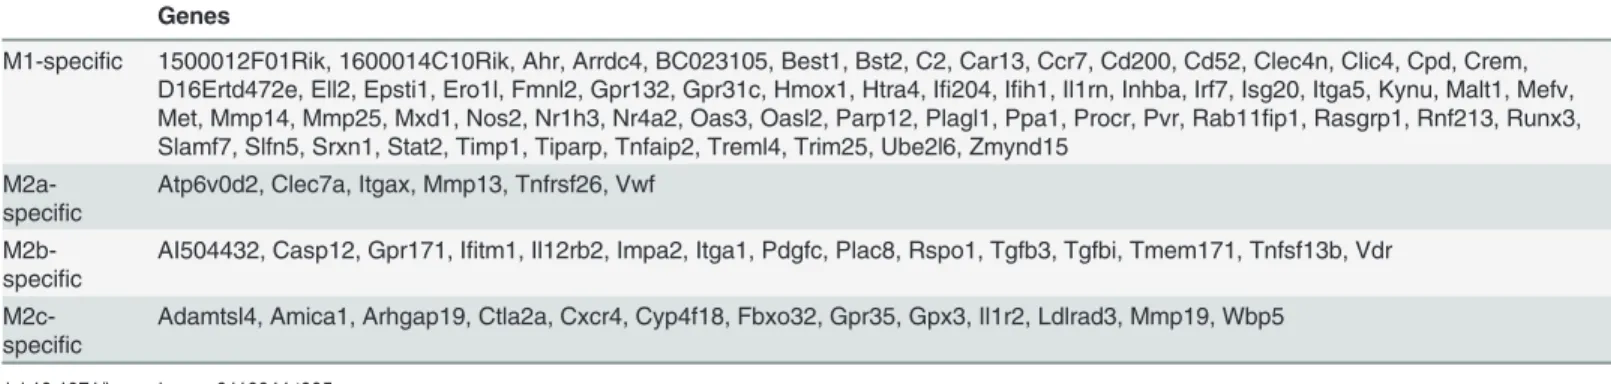
Table 5. M1 and M2a,b,c-specific genes that are>2-fold upregulated in our GAMs data set.
Genes
M1-specific 1500012F01Rik, 1600014C10Rik, Ahr, Arrdc4, BC023105, Best1, Bst2, C2, Car13, Ccr7, Cd200, Cd52, Clec4n, Clic4, Cpd, Crem, D16Ertd472e, Ell2, Epsti1, Ero1l, Fmnl2, Gpr132, Gpr31c, Hmox1, Htra4, Ifi204, Ifih1, Il1rn, Inhba, Irf7, Isg20, Itga5, Kynu, Malt1, Mefv, Met, Mmp14, Mmp25, Mxd1, Nos2, Nr1h3, Nr4a2, Oas3, Oasl2, Parp12, Plagl1, Ppa1, Procr, Pvr, Rab11fip1, Rasgrp1, Rnf213, Runx3, Slamf7, Slfn5, Srxn1, Stat2, Timp1, Tiparp, Tnfaip2, Treml4, Trim25, Ube2l6, Zmynd15
M2a-specific
Atp6v0d2, Clec7a, Itgax, Mmp13, Tnfrsf26, Vwf
M2b-specific
AI504432, Casp12, Gpr171, Ifitm1, Il12rb2, Impa2, Itga1, Pdgfc, Plac8, Rspo1, Tgfb3, Tgfbi, Tmem171, Tnfsf13b, Vdr
M2c-specific
Adamtsl4, Amica1, Arhgap19, Ctla2a, Cxcr4, Cyp4f18, Fbxo32, Gpr35, Gpx3, Il1r2, Ldlrad3, Mmp19, Wbp5
doi:10.1371/journal.pone.0116644.t005
Fig 4. Flow cytometry isolation strategies for generation of mouse qPCR samples.A) Plots depicting the strategy for isolation of microglia and macrophages from naïve brains and GL261 glioma-bearing brains using antibody staining for CD11b, CD45, Ly6C, and Ly6G. CD45 staining was used to distinguish between CD11b+/CD45lowresident microglia (gate P9) and CD11b+/CD45high/Ly6G-/Ly6Chighinvading macrophages/monocytes (gates P8, P10, and P11), which were mostly absent in naïve brain samples. B) GAMs from RCAS-PDGFb tumors were isolated relying on an antibody-independent
approach. Primary tumors fromNtv-a/Ink4a-Arf-/-mice were reimplanted intoCx3cr1GFP/wtCcr2RFP/wtmice and GAMS were sorted according to GFP and RFP expression. In naïveCx3cr1GFP/wtCcr2RFP/wtmice only GFP+cells were present in the brain. In tumor-bearing mice, resident microglia were GFP+,
GAMs express the pro-tumorigenic genes
Gpnmb
and
Spp1
Two features of high grade glioma are the aggressive invasion into the brain parenchyma and the immune-suppressive environment which prevents tumor rejection. Previously, we and other groups reported the expression of several pro-tumorigenic genes expressed in GAMs. We could confirm the expression of most of these genes in our dataset and a selection of these genes can be found inTable 4.
To identify novel glioma-regulated genes expressed in microglia/macrophages that might play a role in tumor-progression, we screened our dataset for genes that have been reported to play a pro-tumorigenic role in peripheral tumors, but have not been reported in GAMs. The genesGpnmbandSpp1were two of the highest upregulated genes in our GAMs data set (Table 1), clustered into the glioma-regulated (red) module, and have been implicated in im-mune-suppression (Gpnmb) or tumor cell invasion (Spp1) in peripheral tumors. To investigate the expression of these genes in GAMs via qRT-PCR in FACS-sorted samples from GL261 and RCAS-PDGFb tumors in comparison to naïve control cells we used the same samples as de-scribed above for the validation of the M1 and M2a,b,c-specific genes.
We were able to validate the expression of both genes using qRT-PCR. Furthermore, the regulation of the genes was similar in both brain tumor models–GL261, as well as RCAS-PDGFb tumors (Fig. 7). This shows that the up-regulation of these genes was not specific for Fig 5. qPCR validation of selected M1 and M2a,b,c-specific genes in murine GAMs.We selected 5 genes that were upregulated in GAMs and specific for either M1 (Il1rnandIsg20), M2a (Clec7a), M2b (Tgfbi), or M2c polarization (Cxcr4) and investigated the expression of these using qRT-PCR. For this we isolated GAMs from GL261 and RCAS-PDGFb tumors using flow cytometry, in order to distinguish between resident microglia and invading macrophages/ monocytes and used microglia, and spleen-derived macrophages/monocytes from naïve mice as controls. CTR MG: naïve microglia, CTR Mph: naïve
monocytes, Tum MG: glioma-associated microglia, Tum Mph: glioma-associated macrophages/monocytes, GL261: cultured GL261 cells, Tum Mix: cultured RCAS-PDGFb tumor cells. Bar graphs illustrate the absolute number of transcripts normalized to 100,000 transcripts ofActb(n = 4). Analysis was done by students t test. Error bars indicate the Standard Error of Mean (SEM).*, p<0.05;**, p<0.01;***, p<0.001
one tumor model, but was observed in two different independent models. In addition, the ex-pression of both genes was higher in GAMs when compared to the tumor cells (except for
Gpnmbin the GL261 model), indicating that GAMs may be the primary source. Both genes were differently expressed in glioma-associated microglia and macrophages, as invading mac-rophages were the major source forGpnmbin the RCAS-PDGFb model, whereas resident microglia were the main source forSpp1in both models. The expression level ofGpnmbin both, glioma-associated resident microglia and invading macrophages/monocytes, was similar in both glioma models. In contrast, the expression ofSpp1was stronger in resident microglia and invading macrophages/monocytes isolated from RCAS-PDGFb tumors, when compared to the GL261 model.
To investigate the difference of gene expression in GAMs in the GL261 and the RCAS-PDGFb model in a broader set of genes we investigated the expression of six additional highly upregulated genes that clustered into the red or brown module in both models (S2 Fig.). From these six genes two were higher expressed in GAMs derived from the RCAS model (CD300lf
andCd200r4), two genes were expressed at similar levels in GAMs in both tumor models (Trem1andSh2d1b1), and two genes were higher expressed in GAMs derived from the GL261 model (Uck2andCreb5).
Fig 6. qPCR validation of selected M1 and M2a,b,c-specific genes in human GAMs.We determined the expression of the M1 (IL1RNandISG20), M2a (CLEC7A), M2b (TGFBI), and M2c-specific (CXCR4) genes in CD11b+and CD11b-cells isolated from human GBM (CD11b+n = 13, CD11b-n = 5), control
brain (CD11b+n = 5, CD11b-n = 2) and blood monocyte samples (n = 2). Bar graphs illustrate the absolute number of transcripts normalized to 100,000 transcripts ofACTB. Analysis was done by students t test. Error bars indicate the SEM.*, p<0.05;**, p<0.01;***, p<0.001
Expression of
GPNMB
and
SPP1
is upregulated in human
GBM-associated microglia/macrophages
As described above, we collected human samples and isolated CD11b+microglia/macrophages via MACS and used qRT-PCR to determine the expression ofGPNMBandSPP1in these Fig 7.GpnmbandSpp1expression is upregulated in murine GAMs.The gene expression ofGpnmband
Spp1was validated using qRT-PCR. For this we used the same FACS-sorted samples from GL261 and RCAS tumors as inFig. 5. The upregulation of both genes could be confirmed in both tumor models. Resident microglia and invading macrophages/monocytes show different expression patterns of these genes. CTR MG: naïve microglia, CTR Mph: naïve monocytes, Tum MG: associated microglia, Tum Mph: glioma-associated macrophages/monocytes, GL261: cultured GL261 cells, Tum Mix: cultured RCAS-PDGFb tumor cells. Bar graphs illustrate the absolute number of transcripts normalized to 100,000 transcripts ofActb(n = 4). Analysis was done by students t test. Error bars indicate the Standard Error of Mean (SEM).*, p<0.05; **, p<0.01;***, p<0.001
doi:10.1371/journal.pone.0116644.g007
Fig 8.GPNMBandSPP1expression is upregulated in human GAMs.We determined the expression of the genesGPNMBandSPP1in CD11b+and
CD11b-cells isolated from human GBM (CD11b+n = 15, CD11b-n = 9), meningioma (CD11b+n = 5, CD11b-n = 3), grade III anaplastic astrocytoma
(CD11b+n = 2, CD11b-n = 2), control brain (CD11b+n = 5, CD11b-n = 2) and blood monocyte samples (n = 2). The expression ofGPNMBandSPP1was
significantly higher in CD11b+cells isolated from GBMs compared to CD11b+cells isolated from control brain, benign meningioma samples, blood
monocytes, and CD11b-cells in GBM. Bar graphs illustrate the absolute number of transcripts normalized to 100,000 transcripts ofACTB. Analysis was done
samples. In addition to CD11b+and CD11b-cells isolated from GBM samples and naïve brain tissue we also investigated meningioma and anaplastic astrocytoma (grade III glioma) samples.
We found that the expression ofGPNMBandSPP1was significantly higher in human GAMs isolated from GBM samples, when compared to non-tumor-associated control micro-glia and blood monocytes (Fig. 8). Furthermore, the expression of these genes was significantly higher in GAMs than in the tumor flow through, indicating that GAMs are the predominant source for these transcripts (S3 Fig.). The source and rate of expression ofGPNMBseems to be dependent on the grade of malignancy of the tumor. In GBM GAMs were the main source for the expression, showing a 5 times higher expression than the GBM flow through, which com-prises tumor cells and other stromal cells. However, when looking at meningioma, a benign tumor of the meninges, the expression ofGPNMBwas higher in the CD11b-cell fraction, com-pared to the CD11b+cell fraction. The overall expression ofGPNMBwas higher in GBM than in meningioma and grade III astrocytoma samples. The expression level ofSPP1was also de-pendent on tumor grade. Similar toGPNMB, the expression ofSPP1was higher in GAMs iso-lated from GBM specimen, compared to the GBM flow through. Whereas, in lower grade tumors the expression ofSPP1was generally lower, which might indicate a possible role for
SPP1in higher grade tumors.
High expression of
GPNMB
and
SPP1
in human GBM tissues is
associated with poorer survival outcome
We used the cBioPortal database (http://www.cbioportal.org/public-portal/), to access TCGA data which links gene expression data to patient data, to investigate the effect ofGPNMBand
SPP1expression on patient prognosis [36,37]. We grouped patients into low and high expres-sion (gene expresexpres-sion lower than the negative standard deviation or higher than the positive standard deviation, respectively) and determined the overall survival for these patients. High expression of each gene has a negative effect on patient prognosis. Median survival was 19.77 months (lowGPNMBexpression) vs. 12.92 months (highGPNMBexpression) and 15.31 months (lowSPP1expression) vs. 8.82 months (highSPP1expression) (Fig. 9). This
dataset also included G-CIMP+tumors that are mostly proneural subtype tumors and generally have a better overall survival prognosis when compared to G-CIMP-tumors. We excluded these G-CIMP+tumors from our analysis and reanalyzed the data. Most G-CIMP+tumors ex-hibited a low expression of both,GPNMBandSPP1. Accordingly, the overall survival predic-tion for tumors with low expression of eitherGPNMBorSPP1was less favorable after
removing G-CIMP+tumors from the analysis. Median overall survival for GBM with lowSPP1
orGPNMBexpression was 14.16 months (lowSPP1expression including G-CIMP+tumors) vs. 12.56 months (lowSPP1expression excluding G-CIMP+tumors) and 17.7 months (low
GPNMBexpression including G-CIMP+tumors) vs. 14.82 months (lowGPNMBexpression excluding G-CIMP+tumors). We also plotted the overall survival of patients with intermediate expression of each gene (S4 Fig.). Patients with high and intermediateGPNMBexpression have a similar overall survival prognosis, whereas patients with lowGPNMBexpression have a sig-nificantly better prognosis. Median survival excluding G-CIMP+tumors was 10.39 months (highGPNMBexpression), 9.84 months (intermediate expression), and 14.82 months (low ex-pression). In contrast, the survival prognosis of patients with intermediateSPP1expression is in between of patients with low and highSPP1expression. Median survival excluding G-CIMP+tumors was 7.29 months (highSPP1expression), 10.49 months (intermediate expres-sion), and 12.56 months (low expression).
the effect of highGPNMBandSPP1expression in these subtypes. LowGPNMBexpression is associated with the most positive effect on patient prognosis in the proneural subtype if G-CIMP+patients are included (p = 0.09, median survival of 20.66 months (low expression) Fig 9. HighGPNMBandSPP1expression is associated with worsened survival prognosis in human GBM patients.Data taken from the TCGA database, showing survival probability of glioma patients grouped according to high and low expression of our target genesGPNMB(A) andSPP1(B). High expression of both genes has a negative effect on patient prognosis. Patients were in addition grouped into the four molecular subtypes (proneural, neural, mesenchymal, and classical). LowGPNMBexpression seems to have the most severe effect on patient prognosis in the proneural subtype when including G-CIMP+tumors, but no significant effect in the other subtypes. LowSPP1expression seems to have the highest effect on patient prognosis in the neural and
classical subtypes. Furthermore, both genes are differently regulated in the four subtypes (box plots in A and B) Significances for box plots:GPNMB: proneural GCIMP- (PG-) vs. proneural GCIMP+ (PG+)***, PG- vs. mesenchymal (M)***PG- vs. classical (C)**, PG+ vs. neural (N)***, PG+ vs. M***, PG+ vs. C**, N vs. M***, N vs. C*, M vs. C***.SPP1: PG- vs. M***, PG+ vs. N***, PG+ vs. M***, C vs. M***.*, p<0.05;**, p<0.01;***, p<0.001
vs. 9.21 months (high expression)), but not in the other subtypes. LowSPP1expression is asso-ciated with the most beneficial effect on patient prognosis in the neural (p = 0.044, median sur-vival of 25.90 months vs. 5.65 months) and the classical subtype (p = 0.09, median sursur-vival of 15.31 months vs. 9.11 months). Furthermore, both genes are differently regulated within the four subtypes. Mesenchymal tumors have a higher probability of highGPNMBandSPP1 ex-pression, whereas classical tumors have a higher probability of low expression of both genes. G-CIMP+tumors, which generally have a better survival prognosis, display the lowest expres-sion of both genes, indicating a possible role of these genes in advanced malignancy.
To test for a proportional risk increase for survival with the gene expression level, we fitted a Cox proportional hazards regression model to our data including a test for the proportional hazards assumption. The expression level of both genes had a significant effect on survival of glioblastoma patients (all glioblastoma) when G-CIMP+cases are included, as well as in the proneural subtype when G-CIMP+cases are included. All data sets, except neural subtype tu-mors when tested for SPP1 expression, passed the test for the proportional hazards assumption (S5 Table).
Discussion
Glioma-associated microglia/macrophages actively support glioma growth by the release of factors that stimulate angiogenesis, invasion, or suppression of immunity [9,10,11,15]. In the present study we performed a genome-wide expression analysis of these cells isolated from an experimental glioma mouse model. We have identified genes which are specifically regulated in glioma-associated microglia/macrophages when compared to naïve microglia or peripheral macrophages. We selected some of these genes and validated their expression in two indepen-dent glioma mouse models as well as in human glioma samples. In addition we could show that the expression of these genes differs in microglia and macrophages/monocytes. Our results are in accordance with previous reports that investigated the expression of selected target genes in GAMs via qRT-PCR [9,10,11], and markers known for tumor-associated macrophages in peripheral tumors. Several genes that are implicated in angiogenesis (Vegfa, Hgf), suppression of immunity (Arg1, Tgfb3), and tumor invasion (Mmp2, Mmp14, Ctgf) were also highly ex-pressed in our GAMs data set (Table 4).
Previous studies reported that GAMs express both markers of the M1 and M2 macrophage phenotype [9,18]. However, no extensive comparison of these phenotypes has been performed yet. By comparing our expression data with those generated from M1, M2a, M2b, and M2c-po-larized macrophages, we show that the GAM phenotype shows only partial overlap with the M1, M2a, M2b, and M2c phenotype. To date the term“M2-like polarization”has often been used for describing the polarization of GAMs; our data indicate that GAMs do not fit into a classical M1 or M2 phenotype, but represent a unique phenotype. As an alternate explanation it might reflect heterogeneity among GAMs. One might speculate that dependent on the loca-tion in the tumor tissue, some GAMs are polarized toward an M1-like phenotype, whereas other GAMs possess a more M2-like phenotype and another population of GAMs is not polar-ized toward M1 or M2-like states. Therefore, single-cell sequencing of GAMs would help to better understand the activation status of GAMs.
GAMs have been shown to promote tumor growth, rather than inhibiting it, e.g. by secret-ing factors that support glioma invasion or immunosuppressive factors [9,11,13,15]. Therefore, these cells represent an attractive target for anti-glioma therapy, as modulation of their activa-tion state might be useful to inhibit glioma progression [14,16]. Here we presentGPNMBand
correlated with shorter glioma-patient survival. The expression of neither of these genes was previously linked to GAMs.
The expression ofGPNMBhas been reported in tumor cells for different cancers, including glioma [46,47]. Furthermore,GPNMBexpression was detected in microglia of non-neoplastic rat brains and increased with inflammation [48]. The data from our GL261 glioma model sug-gests that GL261 cells expressGPNMBat a very high level. However, in the RCAS-PDGFb glio-ma mouse model, as well as in huglio-man GBM samples GAMs were the predominant source for
GPNMBexpression in all tested paired samples (S3 Fig.). GPNMB (also called Osteoactivin) is a transmembrane protein, but is also localized in the phagosome and can also be secreted, and might have different functions in GAMs and in the tumor. Ripollet al., have shown that GPNMB acts as a negative regulator of pro-inflammatory macrophage activation in
RAW264.7 cells [49]. Thus, highGPNMBexpression in GAMs could participate in the modu-lation of the pro-tumorigenic phenotype of GAMs. Furthermore, GPNMB has been shown to inhibit T cell activation via direct cell-cell interaction of antigen-presenting cells and T cells, and could thus contribute to the immunosuppressive milieu in gliomas [50,51,52]. Finally, anti-Gpnmb antibodies conjugated with a cytotoxic agent are under investigation for the treat-ment of malignant glioma, breast cancer, and cutaneous melanoma [53,54,55].
Furthermore, we found that GAMs highly expressSPP1. SPP1 (also called Osteopontin) is a secreted protein that has been postulated to increase tumor cell invasionin vivoand migration
in vitro, and was found to be highly expressed in different types of cancers, such as lung cancer, ovarian cancer, and also glioma [56,57,58,59,60,61]. Furthermore, SPP1 has recently been iden-tified as a ligand for CD44. SPP1-CD44 interaction was shown to increase stemness of CD44-expressing glioma-initiating cells [62]. Here we show that GAMs and not other cells of the tumor microenvironment are the predominant source forSPP1expression in glioma.
Two studies have previously performed screens of freshly-isolated GAMs. We used these data sets to investigate the expression ofGpnmb, Spp1, Il1rn, Isg20, Cxcr4, Tgfbi, andClec7ain these studies (S6 Table). Huanget al., performed a screen of mouse GFP+chimeric GL261-as-sociated and naïve (also isolated from the brain) bone-marrow-derived myeloid cells. However, using this approach they did not target the brain-resident microglia population that is also present in the tumor (Data set: E-GEOD-38283) [63]. All of the investigated genes, except
Cxcr4, were also upregulated in our screen–however to a lesser degree. This was partially due to an already high expression in the control cells. Furthermore, Muratet al., performed a mi-croarray experiment on a paired sample of human GAMs and whole tumor lysate from the same patient (Data set: GSE16119) [64]. All of the 7 genes were higher expressed in GAMs when compared to the whole tumor lysate. However, it should also be noted that the whole tumor lysate was not depleted of GAMs.
Taken together, our findings show that GAMs are polarized toward a phenotype that has only partial overlap with the M1 or M2a, M2b, and M2c phenotypes. Furthermore, we identi-fied GAMs as the predominant source for the pro-tumorigenic proteinsGPNMBandSPP1in murine and human malignant glioma–highlighting the importance of macrophages and microglia as therapeutic targets in anti-tumor treatment regimens.
Supporting Information
S1 Fig. GSEA analysis of the M1/M2a,b,c data sets against our GAMs data set.We
per-formed GSEA analysis of>2 fold up- and downregulated genes in M1/M2a,b,c vs. M0
S2 Fig. The expression levels of six additional glioma-regulated genes.The expression of
Cd300lf, Cd200r4, Trem1, Sh2d1b1, Creb5, andUck2in flow-sorted glioma-associated micro-glia and macrophages/monocytes isolated from mouse GL261 and RCAS-PDGFb tumors. (TIF)
S3 Fig.GPNMBandSPP1expression in CD11b+and paired CD11b-fractions isolated
from human GBM samples. (TIF)
S4 Fig. Kaplan-Meier curves of TCGA data of patients with high, intermediate, and low GPNMBorSPP1expression.
(TIF)
S1 Table. Primer sequences that were used for mouse and human qRT-PCRs and genera-tion of nested amplicons.
(TXT)
S2 Table. List of all significantly up- and downregulated genes. (XLSX)
S3 Table. Results of the WGCNA analysis.A list of all 10,875 genes that were used for WGCNA analysis and the corresponding modules they were clustered into.
(XLSX)
S4 Table. All genes that were included in the overrepresented GO terms of the GAMs set. (XLSX)
S5 Table. Results of the Cox proportional hazards regression model of the TCGA data for GPNMBandSPP1.
(DOCX)
S6 Table. Comparison with other screens on GAMs.The expression values ofGpnmb, Spp1,
Il1rn, Isg20, Clec7a, Tgfbi, andCxcr4in our microarray screen and in two studies that per-formed microarrays on GAMs are listed [63,64].
(DOCX)
Acknowledgments
We thank Regina Piske for technical assistance. The authors also thank Dr. Hans-Peter Rahn and Jennifer Powers for FACS sorting experiments and Dr. Andreas Busjahn for help with statistical analysis.
Author Contributions
Conceived and designed the experiments: FS HK SAW DH HWB. Performed the experiments: FS AP XF DM MS. Analyzed the data: FS AP IRH XW BJE TL DH HWB. Contributed re-agents/materials/analysis tools: HK DH TL DM MS HWB. Wrote the paper: FS AP IRH XW DH HWB TL SAW HK.
References
1. Wen PY, Kesari S (2008) Malignant gliomas in adults. The New England journal of medicine 359: 492– 507. doi:10.1056/NEJMra0708126PMID:18669428
3. Phillips HS, Kharbanda S, Chen R, Forrest WF, Soriano RH, et al. (2006) Molecular subclasses of high-grade glioma predict prognosis, delineate a pattern of disease progression, and resemble stages in neurogenesis. Cancer cell 9: 157–173. PMID:16530701
4. Sottoriva A, Spiteri I, Piccirillo SG, Touloumis A, Collins VP, et al. (2013) Intratumor heterogeneity in human glioblastoma reflects cancer evolutionary dynamics. Proceedings of the National Academy of Sciences of the United States of America 110: 4009–4014. doi:10.1073/pnas.1219747110PMID: 23412337
5. Patel AP, Tirosh I, Trombetta JJ, Shalek AK, Gillespie SM, et al. (2014) Single-cell RNA-seq highlights intratumoral heterogeneity in primary glioblastoma. Science.
6. Charles NA, Holland EC, Gilbertson R, Glass R, Kettenmann H (2011) The brain tumor microenviron-ment. Glia 59: 1169–1180. doi:10.1002/glia.21136PMID:21446047
7. Kerber M, Reiss Y, Wickersheim A, Jugold M, Kiessling F, et al. (2008) Flt-1 signaling in macrophages promotes glioma growth in vivo. Cancer research 68: 7342–7351. doi: 10.1158/0008-5472.CAN-07-6241PMID:18794121
8. Watters JJ, Schartner JM, Badie B (2005) Microglia function in brain tumors. Journal of neuroscience research 81: 447–455. PMID:15959903
9. Gabrusiewicz K, Ellert-Miklaszewska A, Lipko M, Sielska M, Frankowska M, et al. (2011) Characteris-tics of the alternative phenotype of microglia/macrophages and its modulation in experimental gliomas. PloS one 6: e23902. doi:10.1371/journal.pone.0023902PMID:21901144
10. Li W, Graeber MB (2012) The molecular profile of microglia under the influence of glioma. Neuro-oncol-ogy 14: 958–978. doi:10.1093/neuonc/nos116PMID:22573310
11. Markovic DS, Vinnakota K, Chirasani S, Synowitz M, Raguet H, et al. (2009) Gliomas induce and ex-ploit microglial MT1-MMP expression for tumor expansion. Proceedings of the National Academy of Sciences of the United States of America 106: 12530–12535. doi:10.1073/pnas.0804273106PMID: 19617536
12. Vinnakota K, Hu F, Ku MC, Georgieva PB, Szulzewsky F, et al. (2013) Toll-like receptor 2 mediates microglia/brain macrophage MT1-MMP expression and glioma expansion. Neuro-oncology 15: 1457– 1468. doi:10.1093/neuonc/not115PMID:24014382
13. Kees T, Lohr J, Noack J, Mora R, Gdynia G, et al. (2012) Microglia isolated from patients with glioma gain antitumor activities on poly (I:C) stimulation. Neuro-oncology 14: 64–78. doi:10.1093/neuonc/ nor182PMID:22015597
14. Markovic DS, Vinnakota K, van Rooijen N, Kiwit J, Synowitz M, et al. (2011) Minocycline reduces glio-ma expansion and invasion by attenuating microglial MT1-MMP expression. Brain, behavior, and im-munity 25: 624–628. doi:10.1016/j.bbi.2011.01.015PMID:21324352
15. Pyonteck SM, Akkari L, Schuhmacher AJ, Bowman RL, Sevenich L, et al. (2013) CSF-1R inhibition al-ters macrophage polarization and blocks glioma progression. Nature medicine 19: 1264–1272. doi:10. 1038/nm.3337PMID:24056773
16. Sarkar S, Doring A, Zemp FJ, Silva C, Lun X, et al. (2014) Therapeutic activation of macrophages and microglia to suppress brain tumor-initiating cells. Nature neuroscience 17: 46–55. doi:10.1038/nn. 3597PMID:24316889
17. Mantovani A, Sica A, Sozzani S, Allavena P, Vecchi A, et al. (2004) The chemokine system in diverse forms of macrophage activation and polarization. Trends in immunology 25: 677–686. PMID: 15530839
18. Umemura N, Saio M, Suwa T, Kitoh Y, Bai J, et al. (2008) Tumor-infiltrating myeloid-derived suppressor cells are pleiotropic-inflamed monocytes/macrophages that bear M1- and M2-type characteristics. Journal of leukocyte biology 83: 1136–1144. doi:10.1189/jlb.0907611PMID:18285406
19. Zhang L, Alizadeh D, Van Handel M, Kortylewski M, Yu H, et al. (2009) Stat3 inhibition activates tumor macrophages and abrogates glioma growth in mice. Glia 57: 1458–1467. doi:10.1002/glia.20863 PMID:19306372
20. Sica A, Schioppa T, Mantovani A, Allavena P (2006) Tumour-associated macrophages are a distinct M2 polarised population promoting tumour progression: potential targets of anti-cancer therapy. Euro-pean journal of cancer 42: 717–727. PMID:16520032
21. Ye XZ, Xu SL, Xin YH, Yu SC, Ping YF, et al. (2012) Tumor-associated microglia/macrophages en-hance the invasion of glioma stem-like cells via TGF-beta1 signaling pathway. Journal of immunology 189: 444–453. doi:10.4049/jimmunol.1103248PMID:22664874

![Fig 3. Comparison of GAMs with data sets of M1, M2a,b,c-stimulated macrophages. We retrieved data sets from http://www.ebi.ac.uk/arrayexpress (Data set: E-GEOD-32690; [44]), containing data of](https://thumb-eu.123doks.com/thumbv2/123dok_br/17166243.240996/15.918.302.661.109.896/comparison-gams-stimulated-macrophages-retrieved-arrayexpress-geod-containing.webp)