1JHU/APL, Laurel, MD 20723-6099, USA
2Space Sciences Laboratory, UCB, Berkeley, CA, USA 3CESR, BP4346, 31028 Toulouse Cedex 4, Toulouse, France 4University of New Hampshire, Durham, NH, USA
5Space Science and Technology Department, RAL, Chilton, Didcot, Oxfordshire OX11 0QX, UK 6Swedish Institute of Space Physics, Uppsala Division, 755 91 Uppsala, Sweden
7LANL, MS D466, Los Alamos, NM, USA
Received: 4 December 2006 – Revised: 6 April 2007 – Accepted: 13 April 2007 – Published: 8 May 2007
Abstract. A close conjunction of several satellites (LANL, GOES, Polar, Geotail, and Cluster) distributed from the geo-stationary altitude to about 16REdownstream in the tail
oc-curred during substorm activity as indicated by global au-roral imaging and ground-based magnetometer data. This constellation of satellites resembles what is planned for the THEMIS (Time History of Events and Macroscopic Inter-actions during Substorms) mission to resolve the substorm controversy on the location of the substorm expansion onset region. In this article, we show in detail the dipolarization and dynamic changes seen by these satellites associated with two onsets of substorm intensification activity. In particular, we find that dipolarization at∼16REdownstream in the tail
can occur with dawnward electric field and without plasma flow, just like some near-Earth dipolarization events reported previously. The spreading of substorm disturbances in the tail coupled with complementary ground observations indi-cates that the observed time sequence on the onsets of sub-storm disturbances favors initiation in the near-Earth region for this THEMIS-like conjunction.
Keywords. Magnetospheric physics (Magnetospheric con-figuration and dynamics; Magnetotail; Storms and sub-storms)
1 Introduction
Magnetospheric substorms exhibit impulsive energy release in many regions within the magnetosphere. One outstand-ing fundamental question is the location of the process re-sponsible for substorm expansion onset. One school of
Correspondence to:A. T. Y. Lui ([email protected])
thought proposes the initiation location to be in the near-Earth region about 6 to 15RE downstream in the tail (Lui,
1991, 2004; Roux et al., 1991; Cheng and Lui, 1998; Pu et al., 1999, 2001; Cheng, 2004). Another school pro-poses the initiation location to be in the mid-tail region about 20 to 30RE (Haerendel, 1992; Shiokawa et al., 1997,
1998; Nagai et al., 1998). Seeking an answer to this con-troversy is the central focus of the NASA mission called Time History of Events and Macroscale Interactions during Substorms (acronym THEMIS) (http://sprg.ssl.berkeley.edu/ themis/about themis.html). THEMIS is designed to have five spin-stabilized satellites aligned nearly along the tail axis at downstream distances from about 10 to 30REsuch that the
origin of substorm onset disturbances may be pinned down. It also has complementary ground-station observations of au-roral activity (Donovan et al., 2006). With the multiple satel-lites in operation during the International Solar Terrestrial Physics (ISTP) era, there are intervals of satellite conjunction that mimic to some degree the satellite constellation desired by the THEMIS mission (e.g., Lui et al., 2000; Sergeev et al., 2005). These intervals may be considered as a prelude to the events that would be examined in detail by THEMIS.
In this paper, we investigate in detail one substorm interval on 8 August 2003 when several satellites spanning from the geostationary altitude to∼16RE downstream in the
1002 A. T. Y. Lui et al.: Tail conjunction study
Fig. 1.The AU (upper) and AL (lower) indices on 8 August 2003 and the sequence of global auroral images from TIMED as it crossed over each polar region.
conjunction interval. Since there was rather continuous mag-netic activity on the ground, these two onsets may be inten-sifications of the ongoing substorm activity. From the time sequence of activity onset at various locations in the magne-totail and on the ground, we have found evidence from the observations that favors the onset location to be in the near-Earth region for these two activity onsets.
2 Observations
2.1 Ground activity
The ground magnetic activity on 8 August 2003 indicated by the AU/AL indices and the global auroral images from TIMED/GUVI are shown in Fig. 1. The time interval of fa-vorable satellite conjunction is between 04:00 and 06:00 UT.
There is a noticeable enhancement of the auroral electrojet strength around 04:20 UT, leading to a minimum AL index at∼05:20 UT. The global auroral distribution observed by
the TIMED/GUVI imager is shown below the AU/AL panel. The GUVI images are constructed from the LBH-short band emission data from horizon-to-horizon sweeps as the satel-lite crosses the polar region. The time given at each image panel corresponds to the center time of the image construc-tion and the notaconstruc-tions North and South denote the Northern and the Southern Hemispheres, respectively. This sequence of images indicates several substorm disturbances. In par-ticular, the image at 04:44 UT (the second image from the left in the bottom row) shows that substorm expansion had already started at that time.
Fig. 2. The X-component of magnetic field from ground-based magnetometers. The bottom plot contains the same set of mag-netic stations with the same vertical scale but for a shorter time span (04:00–06:00 UT).
activity began in magnetic local time. In this figure that shows the X-component from several stations (H-component for LRV), the local magnetic midnight for each station is in-dicated by the triangular symbol below the reference dashed line for the corresponding trace. Magnetic disturbances in the ∼04:00–06:00 UT interval were first recorded by the
LRV station located in the post-midnight sector, followed by the PBQ station located very close to midnight, and then by the FCC, YKC, and BLC stations located in the pre-midnight sector. This temporal development indicates that the activity started in the post-midnight sector first, fol-lowed by activity at the pre-midnight sector. More specif-ically, the H-component of LRV showed a relatively sharp decrease at∼04:27 UT, followed by a noticeable
intensifi-cation at∼05:04 UT. Since the second intensification rose
above the previous activity at∼500 nT level, the onset of
this intensification is likely to be earlier than ∼05:04 UT.
The X-component of NAQ did not show a significant per-turbation corresponding to the first intensification at LRV (probably due to the high magnetic latitude of NAQ at that magnetic local time), but detected the second intensification at∼05:03 UT. At PBQ situated near the magnetic midnight
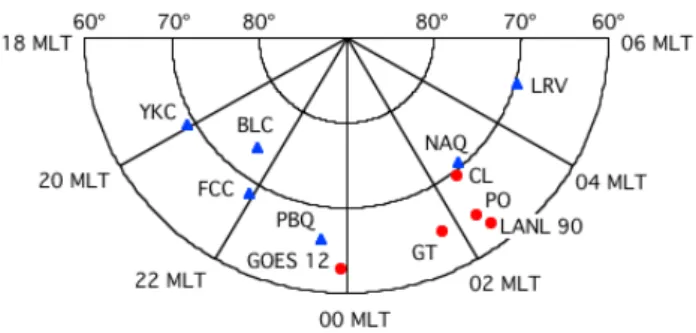
Fig. 3. The location of several satellites in the magnetotail during this substorm activity interval. The length of the trace associated with each satellite symbol represents the distance traveled by the satellite in 1-h interval after the epoch time of 05:00 UT on 8 August 2003.
and at a lower latitude than both LRV and NAQ, there were two relatively sharp decreases in the X-component, one at
∼04:49 UT and the other at∼05:05 UT. The X-component
of FCC showed a gradual decrease at∼04:48 UT, followed
by a sharp one at ∼05:02 UT. The sharp decrease at FCC
was accompanied by a similar sharp decrease of the YKC X-component at∼05:04 UT but a more gradual decrease at
BLC X-component followed by a sharper one at∼05:22 UT.
Onset of substorm intensification in the post-midnight sector during this interval is supported by observation of an auroral intensification in the post-midnight sector at∼04:48 UT by
the VIS Earth camera on Polar (at∼6 min time resolution,
courtesy of J. B. Sigwarth; data not shown here).
From these magnetic disturbance onsets on the ground and TIMED GUVI as well as Polar VIS data, it is clear that there was rather continuous substorm activity during this period. However, it can also be recognized that there were at least two onsets of substorm intensification recorded by more than one magnetic station on the ground. These times are 04:48– 04:49 UT and 05:02–05:05 UT, with the first activity concen-trated mostly in the post-midnight sector and the second one covering both the pre-midnight and post-midnight sectors. These intensifications are separated by∼13–16 min apart.
2.2 Magnetotail activity
1004 A. T. Y. Lui et al.: Tail conjunction study
Fig. 4.The magnetic field line projections of satellites based on the T96 magnetic field model to show their footprints with respect to several ground magnetic stations. The station locations are marked with solid triangles and the satellite footprints are marked with solid circles.
Polar, Geotail, and Cluster. In order to relate magnetotail activity from these satellites to the ground activity, we have projected these satellite locations to the ground based on Tsy-ganenko magnetic field model (T96). Their locations relative to the ground stations are illustrated in Fig. 4.
Let us examine data from satellites at progressively further downstream distance in the magnetotail. Figure 5 shows en-ergetic electron data from six LANL satellites. In particular, LANL 1990-095 (the bottom panel), which was atYGSM∼–
3.8REin the post-midnight sector where the substorm
activ-ity first started as indicated on the ground, detected a small but significant injection occurring at∼04:29 UT, followed by
a prominent injection at∼04:54 UT. This second
intensifica-tion at LANL 1990-095 was also accompanied by slightly enhanced electron intensity at other geostationary satellites in the morning and post-midnight sectors (LANL-02A and LANL-01A). The time separation between these two injec-tions is ∼25 min, noticeably longer than the time
separa-tion of substorm intensificasepara-tions identified by more than one magnetic station on the ground. However, since LRV at the post-midnight sector registered the magnetic disturbance on-set at∼04:27 UT, the small injection at∼04:29 UT is
con-sistent with this activity onset and is probably spatially lo-calized such that other ground magnetic stations were not af-fected. The effect of the subsequent substorm intensification at∼04:48–04:49 UT was probably masked by the injection
at∼04:29 UT.
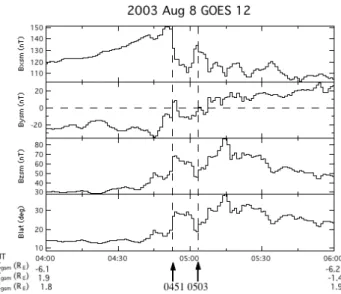
From magnetic field measurements shown in Fig. 6, GOES 12 atYGSM∼0.7REobserved a sharp dipolarization
at∼04:51 UT, followed by a short recovery and another
sig-nificant dipolarization at∼05:03 UT. These two
dipolariza-tions were separated in time by∼12 min, close to the time
separation of substorm intensifications on the ground. It may be noticed that the increase in theBzcomponent at GOES 12
started at∼04:40 UT. However, unlike the two
dipolariza-tions later, this increase in theBz component was transient
and weak. In addition, it was accompanied by an increase in theBx component indicative of a further increase in the
Fig. 5.The intensities of energetic electrons at several LANL geo-stationary satellites.
magnetic field energy at that location. Thus, the increase in theBz component at∼04:40 UT is not interpreted here as
a dipolarization onset. Another point worth noting is that there was no clear signature at GOES 12 corresponding to the 04:29 UT ground onset, indicating that the activity onset at 04:29 UT was quite localized.
Polar at this time was located at∼(−7.2, −4.7, 1.7)RE
in GSM coordinates. Polar observations of electric and magnetic fields given in Fig. 7 show entry to the central plasma sheet at ∼04:59 UT. Substorm disturbance
regis-tered at 04:48–04:49 UT on the ground (FCC and PBQ) only reached Polar at this late time possibly because Polar was quite far from the central plasma sheet. The entry was accompanied by intense and highly variable electric field. Upon entry, theBx component stayed at the same strength
for∼1 min before starting to decrease while theBz
compo-nent increased gradually. About 10 min later, Polar detected a sharp change in theBzcomponent at∼05:11 UT,∼12 min
after the plasma sheet entry. This time separation is close to the time separation of the two substorm intensifications on the ground.
Further downstream than Polar was Geotail, at ∼(–9.7,
–3.6, –0.8)REin GSM coordinates at this time. The plasma
Fig. 6.The magnetic field measurements from the GOES 12 satel-lite.
Fig. 7. The measurements from the Polar satellite. TheExy
com-ponent points tailward while theEzcomponent points northward.
increase in theBz component at∼04:57 UT. This increase
was accompanied by a noticeable decrease in the magnitude of theBx component and is thus interpreted as a small and
gradual dipolarization. This change was followed by a brief dropout and then detection of a significant dipolarization at
∼05:07 UT with accompanying decrease in the Bx
com-ponent. This dipolarization was associated with moderate
Fig. 8.The measurements from the Geotail satellite.
plasma flow, mainly field-aligned for thex-component, and highly variable magnetic and electric fields. The plasma flow was initially tailward at a slow speed (∼100 km/s) and then
switched to earthward at a faster speed (∼400 km/s). There
was a substantial duskward flow component at ∼300 km/s
that was mainly perpendicular to the magnetic field. The y-component of the electric field changed sign rapidly and fluctuated between about−7 mV/m and 13 mV/m during this
dipolarization. The time separation between these two dipo-larizations was∼10 min, also close to the time separation of
the two substorm intensifications on the ground.
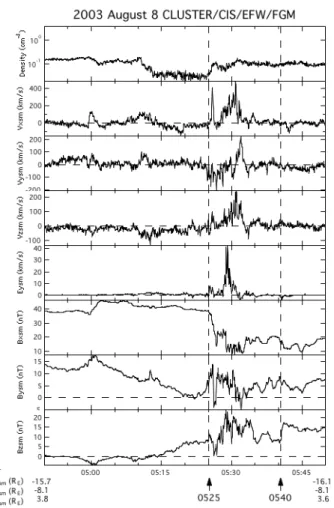
Cluster satellites were located at the furthest downstream distance of∼(–15.8, –8.1, 3.7)RE in GSM coordinates. The
Cluster measurements are given in Fig. 9. Since measure-ments from the four Cluster satellites were almost iden-tical (the separation distances between the satellites were
∼200 km), only the measurements from SAMBA (C3) are
shown. SAMBA observed a gradual increase in theBz
com-ponent at∼05:11 UT when it was in the plasma sheet
bound-ary layer. This increase was not accompanied by any signif-icant decrease in theBxcomponent and is thus not regarded
1006 A. T. Y. Lui et al.: Tail conjunction study
Fig. 9. Cluster measurements of plasma bulk flow from CIS/HIA (R`eme et al., 2001),y-component of the electric field from EFW (Gustafsson et al., 2001), and magnetic field from FGM (Balogh et al., 2001).
magnetospheric current elsewhere affecting the local mag-netic field. This change was later followed by an entry to the central plasma sheet at∼05:25 UT, similar to the sequence of
activity seen by Geotail. After the central plasma sheet entry, SAMBA detected moderate plasma flow and a very transient southward magnetic field at∼05:26 UT. Subsequent to these
activities, there was a distinct dipolarization at∼05:40 UT,
which is indicated by an increase in theBz component
ac-companied by a decrease in theBxcomponent. Interestingly,
there was no plasma flow activity and a dawnward compo-nent of the electric field (Ey=−3.7 mV/m) associated with
this significant change in the magnetic field. This is impor-tant as it indicates that local dipolarization can occur in the absence of plasma flow and dawnward electric field. These features have been observed in other dipolarization events in the near-Earth magnetotail (Lui et al., 1999). The time sep-aration between central plasma sheet entry and subsequent dipolarization is∼15 min, consistent with the time
separa-tion between the two substorm intensificasepara-tions noted on the ground.
2.3 Time line of activity
In the 2-h interval studied here, there were rather continuous magnetic and auroral activities. As a result, the substorm ex-pansion onset time is unclear. However, there were at least two significant intensifications registered by more than one ground magnetic station. The first one started in the late post-midnight sector at∼04:27 UT spreading to the midnight
sec-tor at∼04:48–04:49 UT. The second intensification occurred
at∼05:02–05:05 UT spanning the pre-midnight sector to the
post-midnight sector. The time sequence in the magnetotail is quite clear in spite of continuous substorm activity indi-cated by the ground magnetometers and by global auroral observations from satellites. For the first intensification at 04:48–04:49 UT, the time sequence is LANL90 – GOES 12 – Geotail – Polar – Cluster. For the second major intensifica-tion at∼05:02–05:05 UT, the time sequence is also LANL90
– GOES 12 – Geotail – Polar – Cluster. Time line of activity for these two intensifications is listed in Table 1.
3 Summary and discussion
3.1 Summary
We have examined a substorm interval on 8 August 2003 during which several satellites spanning the downstream dis-tance from∼6 to∼16RE in the magnetotail have detected
substorm activity for two intensifications. Based on ground magnetic stations, these intensifications were initiated in the post-midnight sector and spread into the pre-midnight sec-tor subsequently. Most of the satellites in the magnetotail (LANL 90, Polar, Geotail, and Cluster) were in the post-midnight sector. For the first minor intensification started at∼04:27 UT as indicated by the LRV magnetogram, the
time sequence of activity onset is LANL 90, GOES 12, Geo-tail, Polar, and Cluster. For the second major intensification, the first indication of activity came from a significant parti-cle injection detected by LANL 90 at∼04:54 UT. The time
sequence of activity is also LANL 90, GOES 12, Geotail, Polar, and Cluster.
3.2 Determination of the time sequence of substorm activ-ity
FCC and PBQ in the midnight sector over both the pre-midnight to post-midnight sectors
04:51 Sharp dipolarization at GOES 12 05:03 A significant dipolarization at GOES 12 04:57 Small dipolarization at Geotail 05:07 Dipolarization with significant plasma flow
and electric field at Geotail 04:59 Onset of large fluctuations in electric field at
Polar
05:11 Sharp dipolarization at Polar
05:25 Plasma sheet expansion and dipolarization with earthward plasma flow
05:40 Significant dipolarization without plasma flow at Cluster
Time sequence LANL90- GOES 12- Geotail- Polar-Cluster Time sequence LANL90- GOES 12- Geotail- Polar-Cluster
corrected geomagnetic latitude and longitude at 05:00 UT, LANL 90 is projected to (62.8◦, 34.8◦), GOES 12 is
pro-jected to (62.9◦, 356.2◦), Polar is projected to (64.5◦, 33.0◦),
Geotail is projected to (64.8◦, 23.0◦), and Cluster is projected
to (69.4◦, 35.5◦). This study emphasizes the important role
played by observations from ground-based magnetometers in sorting out the time sequence development.
If the time sequence of substorm disturbance were dom-inated by the magnetic local time, the expected time se-quence would be Cluster, LANL 90, Polar, Geotail, and GOES 12 for the substorm disturbance spreading from the post-midnight sector to the midnight sector. This clearly is not consistent with the observed time sequence. It is also not consistent with substorm disturbance spreading from the midnight sector to the post-midnight sector, based on the ground activity time sequence as well as the magnetotail ac-tivity onset sequence. On the other hand, if the time sequence were dominated by the magnetic latitude and starts from low latitude to high latitude, then the expected time sequence would be LANL 90, GOES 12, Polar, Geotail, and Clus-ter. The specific corrected geomagnetic latitudes for these satellites are 62.8◦for LANL 90, 62.9◦for GOES 12, 64.5◦
for Polar, 64.8◦for Geotail, and 69.4◦for Cluster. The
ob-served time sequence can be considered consistent with this if the order for Polar and Geotail is interchanged. This is not too surprising since the difference in the corrected geomag-netic latitude between Polar and Geotail is very small,∼0.3◦,
and the dipolarization has an irregular front based on multi-satellite observations (Lopez and Lui, 1990). Therefore, the observed time sequence shows that the substorm activities for the two intensifications are consistent with propagation dominated by magnetic latitude and proceeding from the low latitude, i.e., the near-Earth region, to the high latitude re-gion, i.e., the mid-tail region.
3.3 Other discriminating substorm features
Even though this study focuses mainly on dipolarization in the magnetotail for comparison with ground activity, the as-sociated parameters such as plasma flow and electric field in the magnetotail should be considered in differentiating the two substorm models. For the mid-tail initiation model, dipo-larization should be preceded by at least 1–2 min of signifi-cant earthward plasma flow to allow for the transit time for plasma flow to reach the near-Earth region and slow down to cause near-Earth dipolarization before the mid-tail dipo-larization. For this scenario, they-component of the electric field at the observing satellite location must be positive in or-der to carry the magnetic flux earthward. In Geotail for the dipolarization at∼05:07 UT, the plasma flow perpendicular
to the magnetic field had a largery-component than the x-component, thus deflecting the transport of magnetic flux in the dawn-dusk direction rather than in the earthward direc-tion. In addition, the electric field was intermittently dawn-ward instead of duskdawn-ward for earthdawn-ward transport of mag-netic flux. In Cluster for the dipolarization at∼05:40 UT,
there was no significant plasma flow and they-component of the electric field was negative (Ey=−3.7 mV/m). These
fea-tures are not consistent with earthward transport of magnetic flux.
3.4 Other possible interpretation of time sequence of sub-storm activity
One could in principle attempt to construct a different time sequence from the data. For example, one may assign dipo-larization at Geotail to be at∼04:45 UT and interpret the
1008 A. T. Y. Lui et al.: Tail conjunction study only with an earlier injection occurring at∼04:29 UT in the
LANL 90 data but also with the lack of an accompanying decrease in theBx component that implies decrease in the
cross-tail current related to dipolarization as well as with the lack of plasma flow.
Another attempt may be to disregard the first minor in-tensification at ∼04:27 UT since the particle injection at
LANL 90 was weak and interpret the second intensification at∼04:54 UT as the only activity onset. However, this
at-tempt would have difficulty in explaining the double activ-ity onsets separated by about 10–15 min apart at GOES 12, Polar, Geotail, and Cluster. Furthermore, considering the first intensification as a pseudobreakup is not consistent with the occurrence of the large magnetic perturbations at LRV at these times (∼400 nT at 04:27 UT and∼650 nT at 04:48 UT)
and the substantial auroral activity revealed by the TIMED image at 04:44 UT (second image in the bottom row of Fig. 1) as well as the auroral intensification at 04:48 UT seen by the VIS Earth camera on Polar as mentioned in Sect. 2.1. In terms of Cluster observations, one might pick the times of 05:14 and 05:25 UT to correspond to the two onsets of ground magnetic activity. However, this choice has difficulty. For example, there was no indication that Cluster entered the central plasma sheet at 05:14 UT (see the number density plot in Fig. 9). Furthermore, even if the earlier times were chosen, the time sequence of activity as tabulated in Table 1 would have remained the same. Therefore, the conclusion will not be altered by this change.
3.5 Spreading of substorm disturbance in the current dis-ruption model
Another point that warrants clarification is the spreading of dipolarization. In the current disruption model for substorms (Lui, 1991; Lui et al., 1991), a current-driven plasma instabil-ity disrupting the cross-tail current can instigate development of the same instability in adjacent regions of the tail, both tailward and dawnward/duskward sides of the current tion site. The rarefaction wave generated by a current disrup-tion site merely thins the adjacent plasma sheet and subse-quently enhances the cross-tail current density to establish a more favorable onset condition of the current-driven plasma instability. Whether the instability will indeed be initiated depends highly on the local conditions. When the instability threshold is reached, a certain amount of time is required for the instability to develop to the nonlinear stage so that sig-nificant current disruption and dipolarization can occur. This scenario thus expects a rather non-uniform spreading of dipo-larization region in the tail, as found by multi-satellite obser-vations (e.g., Lopez and Lui, 1990). Furthermore, this sce-nario can account for observations in which the plasma flow can deviate by a large angle from the normal of the dipolar-ization front as reported by Nakamura et al. (2002). Plasma flow is a result of force imbalance in current disruption and is not a direct cause of dipolarization. Therefore, the
spread-ing of dipolarization is expected to deviate from any wave speed or convection speed, as shown by several reports (e.g., Jacquey et al., 1991; Ohtani, 1993; Pu et al., 2001; Naka-mura et al., 2002). This is consistent with the finding that current disruption and dipolarization is a non-MHD process (Lui et al., 1999). Thus, relating convection and speed of various plasma waves to the averaged speed in the spreading of dipolarization is not meaningful.
3.6 Final remark
Finally, we emphasize that the present result does not dimin-ish the importance of the THEMIS mission in resolving the substorm onset problem since not all satellites in this study are in the equatorial plane like the THEMIS satellites. Not all satellites have identical data sets for the investigation. This study is also hampered by the lack of continuous coverage of global auroral and magnetic activities. These deficiencies make the analysis on the onset location of substorm activity difficult and the result less readily comprehensible. Further-more, this study on this single time interval does not neces-sarily represent other substorm intervals and may not provide compelling evidence for the origin of substorm disturbance location in the magnetotail. However, a collection of simi-lar events showing a simisimi-lar temporal trend for the spread-ing of substorm disturbance in the magnetotail would con-stitute convincing determination on the location of substorm activity onset. This study only provides a glimpse of what THEMIS might observe.
Acknowledgements. This work was supported by the NSF grant ATM-0630912 and NASA grant NNG04G128G to The Johns Hop-kins University Applied Physics Laboratory. We thank H. Singer for GOES 12 data and his comments on an earlier draft.
Topical Editor I. A. Daglis thanks two referees for their help in evaluating this paper.
References
Balogh, A., Carr, C. M., Acuna, M. H., et al.: The Cluster magnetic field investigation: overview of in-flight performance and initial results, Ann. Geophys., 19, 1207–1217, 2001,
http://www.ann-geophys.net/19/1207/2001/.
Cheng, C. Z.: Physics of substorm growth phase, onset, and dipo-larization, Space Sci. Rev., 113, 207–270, 2004.
Cheng, C. Z. and Lui, A. T. Y.: Kinetic ballooning instabil-ity for substorm onset and current disruption observed by AMPTE/CCE, Geophys. Res. Lett., 25, 4091–4094, 1998. Donovan, E., Mende, S., Jackel, B., et al.: The THEMIS all-sky
imaging array - system design and initial results from the pro-totype imager, J. Atmos. Solar Terr. Phys., 68(13), 1472–1487, 2006.
Lui, A. T. Y.: A synthesis of magnetospheric substorm models, J. Geophys. Res., 96, 1849–1856, 1991.
Lui, A. T. Y.: Potential plasma instabilities for substorm expansion onset, Space Sci. Rev., 113, 127–206, 2004.
Lui, A. T. Y., Chang, C.-L., Mankofsky, A., et al.: A cross-field current instability for substorm expansions, J. Geophys. Res., 96, 11 389–11 401, 1991.
Lui, A. T. Y., Liou, K., Nos´e, M., et al.: Near-Earth dipolariza-tion: Evidence for a non-MHD process, Geophys. Res. Lett., 26, 2905–2908, 1999.
Lui, A. T. Y., Liou, K., Newell, P. T., et al.: Conjunction of tail satel-lites for substorm study: ISTP event of 1997 January 2, Geophys. Res. Lett., 27, 1831–1834, 2000.
Lyons, L. R., Wang, C.-P., and Nagai, T.: Substorm onset by plasma sheet divergence, J. Geophys. Res., 108(A12), 1427, doi:10.1029/2003JA010178, 2003.
Nagai, T., Fujimoto, M., Saito, Y., et al.: Structure and dynamics of magnetic reconnection for substorm onsets with Geotail obser-vations, J. Geophys. Res., 103, 4419–4440, 1998.
Nakamura, R., Baumjohann, W., Klecker, B., et al.: Mo-tion of the dipolarizaMo-tion front during a flow burst event observed by Cluster, Geophys. Res. Lett., 29(20), 1942, doi:10.1029/2002GL015763, 2002.
craft ion measurements in and near the Earth’s magnetosphere with the identical Cluster ion spectrometry (CIS) experiment, Ann. Geophys., 19, 1303–1354, 2001,
http://www.ann-geophys.net/19/1303/2001/.
Roux, A., Perraut, S., Robert, P., et al.: Plasma sheet instability related to the westward traveling surge, J. Geophys. Res., 96, 17 697–17 714, 1991.
Sergeev, V. A., Kubyshkina, M. V., Baumjohann, W., et al.: Tran-sition from substorm growth to substorm expansion phase as ob-served with a radial configuration of ISTP and Cluster spacecraft, Ann. Geophys., 23, 2183–2198, 2005,
http://www.ann-geophys.net/23/2183/2005/.
Shiokawa, K., Baumjohann, W., and Haerendel, G.: Braking of high-speed flows in the near-Earth tail, Geophys. Res. Lett., 24, 1179–1182, 1997.