ДК 629.78; 630.52: 587/588
OPERATIONAL FOREST MONITORING IN SIBERIA
USING MULTI-SOURCE EARTH OBSERVATION DATA
© 2014 C. Hüttich1, M. A. Stelmaszczuk-Górska1, J. Eberle1, P. Kotzerke2, C. Schmullius1
1
Friedrich-Schiller University, Department of Earth Observation Löbdergraben, 32, Jena, 07743 Germany
2
GAF AG
Arnulfstrasse, 199, Munich, D-80634 Germany
E-mail: [email protected], [email protected], [email protected], [email protected], [email protected]
Received 04.09.2014
Forest cover disturbance rates are increasing in the forests of Siberia due to intensification of human activities and climate change. In this paper two satellite data sources were used for auto-mated forest cover change detection. Annual ALOS PALSAR backscatter mosaics (2007–2010) were used for yearly forest loss monitoring. Time series of the Enhanced Vegetation Index (EVI, 2000–2014) from the Moderate Resolution Imaging Spectroradiometer (MODIS) were in-tegrated in a web-based data middleware system to assess the capabilities of a near-real time de-tection of forest disturbances using the break point dede-tection by additive season and trends (Bfast) method. The SAR-based average accuracy of the forest loss detection was 70 %, whereas the MODIS-based change assessment using breakpoint detection achieved average ac-curacies of 50 % for trend-based breakpoints and 43.4 % for season-based breakpoints. It was demonstrated that SAR remote sensing is a highly accurate tool for up-to-date forest monitoring. Web-based data middleware systems like the Earth Observation Monitor, linked with MODIS time series, provide access and easy-to-use tools for on demand change monitoring in remote Siberian forests.
Keywords: remote sensing, SAR, MODIS, time series, forest change monitoring, near-real time.
INTRODUCTION
In order to mitigate the consequences of cli-mate change caused by land use change, it is important to improve information on the terres-trial distribution of carbon sources and sinks. This can be provided through accurate and reli-able vegetation cover change monitoring. Due rapid rates of change and vast area of land cover, remote sensing techniques are increas-ingly proposed as globally consistent environ-mental monitoring tools (Cihlar et al., 2002). Remote sensing acquires data over large areas with high repetition frequency, and at a rela-tively low cost. These techniques are recom-mended for forest monitoring to inform interna-tional climate policy and related internainterna-tional programs (e. g., REDD; Reduced Emissions from Deforestation and Forest Degradation),
and initiatives (e. g., ALOS K&C; ALOS Kyoto & Carbon Initiative and GFOI; Global Forest Observations Initiative). Remote sensing has already been demonstrated to be capable of con-tributing to the current and future measurement and monitoring of carbon sources and sinks, through its ability to provide systematic, glob-ally consistent estimates of land cover (LC), land cover change (LCC), forest disturbances, and aboveground biomass (AGB). Multiple publications are available on optical, radar, as well as LiDAR (Light Detection and Ranging) EO (earth observation) data for LCC and bio-mass estimation.
39 of the world’s boreal forests from 2000 to 2007 (Pan et al., 2011). At the same time, they also provide the largest source of uncertainty in global carbon stock calculations (Pan et al., 2011). Moreover, tree cover loss in the Russian Federation from 2000 to 2012 was the highest in the world, totaling more than 5 million hectares in the year 2012 alone (Hansen et al., 2013). This tree cover loss is mainly due to fires, which are the biggest overall cause of forest loss in boreal ecosystems. Fires are a particularly dam-aging form of disturbance in the Russian boreal forest. This is because conifers dominate and most of the forest is unmanaged and unprotected (Shvidenko et al., 2011). Current model predic-tions indicate that the number of fire events in the boreal zone may double by the end of 2100 (Shvidenko et al., 2011). Illegal logging also poses a huge problem for the monitoring of Russian forests. According to established sources like World Wide Fund for Nature (WWF) Russia and the World Bank, illegal clear-cutting in Rus-sia is estimated to account for approximately 25 % of all logging activity in this country (WWF, 2014). Moreover, due to the lack of funding for monitoring efforts, some forested regions in Siberia have not been inventoried for more than 25 years (Hüttich et al., 2014a).
The number and availability of Earth Obser-vation (EO) resources is continuously increas-ing. Interactive and interoperable access to sat-ellite time series data is increasing, as demon-strated by various EO data infrastructure pro-jects, such as the Siberian Earth System Science Cluster (SIBESSC, Eberle et al., 2013a), NASA Giovanni (Acker & Leptoukh, 2007), and the Earth Observation Monitor (EOM, Eberle et al., 2013b). The application of data middleware sys-tems enables operational monitoring of remote forest territories in a near real-time mode, as shown for Central Siberia (Hüttich et al., 2014b). User-friendly clients for accessing and analyzing operational frequently updated EO time series provide opportunities for the moni-toring of forest disturbances and dynamics. In order to quantify the accuracy of both spatial and temporal high resolution forest disturbance monitoring techniques further research has to be focused on the integration of multi-source change detection techniques.
The objective of this paper is to analyze multi-source optical and Synthetic Aperture Ra-dar (SAR) EO data for forest disturbance moni-toring for a test site in Central Siberia. In order to evaluate the capabilities of selected opera-tional satellite data products for forest change monitoring, two operational satellite data sources were analyzed with a focus on forest loss. Forest loss is defined as a disturbance, or a change from forest to a non-forest stage without tree cover.
ALOS PALASAR data with the high spatial resolution of 25 m were used for the application and assessment of pre-classification change de-tection techniques for assessing the yearly ex-tent of forest loss. Further, time series of the Enhanced Vegetation Index (EVI) with a tem-poral resolution of 16 days (2000–2014) from the Moderate Resolution Imaging Spectral Ra-diometer (MODIS) were integrated in a web-based data middleware system. Using the Earth Observation Monitor (EOM, www.earth-observation-monitor.net) an operational moni-toring system was used for assessing for the ca-pabilities of a near-real time detection of bio-mass loss in the forest ecosystem of Central Si-beria, and to analyze temporal patterns of forest cover loss related to logging activities, fire events or other disturbances.
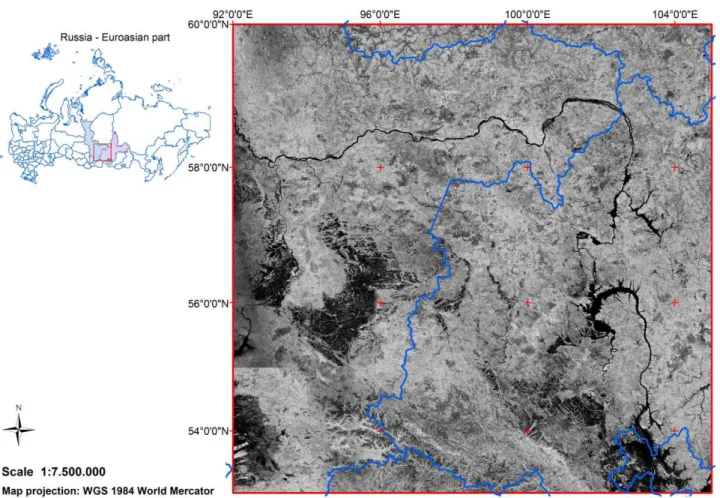
STUDY AREA
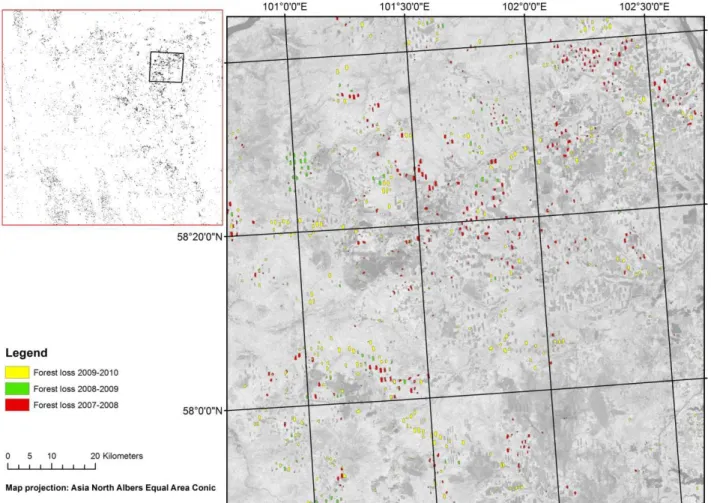
The study area is located in the Asian part of the boreal forest, in southern Central Siberia (Fig. 1). The area covers approximately 620 000 km2 (longitude: 92–105° E; latitude: 53–60° N) and belongs to two Siberian Federal districts: Krasnoyarsk territory and Irkutsk region.
source: World Meteorological Organization). The study area is covered mainly by forest; for-est cover is approximately 70 % (based on Land Cover Map for Central Siberia (2010) © IKI, ZAPÁS project). The main dominant species in the study area are spruce (Picea), pine (Pinus), fir (Abies), and larch (Larix). Deciduous species are also present, mainly birch (Betula), aspen, and poplar (Populus), which are typical for early succession stages of such forests. These forests are hardly managed or protected, leading it to suffer disturbances such as wild fires, log-ging, and insect outbreaks (Schmullius et al., 2001; Shvidenko et al., 2011).
DATA
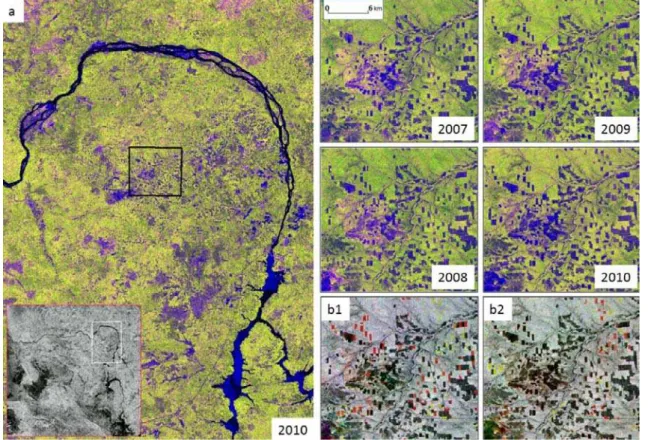
ALOS PALSAR backscatter mosaic data. For the forest loss detection ALOS PALSAR yearly backscatter mosaics with a 25 m spatial resolu-tion were used. The data were acquired using L-band frequency in the Fine Beam Double (FBD)
mode in two polarizations, horizontal ted and received (HH) and horizontal transmit-ted and vertical received (HV), with a 34.3° in-cidence angle, from May to October for the years from 2007 to 2010. The data were avail-able through the ALOS K&C Initiative led by the Japan Aerospace Exploration Agency (JAXA). An example of an RGB composite of PALSAR mosaic for the selected area with clearly visible clear-cuts is shown in Fig. 2.
For Siberian test sites, a total of 364 of 1 degree tiles were delivered as level 1.5 data, which means radiometrically, slope-corrected, and orthorectified SAR amplitude data (Shimada et al., 2009; Shimada, 2010). Accord-ing to Shimada et al. (2009) visible artifacts and unusual backscatter values were set to no data (< –34 dB HV / < –32 dB HH). The upper limit of the backscattering coefficient was +8 dB for both polarizations. The obtained data were con-verted from digital number (DN) into normal-ized radar cross section (NRCS) on the dB scale, according to the equation:
41 σ0
[dB] = 10 × log10 (DN2) + CF, (1) where σ0 is the backscattering coefficient (sigma nought) on the logarithmic scale, DN represents amplitude value, and CF is a calibration con-stant, which in this case is equal to –83 dB.
Optical satellite data. In addition to the SAR products, data acquired by optical sensors were also used. Landsat-5/-7 data with less than 10 % cloud cover for 2007–2010 were available via the United States Geological Survey (USGS) Earth Explorer portal. The MODIS Vegetation Continuous Fields (VCF; Collection 5) were downloaded from the Global Land Cover Facil-ity portal (GLCF). In addition, very high resolu-tion KOMPSAT-2 data were available through the European Space Agency CAT1 project (ID 13300). The data were used as reference LC in-formation for validation.
MODIS time series were retrieved from USGS and integrated in the Earth Observation Monitor. The NASA MODIS MOD13 standard vegetation indices (VI) products include the normalize difference vegetation index (NDVI) and the enhanced vegetation index (EVI) to ef-fectively characterize bio-physical/ biochemical
states and processes from vegetated surfaces. There exists a complete, global time series re-cord of 6 VI products from each of the Terra and Aqua MODIS sensors, at varying spatial (250 m, 1 km, 0.05°) and temporal (16-day, monthly) resolutions to meet the needs of the research and application communities. For this study the MODIS EVI product with 250 m spa-tial resolution was used.
METHODS
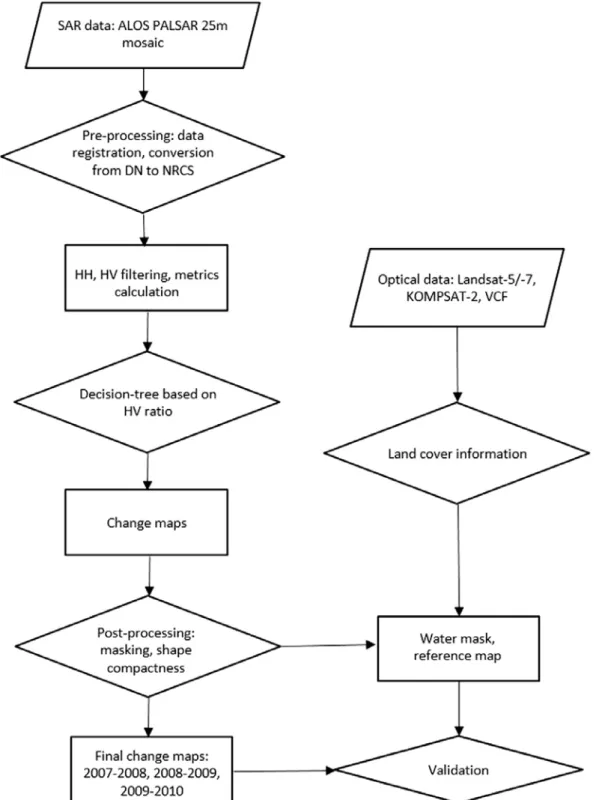
Forest loss monitoring using ALOS PALSAR data. A number of methods exist for forest mapping and change monitoring. In general, these methods can be grouped into post- and pre-classification techniques (Coppin et al., 2004). The first group of methods compare clas-sification products either on the pixel, or seg-ment level, with changes detected based on sta-tistical analyses. The advantage of this approach is that not only change or no-change areas are detected, but also the type and direction of changes. However, the drawback is that the quality of the final change detection product de-pends on the accuracy of individual
tions. Unlike the post-classification method, the pre-classification technique employs unclassi-fied images. Methods used to identify change areas include image differencing or rationing, bi-temporal linear data transformation (principal component analysis; PCA; multivariate altera-tion detecaltera-tion; MAD), image regression, and Change Vector Analysis; CVA (Coppin et al., 2004). Using the differencing approach, the ALOS PALSAR HH and HV-backscatter change was reported to be between 2 and 3 decibels; dB (e. g., Fransson et al., 2007; Santoro et al., 2010). Implementing HH, HV, HH/HV ratio, and HH-HH images difference maps, Dong et al. (2012) developed a decision tree algorithm to produce ALOS PALSAR-based forest maps for southeast Asia, with a high reported overall accuracy of 86 %.
In this study for a forest loss monitoring a pre-classification approach with a decision-tree classifier was implemented. Due to the short duration of the dataset, only changes from forest to non-forest were considered. In order to iden-tify common classification thresholds different multi-temporal metrics were used. First the PALSAR mosaics were filtered by applying temporal and spatial filters. A multi-temporal filter averaging intensity values in a local win-dow around each pixel in each image was used (Quegan & Yu, 2001). The window size for the filtering was calculated using the equivalent number of looks (ENL):
2
(mean) ENL
variance
. (2)
The higher ENL, the smaller is the scattering caused by speckle or image noise and the better is reduction of speckle effect (Quegan et al., 2000; Yu et al., 2008). As a trade of between resolution and information loss a 7 × 7 filter window size was selected. All available mosaics in HH and HV polarization were used for the filtering process.
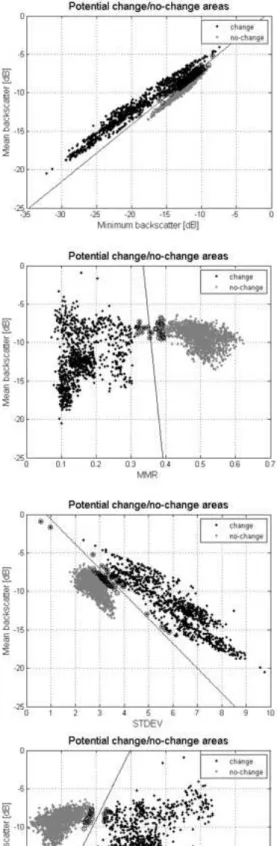
After filtering, the multi-temporal metrics were employed (Bruzzone et al., 2004). They compare the single pixel values over all annual mosaics. In total eight multi-temporal metrics were calculated: minimum backscatter, maxi-mum difference, maximaxi-mum-minimaxi-mum ratio (MMR), standard deviation, saturation,
normal-ized standard deviation, mean average variabil-ity (MVA), and logarithmic measure based on normalized standard deviation (LMNSTDEV) (Fig. 3).
The largest class separability was calculated for HV-polarization. This observation is in agreement with the previous results (Santoro et al., 2009, 2012; Morel et al., 2011) that the ALOS PALSAR data in HV polarization are more sensitive to detect forest change compar-ing with HH polarization. The forest to non-forest change thresholds were detected using non-parametric support vector machines (SVM). This approach employs the statistical distribu-tion of the data values to create hyperplane, which is aplane that separates the dataset into defined number of classes. Samples of forest and non-forest areas were collected using Land-sat-TM images. The thresholds were derived by visual interpretation of the hyperplanes in the multi-temporal scatter plots. From the analysis of the plots it was concluded that the values of the mean backscatter and minimum backscatter were not suitable for forest change detection.
A clear threshold was observed using MMR, saturation, LMNSTDEV, and MVA. Maximum difference was also found to be a useful vari-able. For the final automatic yearly forest dis-turbances monitoring the pre-classification ap-proach based on a ratio was used according to the equation:
1 10
2
10 log ( )
, (3)
where σ1 and σ2 represent backscatter values of the year 1 and year 2, respectively.
43
4 , A
P (4) where A represents area, and P perimeter.
The accuracy of change classifications was assessed by comparing the change results with reference maps. Data from two consecutive years were used to check whether the change from forest to non-forest was correctly
classi-fied. The overall accuracy was calculated as a ratio of total number of correctly classified pix-els over the total number of pixpix-els using 50 ran-domly distributed points.
Operational forest monitoring using the Earth Observation Monitor (EOM). The Earth Observation Monitor (Eberle et al., 2013b) is a web-based data middleware system for land ob-servations. The geoportal functions as a
45 based visualization and analyses platform for selected EO time series form the MODIS data product line. The geoportal provides standard-compliant Web Services based on a Data Proc-essing Middleware (Eberle et al., 2013a) and statistical analysis and processing functions. Analyses tools comprise seasonal time series decomposition by moving averages, break point detection by additive season and trends (BFAST, Verbesselt et. al., 2010) and green-brown, analyzing trends and trend changes in gridded time series like from satellite observa-tions or climate model simulaobserva-tions (Forkel et al., 2013). BFAST integrates the decomposition of time series into trend, season, and remainder components with methods for detecting and characterizing change within time series. BFAST detects multiple abrupt changes in sea-sonal and trend components of the EVI time se-ries. In this study BFAST was applied on MODIS EVI time series from 2000 to 2014 to detect change events (break points) in the VI time series. The analyses were conducted
using the EOM date middleware by selecting a part of the study area for the high-resolution SAR-based forest loss detection. The BFAST output, a spatially explicit temporal information of change events (break points), was compared with local scale reference data on forest logging activities and the ALOS PALSAR forest loss mapping results. Areas were integrated in the cross-validation only where in both time series components (season and trend) a breakpoint oc-curred.
RESULTS AND DISCUSSION
ALOS PALSAR based forest loss detection. Resulting change map is given in Fig. 5. Changes were identified and validated using the ALOS PALSAR L-band data with 25 m spatial resolution and LC information extracted from the optical-based products. Analyzing the gen-erated maps, most of the forest loss can be ob-served in 2007–2008 and 2009–2010. This is reflected in the forest loss statistics presented in
Table 1. The forest loss area was compared with the freely available results of global forest loss obtained by Hansen et al. for the study area (Hansen et al., 2013). Hansen et al. defined the forest loss similarly as in this study as «a stand-replacement disturbance, or a change from a
forest to non-forest state». The global maps were created using Landsat data.
Hansen’s results showed the same trend as the present study, with the most forest loss tak-ing place in 2008 and 2010. However, the size of mapped areas of forest depletion differ by 1.997 km2 in 2008, 1.494 km2 in 2009, and 1.424 km2 in 2010, with larger areas identified in Hansen’s products. In particular the highest discrepancy, eight times difference, was ob-served in year 2009. The reason for the extreme difference may result from the Hansen’s annual product generation. The «Forest Loss Year» product is a disaggregation of total «Forest Loss» to annual time scales (Hansen et al., 2013), which may overestimate forest loss in case of years with less forest disturbances oc-curred. Most of the forest loss change for both studies was observed in the northeastern area of the Siberian study region.
The average accuracy for the present study was over 70 %. The highest validation result was obtained for the forest change analysis be-tween 2008 and 2009. This can be explained by
Table 1. Forest loss statistics based on ALOS-PALSAR and Landsat data
Years
Overall accuracy of forest
loss detec-tion, %
Forest loss,
km2
Forest loss
vs. forest cover, %
Forest loss by Hansen et al., 2013, km2
Forest loss by Hansen et al., 2013 vs. forest cover, % 2007–
2008
66 669 0.1 2.666 0.5
2008– 2009
76 212 0.04 1.706 0.3
2009– 2010
70 631 0.1 2.055 0.4
2007– 2010
– 1.512 0.24 6.427 1.2
47 the fact that the difference image between those years resulted in the least number of misclassifi-cations, meaning that the mosaics that were cre-ated used data acquired under similar weather conditions.
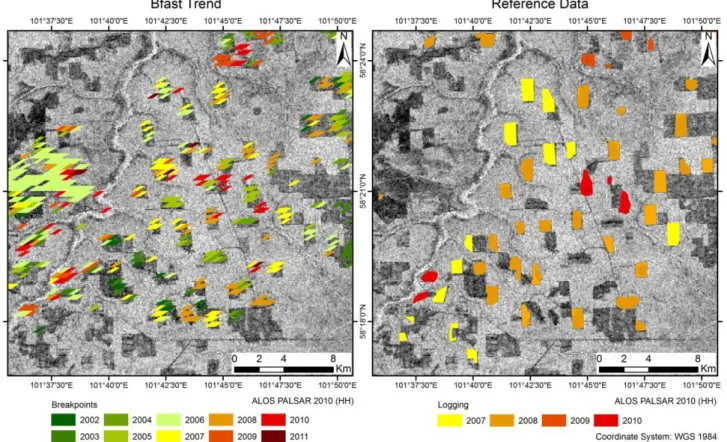
Operational MODIS-EVI-based breakpoint detection. Phenologically-driven land cover changes were mapped using the BFAST tool implemented into EOM data middleware. Hereby, only areas were selected as change pat-terns where in both time series components (trend and season) a minimum of one breakpoint occurred. The result was a map of change dates (breakpoint) indicating inter-annual dynamics of forest disturbances. Fig. 6 shows the change ar-eas detected between 2000 and 2014, compared to the ALOS PALSAR-based change areas and local scale forest inventory data.
The example from Abanskii region demon-strates that most of the forest disturbances were captured using the operational change monitor-ing method within EOM, e. g. a fire event was detected for 2006 and numerous clear cutting areas were detected between 2004 and 2011.
The breakpoints detected by EOM were cross-compared with the ALOS PALSAR based change areas and local forest inventory data. Fig. 6 shows a good agreement of MODIS and reference local scale forest disturbances. Most of the clear cuts were detected with the fully
automatic approach. A general agreement is visible by comparing the change event dates. A validation was conducted by selecting 100 ref-erence points within the local scale test sites. The breakpoints were cross-validated for the trend and the seasonal component.
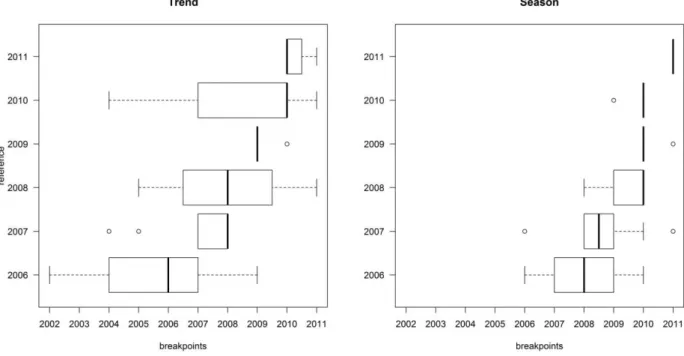
Fig. 7 visualizes the temporal match and scattering of the breakpoint detection for trend and season.
It is obvious that breakpoints derived with the trend component have a better temporal match rate than the season-based break points. Depending on the number of reference points per year the trend-based breakpoints show a high temporal variation (e. g. 2006, 2008, 2010), whereas the medial shows a good tempo-ral match. Breakpoints detected by the seasonal component show a general shift towards the ac-tual date. This is particularly visible for the early disturbances in 2006 and 2007.
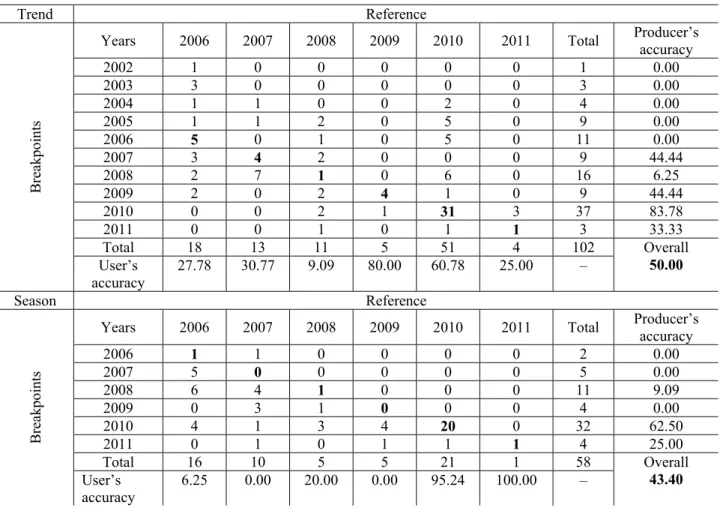
Despite the temporal mismatch, the seasonal breakpoints show a less distinct temporal vari-ability. The accuracy metrics prove this obser-vation (Table 2). The trend-based breakpoint detection achieved an overall accuracy of 50 %, while the season-based change detection shows an accuracy of 43.4 %.
The accuracies varied between the years. The best producer’s accuracy was detected for 2010. Due to a smaller number of reference points a
good user’s accuracy was also reached for 2009. Better matches of the trend-based break-points can be explained by the distinct detection of a phenology-driven decline of the EVI value within the EVI time series trend. The breakpoint will be assigned to the date where the land cover change occurred.
A different situation is apparent in the sea-sonal breakpoint detection. Due to a delayed temporal response on a seasonal level, the breakpoints were detected in one of the follow-ing seasons after the disturbance event which leads to a general delay of the change date de-tection towards the following years. The final result was based on a synergy of both break-point detection methods. The most reliable re-sult achieved the combination of the seasonal and the trend-based change date detection, as shown in Fig. 6.
CONCLUSIONS
Monitoring Russia’s forests is of a special in-terest due to the vast size of these forests. Since
traditional, ground-based methods cannot effi-ciently monitor changes over entire forest cover, remote sensing appears to be a suitable tool for operational forest monitoring.
This paper demonstrated the application of a SAR-based and an optical operational satellite data source for operational forest cover change monitoring. These datasets are operational and freely accessible through USGS (MODIS) or being released on annual basis by JAXA (ALOS PALSAR annual mosaics) and being integrated in geoportals focussing on multi-source forest monitoring (Hüttich et al., 2014b).
Firstly, it was demonstrated that SAR remote sensing data have a great potential for auto-mated large-scale forest change monitoring in the boreal zone in a high spatial resolution. Only SAR images can provide sufficiently regular data, due to the ability to operate and collect data under all weather and sunlight conditions. The results demonstrated great potential for L-band sensors using HV cross-polarization data for large-scale forest mapping, as was reported in previous studies (e. g. Santoro et al., 2012).
Table 2. Accuracy assessment for BFAST break point detection
Trend Reference
Years 2006 2007 2008 2009 2010 2011 Total Producer’s accuracy 2002 1 0 0 0 0 0 1 0.00 2003 3 0 0 0 0 0 3 0.00 2004 1 1 0 0 2 0 4 0.00 2005 1 1 2 0 5 0 9 0.00
2006 5 0 1 0 5 0 11 0.00
2007 3 4 2 0 0 0 9 44.44
2008 2 7 1 0 6 0 16 6.25
2009 2 0 2 4 1 0 9 44.44
2010 0 0 2 1 31 3 37 83.78
2011 0 0 1 0 1 1 3 33.33
Total 18 13 11 5 51 4 102
B
reak
poi
nt
s
User’s accuracy
27.78 30.77 9.09 80.00 60.78 25.00 –
Overall
50.00
Season Reference
Years 2006 2007 2008 2009 2010 2011 Total Producer’s accuracy
2006 1 1 0 0 0 0 2 0.00
2007 5 0 0 0 0 0 5 0.00
2008 6 4 1 0 0 0 11 9.09
2009 0 3 1 0 0 0 4 0.00
2010 4 1 3 4 20 0 32 62.50
2011 0 1 0 1 1 1 4 25.00
Total 16 10 5 5 21 1 58
B
reak
poi
nt
s
User’s accuracy
6.25 0.00 20.00 0.00 95.24 100.00 –
Overall
49 Using ALOS PALSAR mosaics with 25 m spa-tial resolution, forest cover loss was mapped with reasonable accuracy. The data were pro-vided by the ALOS K&C Initiative as level 1.5, co-registered tiles. The changes in the study area were identified with approximately 70 % accuracy. However, higher accuracy would be expected if the data were corrected due to fur-ther time series variations (e. g., Motohka et al., 2014). The coherence of the large-scale product should hopefully further decrease the number of misclassifications and other data-related errors for the boreal zone. The 46-day revisit time of the sensor is not a limitation in this part of the world due to the stable environmental condi-tions during winter. This is of particular impor-tance in order to fully use the potential of ALOS PALSAR data within an operational large-scale forest-monitoring system.
Secondly, in addition to SAR data, frequently available time series data tracking the phono-logical activity, such as the MODIS EVI prod-uct with a 16-day temporal resolution provide another important data source for regional scale forest disturbance tracking. Combining opera-tional satellite time series with the BFAST change detection method implemented in the EOM data middleware system enables a fast and easy to use forest monitoring tool. The integra-tion of data acquisiintegra-tion, time series quality en-hancement, data integration and analyses in a web-based environment enables a broad appli-cability of EO data for local and regional stake-holders, environmental scientists, and land man-agers. The MODIS-based BFAST change detec-tion produced an overall accuracy of 50 % for an observation period of 14 years. Within this period, two years (2009, 2010) showed a user’s accuracy of 80.0 and 60.8 % which proved the applicability of the method. For local scale analyses we demonstrated a good matching to reference data but the application and integra-tion in forest management processes required a sound understanding of the SAR data process-ing and analyses. User friendly data access and analyses can be improved by using data mid-dleware systems such as the EOM platform. Up to now, a fully operational system can be used based on the NASA MODIS vegetation indices product line. Further developments will focus
on the implementation of SAR-based time series products and newly available satellite time se-ries.
The authors thank Dr. Mikhail Korets
(V. N. Sukachev Institute of Forest, Russian Academy of Sciences, Siberian Branch) for pro-viding reference data of forest disturbances for Central Siberian test sites. This work was partly undertaken within the framework of the GMES Initial Operations – Network for Earth Obser-vation Research Training GIONET project, grant agreement PITN-GA-2010-264509. This paper was also realized in the framework of the FP 7 EU-Russia ZAPÁS project on the assess-ment and monitoring of forest resources in Cen-tral Siberia. ZAPÁS was funded by the Euro-pean Commission, Space, Cross-cutting Activi-ties, International Cooperation, Grant no. SPA.2010.3.2-01 EU-Russia Cooperation in GMES (SICA). This work has partly been un-dertaken within the framework of the JAXA Kyoto & Carbon Initiative. Helpful comments and suggestions from the reviewers are highly appreciated.
REFERENCES
Acker J. G., Leptoukh G. Online analysis en-hances use of NASA earth science data // Eos Transact. Amer. Geophys. Union. 2007. V. 88.
Bogaert J., Rousseau R., Van Hecke P., Im-pens I. Alternative area perimeter ratios for measurement of 2D shape compactness of habitats // Appl. Mathem. Comput. 2000. V. 111. N. 1. P. 71–85.
Bruzzone L., Marconcini M., Wegmüller U.,
Wi-esmann A. An advanced system for the
automatic classification of multitemporal SAR images // IEEE Transact. Geosci. Re-mote Sens. 2004. V. 42. N. 6. P. 1321–1334. Cihlar J., Denning S., Ahem F., Arino O.,
Transact. Amer. Geophys. Union. 2002. V. 83. N. 1. P. 6–7.
Coppin P., Jonckheere I., Nackaerts K., Muys B., Lambin E. Digital change detection methods in ecosystem monitoring: a review // Int. J. Remote Sens. 2004. V. 25. N. 9. P. 1565–1596.
Dong J., Xiao X., Sheldon S., Biradar C., Duong N. D., Hazarika M. A comparison of forest cover maps in Mainland Southeast Asia from multiple sources: PALSAR, MERIS, MODIS and FRA // Remote Sens. Environ. 2012. V. 127. P. 60–73.
Eberle J., Clausnitzer S., Hüttich C., Schmul-lius C. Multi-source data processing middle-ware for land monitoring within a web-based spatial data infrastructure for Siberia // ISPRS Int. J. Geo-Inform. 2013a. V. 2. P. 553–576.
Eberle J., Hüttich C., Schmullius C. Web-based multi-source data processing middleware for land observations and monitoring // ESA Living Planet Symp. Edinburgh, Scotland, 2013b.
FAO. The Russian Federation forest sector out-look study to 2030. Rome, 2012.
Forkel M., Carvalhais N., Verbesselt J., Mahe-cha M., Neigh C., Reichstein M. Trend change detection in NDVI time series: Ef-fects of inter-annual variability and method-ology // Remote Sens. 2013. V. 5. P. 2113– 2144.
Fransson J. E. S., Magnusson M., Eriks-son L. E. B., Sandberg G., Smith G., Ulan-der L. M. H. Detection of forest changes us-ing ALOS PALSAR satellite images // Geo-sci. Remote Sens. Symp. IGARSS, 2007. P. 2330–2333.
Hansen M. C., Potapov P. V., Moore R., Han-cher M., Turubanova S., Tyukavina A., Thau D., Stehman S. V., Goetz S. J., Love-land T. R., Kommareddy A., Egorov A., Chi-ni L., Justice C. O., Townshend J. R. G. High-resolution global maps of 21st century forest cover change // Science. 2013. V. 342. N. 6160. P. 850–853.
Hüttich C., Korets M., Bartalev S., Zharko V., Schepaschenko D., Shvidenko A., Schmul-lius C. Exploiting growing sock volume maps for large scale forest resource
assess-ment: cross-comparisons of ASAR- and PALSAR-based GSV estimates with forest inventory in Central Siberia // Forests. 2014a. V. 5. P. 1753–1776.
Hüttich C., Eberle J., Schmullius C., Bar-talev S., Emelyanov K., Korets M. Supporting a forest observation system for Siberia: Earth observation for monitoring, assessing and providing forest resource information // Earthzine. 2014b. P. 1. http://www.earthzine.
org/2014/07/16/supporting-a-forest- observation-system-for-siberia-earth- observation-for-monitoring-assessing-and-providing-forest-resource-information/ Morel A. C., Saatchi S. S., Malhi Y., Berry N. J.,
Banin L., Burslem D., Nilus R., Ong R. C. Estimating aboveground biomass in forest and oil palm plantation in Sabah, Malaysian Borneo using ALOS PALSAR data // For. Ecol. Manage. 2011. V. 262. N. 9. P. 1786– 1798.
Motohka T., Shimada M., Uryu Y., Setiabudi B. Using time series PALSAR gamma nought mosaics for automatic detection of tropical de-forestation: A test study in Riau, Indonesia // Remote Sens. Environ. 2014 (in press). Pan Y., Birdsey R. A., Fang J., Houghton R.,
Kauppi P. E., Kurz W. A., Phillips O. L., Shvidenko A., Lewis S. L., Canadell J. G., Ciais P., Jackson R. B., Pacala S. W., McGuire A. D., Piao S., Rautiainen A., Sitch S., Hayes D. A large persistent carbon sink in the world’s forests // Science. 2011. V. 333. N. 6045. P. 988–993.
Quegan S., Le Toan T., Yu J. J., Ribbes F., Floury N. Multitemporal ERS SAR analysis applied to forest mapping // IEEE Transact. Geosci. Remote Sens. 2000. V. 38. N. 2. P. 741–753.
Quegan S., Yu J. J. Filtering of multichannel SAR images // IEEE Transact. Geosci. Re-mote Sens. 2001. V. 39. N. 11. P. 2373– 2379.
51 Santoro M., Fransson J. E. S., Eriksson L. E. B.,
Ulander L. M. H. Clear-cut detection in Swedish boreal forest using multi-temporal ALOS PALSAR backscatter data // IEEE J. Select. Topics in Appl. Earth Observ. Re-mote Sens. 2010. V. 3. N. 4. P. 618–631. Santoro M., Pantze A., Fransson J. E. S.,
Dahl-gren J., Persson A. Nation-wide clear-cut mapping in Sweden using ALOS PALSAR strip images // Remote Sens. 2012. V. 4. N. 12. P. 1693–1715.
Schmullius C., Baker J., Balzter H., David-son M., EriksDavid-son L., Gaveau D., Gluck M., Holz A., Le Toan T., Luckman A., Mar-schalk U., McCallum I., Nilsson S., Oe-skog A., Quegan S., Rauste Y., Roth A., Rozhkov V., Sokolov V., Shvidenko A., Sku-din V., Strozzi T., Tansey K., Vietmeier J., Voloshuk L., Wagner W., Wegmuller U. SAR imaging for boreal ecology and radar inter-ferometry. A publ. SIBERIA project (Con-tract No. ENV4-CT97-0743-SIBERIA) – Fi-nal Report. 2001.
Shimada M. Ortho-rectification and slope cor-rection of SAR data using DEM and its
accu-racy evaluation // IEEE Transactions on Geo-science and Remote Sensing. 2010. V. 3. N. 4. P. 657–671.
Shimada M., Isoguchi O., Tadono T., Isono K. PALSAR radiometric and geometric calibra-tion // IEEE Transact. Geosci. Remote Sens. 2009. V. 47. N. 12. P. 3915–3932.
Shvidenko A., Schepaschenko D., Sukhinin A., McCallum I., Maksyutov S. Carbon emissions from forest fires in Boreal Eurasia between 1998–2010 // 5th Int. Wildland Fire Conf. Sun City, South Africa, 2011.
Verbesselt J., Hyndman R., Zeileis A., Culve-nor D. Phenological change detection while accounting for abrupt and gradual trends in satellite image time series // Remote Sens. Environ. 2010. V. 114. N. 12. P. 2970–2980. WWF. http://wwf.panda.org/about_our_earth/
about_forests/deforestation/forest_ille-gal_logging/ (visited November, 2014). Yu H., Qing X., Shuai X. A Method for SAR
. ю х1, . . ч - о 1, . 1, . о 2, . Ш 1
1
. Ш
Г , D-07743, , . , 32
2
GAF AG
Г , D-80634, , . , 199
E-mail: [email protected], [email protected], [email protected], [email protected], [email protected]
П 04.09.2014 .
В
. В . П
ALOS PALSAR 2007 2010 .
-. В
(Enhanced Vegetation Index – EVI) 2000–
2014 . MODIS
(Moderate Resolution Imaging Spectral Radiometer)
(BFAST).
(Synthetic
Aper-ture Radar – SAR) 70 %,
MODIS
50 % 43.4 %
-.
(SAR)
. - «М » (Earth
Observation Monitor)
.
юч о : ,
(SAR), (MODIS), ,