www.atmos-chem-phys.net/16/1789/2016/ doi:10.5194/acp-16-1789-2016
© Author(s) 2016. CC Attribution 3.0 License.
Aerosol optical properties derived from the DRAGON-NE Asia
campaign, and implications for a single-channel algorithm to
retrieve aerosol optical depth in spring from Meteorological Imager
(MI) on-board the Communication, Ocean, and Meteorological
Satellite (COMS)
M. Kim1, J. Kim1, U. Jeong1, W. Kim1, H. Hong2, B. Holben3, T. F. Eck3,4, J. H. Lim5, C. K. Song5, S. Lee5,a, and C.-Y. Chung6
1Department of Atmosphere Sciences/IEAA BK 21 plus, Yonsei University, Seoul, Korea 2Department of Spatial Information Engineering, Pukyong National University, Busan, Korea 3NASA Goddard Space Flight Center, Greenbelt, MD, USA
4Universities Space Research Association, Columbia, MD, USA 5National Institute of Environmental Research (NIER), Inchon, Korea
6National Meteorological Satellite Center, Gwanghyewon-myeon, Jincheon-gun, Chungcheongbuk-do, Korea anow at: Asia Center for Air Pollution Research (ACAP), Niigata-shi, Japan
Correspondence to:J. Kim ([email protected])
Received: 11 March 2015 – Published in Atmos. Chem. Phys. Discuss.: 14 April 2015 Revised: 5 January 2016 – Accepted: 18 January 2016 – Published: 16 February 2016
Abstract. An aerosol model optimized for northeast Asia is updated with the inversion data from the Distributed Re-gional Aerosol Gridded Observation Networks (DRAGON)-northeast (NE) Asia campaign which was conducted dur-ing sprdur-ing from March to May 2012. This updated aerosol model was then applied to a single visible channel algorithm to retrieve aerosol optical depth (AOD) from a Meteorolog-ical Imager (MI) on-board the geostationary meteorologMeteorolog-ical satellite, Communication, Ocean, and Meteorological Satel-lite (COMS). This model plays an important role in retrieving accurate AOD from a single visible channel measurement. For the single-channel retrieval, sensitivity tests showed that perturbations by 4 % (0.926±0.04) in the assumed single scattering albedo (SSA) can result in the retrieval error in AOD by over 20 %. Since the measured reflectance at the top of the atmosphere depends on both AOD and SSA, the overestimation of assumed SSA in the aerosol model leads to an underestimation of AOD. Based on the AErosol RObotic NETwork (AERONET) inversion data sets obtained over East Asia before 2011, seasonally analyzed aerosol op-tical properties (AOPs) were categorized by SSAs at 675 nm
of 0.92±0.035 for spring (March, April, and May). After the DRAGON-NE Asia campaign in 2012, the SSA during spring showed a slight increase to 0.93±0.035. In terms of the volume size distribution, the mode radius of coarse par-ticles was increased from 2.08±0.40 to 2.14±0.40. While the original aerosol model consists of volume size distribu-tion and refractive indices obtained before 2011, the new model is constructed by using a total data set after the DRAGON-NE Asia campaign. The large volume of data in high spatial resolution from this intensive campaign can be used to improve the representative aerosol model for East Asia. Accordingly, the new AOD data sets retrieved from a single-channel algorithm, which uses a precalculated look-up table (LUT) with the new aerosol model, show an improved correlation with the measured AOD during the DRAGON-NE Asia campaign. The correlation between the new AOD and AERONET value shows a regression slope of 1.00, while the comparison of the original AOD data retrieved using the original aerosol model shows a slope of 1.08. The change ofy-offset is not significant, and the correlation coefficients
and 0.85, respectively. The tendency of the original aerosol model to overestimate the retrieved AOD is significantly im-proved by using the SSA values in addition to size distribu-tion and refractive index obtained using the new model.
1 Introduction
An understanding of global aerosol distribution and its opti-cal characteristics is important, not only for predictions re-lated to climate change, but also for monitoring the effects of changing air quality on human health. It is widely accepted that aerosol has both direct and indirect effects on the Earth radiation budget (IPCC, 2013). Aerosols are also linked to respiratory illnesses (e.g., Pope and Dockery, 2006) and meningitis epidemics (e.g., Deroubaix et al., 2013). Since the global aerosol distribution shows high spatial and tempo-ral variability, many studies have developed aerosol retrieval algorithms utilizing both low Earth orbit satellite measure-ments (Hsu et al., 2004; Kim et al., 2007; Torres et al., 2007; Kahn et al., 2010; Lyapustin et al., 2011b; von Hoyningen-Huene et al., 2011; Wong et al., 2010; Bevan et al., 2012; Sayer et al., 2012; Levy et al., 2013) and geostationary or-bit (GEO) satellite measurements (Knapp et al., 2002, 2005; Wang et al., 2003; Urm and Sohn, 2005; Yoon et al., 2007; Kim et al., 2008; Lee et al., 2010; Zhang et al., 2011; Kim et al., 2014). These studies have typically adopted an inversion approach, using a precalculated look-up table (LUT) based on assumed aerosol optical properties (AOPs) to retrieve aerosol information from the measured visible reflectance at the top of the atmosphere. In this method, the accurate es-timation of surface reflectance and assumption of optimized aerosol optical type are key to retrieve accurate aerosol in-formation. The surface information was taken into account by using a single-view algorithm based on a multi-channel algorithm with certain assumptions (e.g., Levy et al., 2007b), or by using multiple-view algorithms for the multi-angle Ad-vanced Along-Track Scanning Radiometer (AATSR) (Grey et al., 2006) or the Polarization and Directionality of the Earth’s Reflectances (POLDER) sensor (Waquet et al., 2009) measurements. Under conditions of low aerosol optical depth (AOD), the estimation of surface reflectance is most crucial to retrieve accurate AOD, while assumptions about the type of aerosol are more significant for cases with higher AOD. A variation in single scattering albedo (SSA) of±3 % (based on a reference value of 0.90) results in a 10 % error for moderate AOD (τ =0.5 at 0.67 µm) and a 32 % error for large AODs
(τ =1.5) (Zhang et al., 2001). Lee et al. (2012) used a
triax-ial ellipsoidal database of dust (Yang et al., 2007) and inver-sion data from the AErosol RObotic NETwork (AERONET) to greatly improve the AOD retrieved using the MODIS dark target algorithm with regards to its Pearson coefficient (from 0.92 to 0.93), regression slope (from 0.85 to 0.99), and the percentage of data within an expected error bound (from 62 to 64 %).
Ground-based measurements are essential to the con-struction of a well-defined aerosol model to calculate LUT. Aerosol observations from ground-based sun/sky radiome-ter measurements, such as the AERONET, provide accu-rate global and local AOPs, including AOD and parti-cle characteristics (Duvobik et al., 2000; Holben et al., 1998). Numerous aerosol models for satellite aerosol al-gorithms have been based on the AERONET data sets (e.g., Sayer et al., 2014), and these models can be fur-ther improved by using AOPs obtained from intensive field campaigns in high spatial resolution (e.g., Huebert et al., 2003; Nakajima et al., 2007). Recently, the Distributed Re-gional Aerosol Gridded Observation Networks (DRAGON)-northeast (NE) Asia 2012 campaign over South Korea and Japan, during spring from March to May 2012, pro-vided a valuable insight into the characteristics of aerosol over metropolitan areas (http://aeronet.gsfc.nasa.gov/new_ web/DRAGON-Asia_2012_Japan_South_Korea.html). The campaign studied aerosol characteristics over known pol-luted areas affected by diverse aerosol sources such as urban pollutants and transported dust. In addition, the high spatial resolution data from the campaign were used to validate the satellite aerosol algorithms covering the same region.
To investigate the role of the mesoscale network of ground-based aerosol measurements in the satellite-based AOD retrieval, an aerosol retrieval algorithm based on the inversion method is tested in this study. By using a single-visible measurement of Meteorological Imager (MI) on-board the Communication, Ocean, and Meteorological Satel-lite (COMS), an AOD retrieval algorithm was developed by Kim et al. (2014), and it provides valuable results regarding aerosol distribution and transport. Since the algorithm can-not detect temporal and spatial variation of AOPs, the single type of assumed, optimized aerosol model was used as in pre-vious studies (e.g., Knapp et al., 2002; Yoon, 2006; Yoon et al., 2007; Wang et al., 2003). In this regard, the representative aerosol model is important to reduce the uncertainty in AOD retrieval. Here, the aerosol model from a previous study (Kim et al., 2014) is newly analyzed by using an extended data set after the DRAGON-NE Asia campaign. The campaign, which focuses on the monitoring of aerosol properties over Korea and Japan, can provide details of aerosol distribution, and contribute to accumulating the data set. The new aerosol model applied to the single-channel algorithm, and the re-trieved AODs, are compared with directly measured values from the DRAGON-NE Asia campaign.
the clearest air conditions, was estimated by finding the mini-mum AOD among the long-term measurements. Since the al-gorithm estimated surface reflectance based on the minimum reflectance method, underestimation or neglect of the BAOD results in the overestimation of the surface reflectance, and thus leads to the underestimation of AOD (Knapp et al., 2002; Yoon, 2006). The correction for BAOD to the surface reflectance showed significant effects in Kim et al. (2014), and is also considered here, whereas the critical reflectance method is not adopted to evaluate the effects of assumed aerosol properties on the AOD retrieval.
Though the accuracy of AOD retrieved from the single-channel algorithm is limited because of the limitation in type detection, the products obtained from GEO measurements have an advantage of continuous monitoring of aerosol emis-sion and transport from source regions in high temporal res-olution. The continuous monitoring is expected to improve the capability of predicting ambient aerosol properties (e.g., Saide et al., 2014; Park et al., 2014).
The data sets used in this study are summarized in Sect. 2, and details of the single-channel algorithm and its results are described in Sect. 3. Modifications to the aerosol model using data from the DRAGON-NE Asia campaign, and their effects on subsequent retrievals, are outlined in Sect. 4.
2 Data
2.1 DRAGON-NE Asia campaign
AERONET, a network of globally distributed ground-based sun photometers, is widely used to understand global AOPs and to validate satellite-based aerosol products. The AERONET sun photometer measurements of direct solar ra-diation provide accurate measurements of AOD (∼0.01 in the visible and near-infrared and ∼0.02 in the ultraviolet) under cloud-free conditions (Eck et al., 1999; Holben et al., 1998, 2001), and sky radiance measurements in an almucan-tar scenario can be inverted to calculate AOPs such as size distribution, single scattering albedo, phase functions, and the complex index of refraction (Dubovik and King, 2000; Dubovik et al., 2000, 2002).
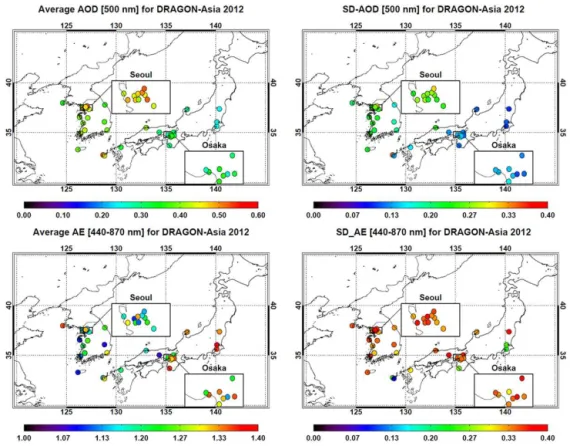
During the DRAGON-NE Asia campaign in 2012, 20 Cimel sun–sky radiometer instruments were deployed in Seoul, as well as in eastern and western parts of South Korea. In Japan, about 20 instruments were deployed in Osaka, west Japan, and Fukushima valley. The distribution of DRAGON Korea and Japan sites is shown in Fig. 1, along with the num-ber of AOD data provided in level 2.0 (cloud-screened and quality-assured; Smirnov et al., 2000) direct products during the campaign. These deployed sun photometers provided the high spatial-resolution information to address characteristics of mega city aerosol. Figure 2 shows the average and stan-dard deviation for each AOD (500 nm) and Ångström expo-nent (AE, 440–870 nm) measured during the campaign. In
Figure 1.Location and number of data points of the AERONET sun photometers deployed during DRAGON-NE Asia 2012. The color of each symbol represents the number of AOD (level 2.0) data points measured for the campaign.
Fig. 2a, the average AOD ranged between 0.23 and 0.52, and showed a decreasing behavior towards the southeast. The maximum value of 0.52 was found at two sites in Fukue (128.68◦E, 32.75◦N) and Sanggye (127.07◦E, 37.66◦N), while a minimum value of 0.23 was found at Kohriyama site (140.38◦E, 37.36◦N). In terms of local average, the mean AOD of 0.43 in Seoul was higher than the value of 0.30 in Osaka. Similarly, the standard deviation of AOD in Fig. 2b was low in the eastern part of Korea. While the standard de-viation varied between 0.22 and 0.31 in Seoul, the values in Japan were between 0.11 and 0.16. The regional difference is also calculated in terms of AE in Fig. 2c. The respective average AE of 1.20 and 1.27 in Seoul and Osaka represents that the particle size in Seoul is larger than that in Osaka, in general. The spatial distributions of AOD and AE can be related closely with transport of aerosol in East Asia during winter and spring (Park et al., 2014).
Figure 2.The(a, c)average and(b, d)standard deviation (1σ )of(a, b)AOD at 500 nm and(c, d)Ångström exponent between 440 and 870 nm during DRAGON-NE Asia 2012 campaign for each site.
in bold represent the validation sites selected randomly to test the consistency of the retrieval accuracy. The inversion products obtained at those validation sites were not applied to analyze the aerosol model, but direct AOD products were used to validate the algorithm. While a total of 12 126 inver-sion data sets from 1999 to 2012 were compiled, 84 091 AOD data sets were applied from the campaign at 39 sites in the spring of 2012.
2.2 COMS Meteorological Imager
A multi-purpose geostationary satellite, COMS, designed to orbit at a longitude of 128.2◦E, was launched on 27 June 2010 by the Korean government. The satellite per-forms meteorological and ocean monitoring by using the MI and Geostationary Ocean Color Imager (GOCI) instru-ments. The MI measures the single visible reflectance (0.55– 0.80 µm) at a 1 km spatial resolution, and the brightness tem-perature (BT) at four infrared (IR) wavelengths at a 4 km spatial and 30 min temporal resolution. The four IR channels cover spectral ranges of 10.3–11.3 (IR1), 11.5–12.5 (IR2), 6.5–7.0 (IR3), and 3.5–4.0 µm (IR4). The MI can cover a full disk from its equatorial position at 128.2◦E, though this study focuses mainly on images from East Asia. The MI measurements from the single visible and four IR channels are applied to retrieve land and ocean surface temperature,
incoming and outgoing radiance, and atmospheric variables including aerosol, cloud properties, precipitable water, and upper tropospheric humidity. The level 2.0 products can be obtained from the National Meteorological Satellite Center (http://nmsc.kma.go.kr/html/homepage/ko/main.do) of Ko-rea.
2.3 MODIS AOD
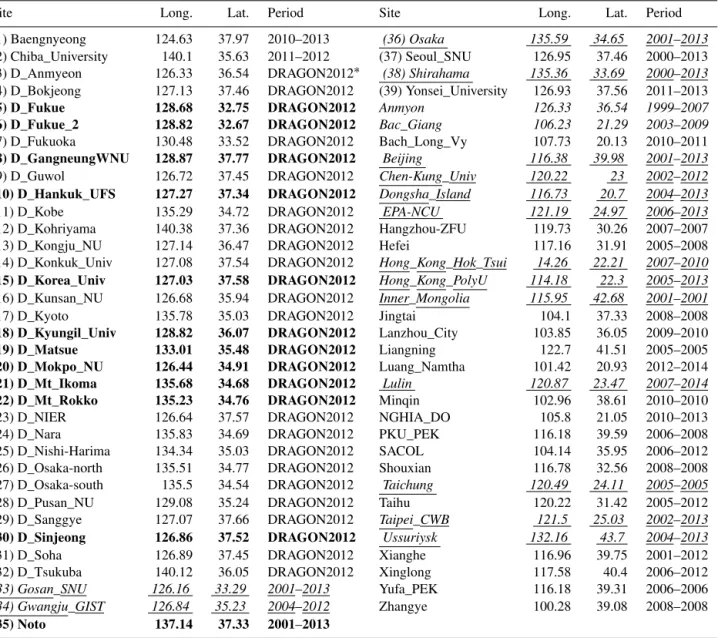
Table 1.Summary of AERONET sites used in this study. The “Period” column represents the retrieval period of the daily inversion product (level 2.0), and the longitude (long.,◦E) and latitude (lat.,◦N) show the location for each site. The number before the site name lists the sites operated for the DRAGON-Asia campaign, where “D” is the initial of the campaign. The numbers are linked to Tables 3, 4, and Fig. 10. The type of character categorizes the inversion data set into the “original”, “new”, and “excepted” groups. While the “original” group is compiled from the inversion data sets obtained before 2011 at sites in italic type, the “new” group consists of the total data set excluding the “excepted” group shown in bold type.
Site Long. Lat. Period Site Long. Lat. Period
(1) Baengnyeong 124.63 37.97 2010–2013 (36) Osaka 135.59 34.65 2001–2013
(2) Chiba_University 140.1 35.63 2011–2012 (37) Seoul_SNU 126.95 37.46 2000–2013
(3) D_Anmyeon 126.33 36.54 DRAGON2012∗ (38) Shirahama 135.36 33.69 2000–2013
(4) D_Bokjeong 127.13 37.46 DRAGON2012 (39) Yonsei_University 126.93 37.56 2011–2013
(5) D_Fukue 128.68 32.75 DRAGON2012 Anmyon 126.33 36.54 1999–2007
(6) D_Fukue_2 128.82 32.67 DRAGON2012 Bac_Giang 106.23 21.29 2003–2009
(7) D_Fukuoka 130.48 33.52 DRAGON2012 Bach_Long_Vy 107.73 20.13 2010–2011
(8) D_GangneungWNU 128.87 37.77 DRAGON2012 Beijing 116.38 39.98 2001–2013
(9) D_Guwol 126.72 37.45 DRAGON2012 Chen-Kung_Univ 120.22 23 2002–2012
(10) D_Hankuk_UFS 127.27 37.34 DRAGON2012 Dongsha_Island 116.73 20.7 2004–2013
(11) D_Kobe 135.29 34.72 DRAGON2012 EPA-NCU 121.19 24.97 2006–2013
(12) D_Kohriyama 140.38 37.36 DRAGON2012 Hangzhou-ZFU 119.73 30.26 2007–2007
(13) D_Kongju_NU 127.14 36.47 DRAGON2012 Hefei 117.16 31.91 2005–2008
(14) D_Konkuk_Univ 127.08 37.54 DRAGON2012 Hong_Kong_Hok_Tsui 14.26 22.21 2007–2010
(15) D_Korea_Univ 127.03 37.58 DRAGON2012 Hong_Kong_PolyU 114.18 22.3 2005–2013
(16) D_Kunsan_NU 126.68 35.94 DRAGON2012 Inner_Mongolia 115.95 42.68 2001–2001
(17) D_Kyoto 135.78 35.03 DRAGON2012 Jingtai 104.1 37.33 2008–2008
(18) D_Kyungil_Univ 128.82 36.07 DRAGON2012 Lanzhou_City 103.85 36.05 2009–2010 (19) D_Matsue 133.01 35.48 DRAGON2012 Liangning 122.7 41.51 2005–2005 (20) D_Mokpo_NU 126.44 34.91 DRAGON2012 Luang_Namtha 101.42 20.93 2012–2014 (21) D_Mt_Ikoma 135.68 34.68 DRAGON2012 Lulin 120.87 23.47 2007–2014
(22) D_Mt_Rokko 135.23 34.76 DRAGON2012 Minqin 102.96 38.61 2010–2010
(23) D_NIER 126.64 37.57 DRAGON2012 NGHIA_DO 105.8 21.05 2010–2013
(24) D_Nara 135.83 34.69 DRAGON2012 PKU_PEK 116.18 39.59 2006–2008
(25) D_Nishi-Harima 134.34 35.03 DRAGON2012 SACOL 104.14 35.95 2006–2012
(26) D_Osaka-north 135.51 34.77 DRAGON2012 Shouxian 116.78 32.56 2008–2008
(27) D_Osaka-south 135.5 34.54 DRAGON2012 Taichung 120.49 24.11 2005–2005
(28) D_Pusan_NU 129.08 35.24 DRAGON2012 Taihu 120.22 31.42 2005–2012
(29) D_Sanggye 127.07 37.66 DRAGON2012 Taipei_CWB 121.5 25.03 2002–2013
(30) D_Sinjeong 126.86 37.52 DRAGON2012 Ussuriysk 132.16 43.7 2004–2013
(31) D_Soha 126.89 37.45 DRAGON2012 Xianghe 116.96 39.75 2001–2012
(32) D_Tsukuba 140.12 36.05 DRAGON2012 Xinglong 117.58 40.4 2006–2012
(33) Gosan_SNU 126.16 33.29 2001–2013 Yufa_PEK 116.18 39.31 2006–2006
(34) Gwangju_GIST 126.84 35.23 2004–2012 Zhangye 100.28 39.08 2008–2008
(35) Noto 137.14 37.33 2001–2013
∗DRAGON2012: period of the DRAGON-NE Asia 2012 campaign (March–May 2012)
summer depending on snow surface and summer monsoon. The uncertainty related with the BAOD assumption will be discussed in Sect. 3.5.
3 Single channel algorithm
The basic concept of the single-channel algorithm suggested in Kim et al. (2014) lies in the inversion of the top of the atmosphere (TOA) reflectance to AOD by using the sensi-tivity of the TOA reflectance to AOD under the condition
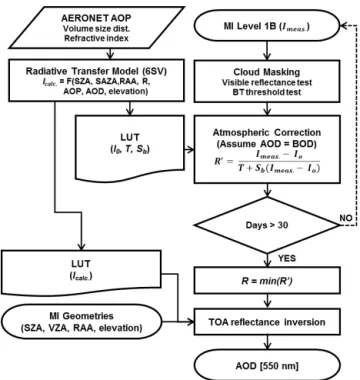
Figure 3. Flowchart of a single-channel algorithm for AOD re-trieval, adapted from Kim et al. (2014). Imeas and Icalc
repre-sent measured and calculated TOA reflectance, respectively. Io means atmospheric reflectance including the Rayleigh scattering and aerosol effect,Sbis the hemispheric reflectance, andT is the atmospheric transmittance for the geometry of the sun illumina-tion and satellite viewing. R′shows semi-surface reflectance
ob-tained by correcting the atmospheric effects from theImeasand the minimum value among the 30-dayR′is regarded as the surface
re-flectance (R).
constructed using long-term AERONET inversion data to consider changes in refractive index, the mode radius and the width (standard deviation) in the volume size distribu-tion with respect to the AOD. The volume size distribudistribu-tion consists of two modes, fine and coarse, and both vary in ac-cordance with assumed AOD in the RTM simulation. In ad-dition, the aerosol model was designed to include the sea-sonal variation in AOPs, with a different LUT selected de-pending on the season in which the measurement was taken. A flowchart of the AOD retrieval algorithm for MI measure-ments is shown in Fig. 3. To estimate surface reflectance, the minimum reflectance method was applied under the assump-tion that the increase in AOD makes a positive contribuassump-tion to TOA reflectance over a dark surface. The minimum TOA reflectance obtained from the previous 30-day measurement was converted to surface reflectance, after correcting for scat-tering by atmospheric molecules and for BAOD.
3.1 Cloud masking
The AOD was retrieved only for cloud-free pixels which sat-isfy threshold tests of TOA reflectance and BT. The threshold of 0.35 for the TOA reflectance at the visible channel sepa-rated bright cloud pixels, and the threshold of 5 K for the BT difference between the maximum BT for the previous 30 days and the BT of the current pixel separated cold cloud pixels. The pixels which have a BT lower than 265 K were also masked out. Additionally, thresholds for BT differences between IR1 and IR2, and IR1 and IR4 were taken from Frey et al. (2008). The thresholds to distinguish cloud and aerosol pixels (IR1−IR2 brightness temperature difference (BTD)), and to detect low-level clouds (IR1−IR4 BTD) were ad-justed as follows by trial and error. The positive BTD be-tween IR1 and IR2, and the largely negative BTD (<−6 K) were found in cloud pixels. Thus, the cloud masking proce-dure includes the following tests:
visible reflectance>0.35
IR1−IR2>0.5 K & IR1<268 K
IR1−IR2>0.5 K & IR1max−IR1>5 K
IR1−IR2>1.5 K & IR1−IR4<−6 K for ocean IR1−IR2>0.5 K & IR1−IR4<−10 K for ocean IR1−IR2>1.5 K & IR1−IR4<−14 K for land.
3.2 Surface reflectance and BAOD
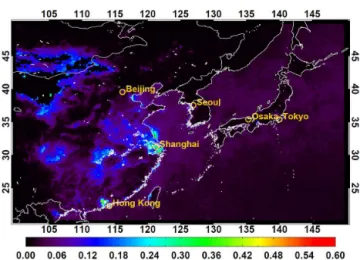
Figure 4. Absolute minimum AOD at 550 nm obtained from MODIS level 2.0 products (MYD04_Lv2.0) from 2006 to 2012 at 0.25◦×0.25◦resolution. Yellow circles indicate the location of well-known urban areas over northeast Asia.
BAOD map clearly reveals the most heavily polluted region as a hotspot.
The surface reflectance was estimated from the minimum TOA reflectance, after correcting for atmospheric and BAOD effects. For details of the atmospheric correction, see Kim et al. (2014).
3.3 Integration of aerosol model
The calculated TOA reflectance from RTM simulations is affected by the concentration, particle size/shape, and scat-tering properties of aerosol. Consequently, an increase in the SSA of the particle correlates positively with TOA re-flectance for the same AOD. The use of a well-defined aerosol model to generate the LUT is therefore crucial to obtain accurate AOD values from the inversion method. Al-though spatial variation of the aerosol characteristics shown in Fig. 2 was not taken into account, a regionally integrated aerosol model over the area of interest suggests typical prop-erties from these areas, since the geostationary MI steadily observes the same field of view from a fixed location. In this study, the aerosol models were obtained from a seasonal av-erage of AERONET inversion data sets over East Asia. There are two groups of inversion data sets applied to examine the effect of the DRAGON-NE Asia campaign on the retrieval accuracy of aerosol. The first data sets were compiled from 18 AERONET sites from 1999 to 2010, with a total of 4898 data points as used by Kim et al. (2014). This group was named as the “original” data set, where the name and loca-tion of these sites are represented by italic type. The full list shown by normal characters in Table 1 summarizes the sites used to construct the new data set as described in Sect. 2.1.
The new group includes 40 additional AERONET sites and extends the measurement period by up to 2 years (2011– 2012) including the campaign. The greater quantity of data, from the increased number of sites for the extended measure-ment periods, allows us to optimize the aerosol model for the region of interest.
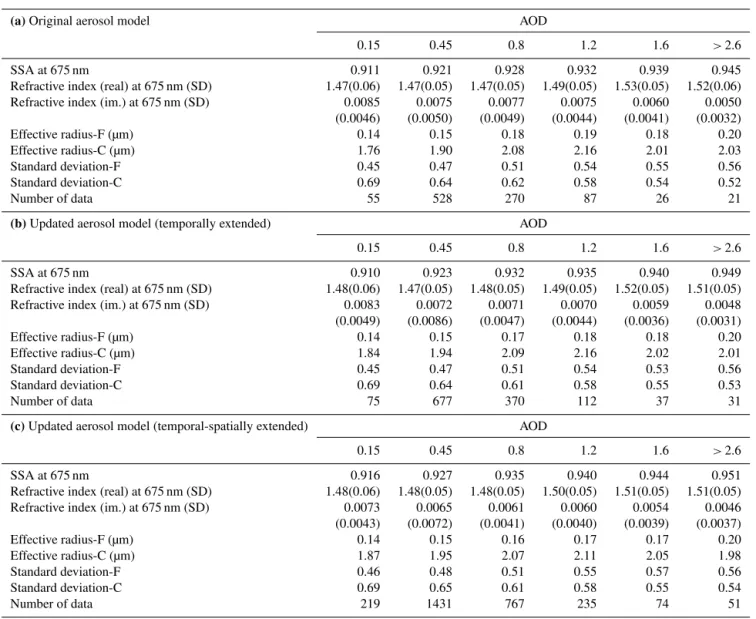
Table 2.Integrated AOPs for each AOD bin (550 nm) from AERONET inversion data. Each of the AOD bins ranges between 0.0 and 0.3, 0.3 and 0.6, 0.6 and 1.0, 1.0 and 1.4, 1.4 and 1.8, and 1.8 and 3.0, respectively, and the median value is shown in the table. The values in(a) (upper panel) were obtained from the original inversion data group, and those in the middle and lower panels(bandc)were estimated from temporally and temporal-spatially extended data sets, respectively. Fine and course modes are denoted by -F and -C, respectively.
(a)Original aerosol model AOD
0.15 0.45 0.8 1.2 1.6 >2.6
SSA at 675 nm 0.911 0.921 0.928 0.932 0.939 0.945
Refractive index (real) at 675 nm (SD) 1.47(0.06) 1.47(0.05) 1.47(0.05) 1.49(0.05) 1.53(0.05) 1.52(0.06)
Refractive index (im.) at 675 nm (SD) 0.0085 0.0075 0.0077 0.0075 0.0060 0.0050
(0.0046) (0.0050) (0.0049) (0.0044) (0.0041) (0.0032)
Effective radius-F (µm) 0.14 0.15 0.18 0.19 0.18 0.20
Effective radius-C (µm) 1.76 1.90 2.08 2.16 2.01 2.03
Standard deviation-F 0.45 0.47 0.51 0.54 0.55 0.56
Standard deviation-C 0.69 0.64 0.62 0.58 0.54 0.52
Number of data 55 528 270 87 26 21
(b)Updated aerosol model (temporally extended) AOD
0.15 0.45 0.8 1.2 1.6 >2.6
SSA at 675 nm 0.910 0.923 0.932 0.935 0.940 0.949
Refractive index (real) at 675 nm (SD) 1.48(0.06) 1.47(0.05) 1.48(0.05) 1.49(0.05) 1.52(0.05) 1.51(0.05)
Refractive index (im.) at 675 nm (SD) 0.0083 0.0072 0.0071 0.0070 0.0059 0.0048
(0.0049) (0.0086) (0.0047) (0.0044) (0.0036) (0.0031)
Effective radius-F (µm) 0.14 0.15 0.17 0.18 0.18 0.20
Effective radius-C (µm) 1.84 1.94 2.09 2.16 2.02 2.01
Standard deviation-F 0.45 0.47 0.51 0.54 0.53 0.56
Standard deviation-C 0.69 0.64 0.61 0.58 0.55 0.53
Number of data 75 677 370 112 37 31
(c)Updated aerosol model (temporal-spatially extended) AOD
0.15 0.45 0.8 1.2 1.6 >2.6
SSA at 675 nm 0.916 0.927 0.935 0.940 0.944 0.951
Refractive index (real) at 675 nm (SD) 1.48(0.06) 1.48(0.05) 1.48(0.05) 1.50(0.05) 1.51(0.05) 1.51(0.05)
Refractive index (im.) at 675 nm (SD) 0.0073 0.0065 0.0061 0.0060 0.0054 0.0046
(0.0043) (0.0072) (0.0041) (0.0040) (0.0039) (0.0037)
Effective radius-F (µm) 0.14 0.15 0.16 0.17 0.17 0.20
Effective radius-C (µm) 1.87 1.95 2.07 2.11 2.05 1.98
Standard deviation-F 0.46 0.48 0.51 0.55 0.57 0.56
Standard deviation-C 0.69 0.65 0.61 0.58 0.55 0.54
Number of data 219 1431 767 235 74 51
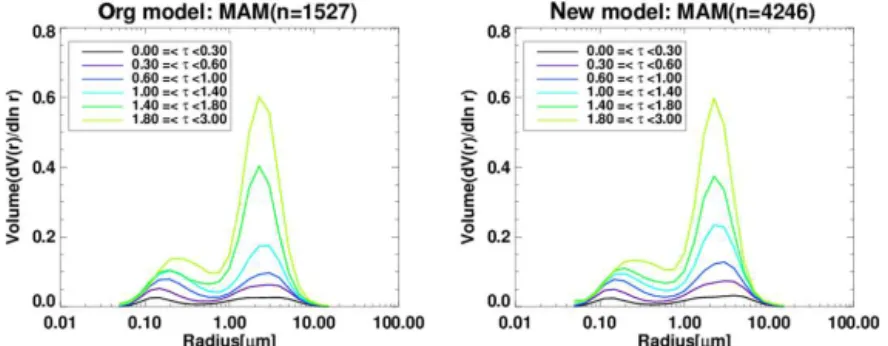
the coarse-mode particles of a bimodal log-normal size dis-tribution tend to dominate due to sporadic dust events (e.g., Lee et al., 2010). With the increase in AOD, the mode radius of fine particles is increased, while that of coarse particles is decreased (Levy et al., 2007a). The effective radius and stan-dard deviation values for fine and coarse mode are listed in Table 2a and c.
Using aerosol models derived from both the original and new data sets, LUTs were calculated by using the 6SV (Sec-ond Simulation of a Satellite Signal in the Solar Spectrum– Vector) RTM (Vermote et al., 1997; Kotchenova et al., 2006; Kotchenova and Vermote, 2007). In addition to measure-ment geometry (i.e., solar zenith angle, viewing zenith angle, and relative azimuth angle), the surface reflectance, aerosol model, and AOD were provided as input variables to
cal-culate the LUTs. Surface elevation was also included to in-crease the accuracy of Rayleigh scattering correction.
As mentioned above, the AOD is retrieved by comparing measured and calculated TOA reflectance for a given set of measurement conditions. The values in the LUTs were lin-early interpolated with the values in the neighboring bins be-cause the calculation of TOA reflectance is performed as a function of several input variables. To test the effects of the changes in aerosol models, the AODs were respectively de-rived by using the original and the new LUTs.
3.4 Sensitivity to assumed aerosol optical properties
Figure 5.Volume size distribution for each AOD bin, as obtained from the original and new AERONET inversion data listed in Table 1. The effective radius and standard deviation of the fine- and coarse-mode particles are described in Table 2. The size distributions are averaged for each AOD interval, and the color of the curve indicates the mean AOD value.
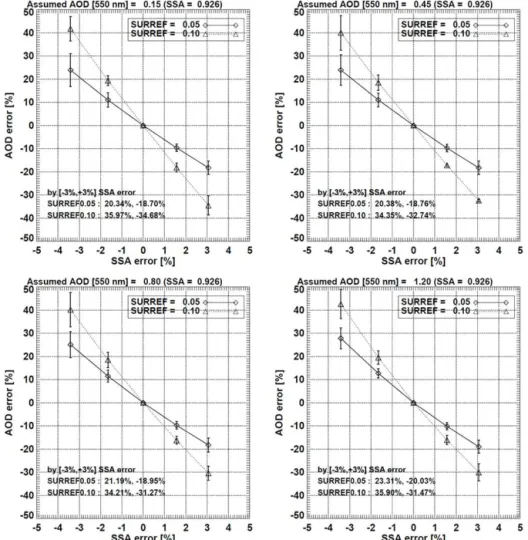
to uncertainty in the assumed SSA, a reference test was per-formed. In this test, the TOA reflectance was analyzed within a±4% variation in SSA relative to the reference condition, from simulations using the RTM for four different reference conditions of both AOD and SSA with assumed geometries. The 4 % variation covers the standard deviation of 0.035 for the integrated SSA of 0.92 mentioned in Sect. 3.3. In the simulation, the surface reflectance was assumed to be 0.05 and 0.10, and the scattering angle was varied from 135.7 to 173.2◦with respect to the geostationary measurement condi-tions. The surface elevation was at sea level, and cloud-free conditions were assumed. The retrieved AOD from the sim-ulated reflectance was then compared with the assumed ref-erence AOD value. Because the AOD was retrieved from the simulated TOA reflectance by assuming the reference SSA, the±4 % variation in SSA causes an error in AOD. The sults for the comparison between the reference value and re-trieved AODs for each simulated reflectance are shown in Fig. 6. The case with zero SSA error indicates that the as-sumed SSA for the retrieval was the same as the reference SSA. In other cases, the positive error in SSA indicates that the SSA used to calculate the LUT was overestimated when compared with the reference value. The errors in AOD and SSA were calculated as follows:
AOD error[%] =
[(retrieved AOD−reference AOD)/referenceAOD] ·100 SSA error[%] =
[(assumed SSA−reference SSA)/reference SSA] ·100.
Strong negative correlation was found between the errors in SSA and AOD. The error in SSA was negatively correlated with the error in AOD, and thus the overestimation of SSA leads to an underestimation of AOD. In terms of the absolute value of AOD error, the effects of the positive and negative errors in SSA are symmetric in general, though the effect of the negative error in SSA is slightly greater. The effect of assumed errors in SSA is more significant in scenarios with higher AOD. The SSA error of±3 % results in an AOD error
of−18.70 % (−0.03, an absolute difference) and+20.34 % (+0.03), respectively, when the reference AOD is 0.15 and the surface reflectance is 0.05. The range of error is increased when the reference AOD is higher, with retrieval errors of −20.03 % (−0.24) and+23.31 % (+0.28) caused by a±3 % SSA error when the reference AOD is 1.20.
The error in AOD also increases with the increase of as-sumed surface reflectance relative to true reflectance. When the surface reflectance is increased from 0.05 to 0.10, the er-rors in the reference AOD of 0.15 ranged between −35 % (−0.05) and 36 % (+0.05). The increase of effect of the SSA assumption was related with the one-to-one correlation between the critical reflectance and SSA reflectance (Cas-tanho et al., 2008; Fraser and Kaufman, 1985). Whereas the increase in aerosol contributes to the increase of TOA re-flectance over a dark surface, the increase in AOD reduces the TOA reflectance by shielding the upwelling reflectance from a bright surface. There exists, therefore, a surface re-flectance at which the positive and negative contributions of aerosol to the TOA reflectance are canceled out; then the sur-face reflectance is known as the critical reflectance. In con-sideration of the positive relationship between the critical reflectance and SSA, the sensitivity to the SSA assumption of the AOD retrieval can be increased near the critical re-flectance.
3.5 Uncertainty of AOD retrieval
Various uncertainties result in an error in retrieved AOD as the algorithm is based on a single channel, where most dominant uncertainties come from estimating the surface flectance and assumed aerosol model. To investigate the re-trieval error, several sensitivity tests were conducted. The effects of linear inversion error, assumptions of BAOD, the aerosol model, and surface elevation were estimated in a quantitative manner in addition to the aerosol model error shown in Fig. 6.
Figure 6.Dependence of the AOD retrieval error on error in assumed SSA for four different AOD cases. The SSA error represents the percentage difference between SSAs used in the simulation and the retrieval, and the AOD error indicates the difference between the retrieved AOD and a reference value. Surface reflectance is assumed to be 0.05, and scattering angles ranging from 135.73◦to 173.23◦are applied. The error bars indicate the standard deviation of AOD error obtained from the geometric variation, and the numbers in parentheses are the SSA error without the inversion error.
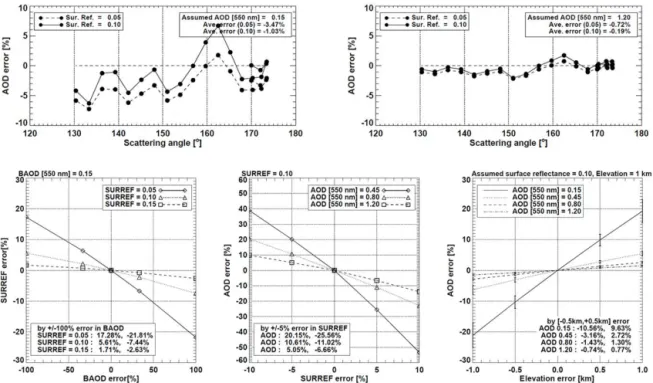
interpolated linearly from the neighboring bins for geometry, AOD, surface reflectance, and elevation. Thus, the number of entries for LUT calculation must be selected carefully to save operation time and maintain retrieval accuracy at the same time. LUT applied in this study presents TOA reflectance calculated as a function of geometrical angles of sun and satellite with 10◦ interval, and surface reflectance with 0.1 intervals. As long as the LUT approach is applied to the re-trieval algorithm, the linear interpolation of TOA reflectance between each bin leads to the inversion error. Figure 7a and b show the percentage difference between retrieved and refer-ence AODs in terms of scattering angle, surface reflectance, and AOD condition. Two different AODs of 0.15 and 1.20 were applied to calculate the reference reflectance with two surface reflectances of 0.05 and 0.10, and solar zenith an-gles ranging from 0 to 57◦by intervals of 3◦. The satellite zenith and azimuth angle were assumed to be 10 and 40◦,
respectively. In Fig. 7a and b, the percentage errors increase by increasing difference between the reference condition and LUT bin in terms of both scattering angle and surface re-flectance. The inversion error varied from 0 to 8 %, which mainly increased with the increase of scattering angle, and decreased with the increase of AOD. In the figure, the solid lines represent the inversion error which has arisen solely by the angle interpolation in intervals of 0.1 for the surface re-flectance in LUT. The dashed lines representing the inver-sion error for the surface reflectance of 0.05 show that the as-sumption about linearity between bins of surface reflectance increased the error negatively.
Figure 7.Uncertainties in retrieval of AOD and surface reflectance;(a, b)AOD error depending on scattering angle for two cases of AOD (0.15, 1.20) and two cases of surface reflectance (0.05, 0.10);(c)error in surface reflectance according to BAOD assumption error for three conditions of BAOD (0.05, 0.10, and 0.15); and(d)sensitivity of AOD error to error in surface reflectance and elevation for each assumed condition of AOD.
range of MODIS AOD is±(0.05+15 %). The BAOD is very low in general, and thus the expected error range can be over ±100 % when the BAOD is lower than 0.05. According to a sensitivity test, the ±100 % error in the BAOD of 0.05 led to a 7 % error in surface reflectance of 0.05 and an 11 % er-ror in AOD of 0.45. The effects of BAOD erer-ror in surface reflectance and AOD are shown in Fig. 7c and d, respec-tively, under the conditions of BAOD of 0.15, three surface reflectances of 0.05, 0.10, and 0.15, and three AODs of 0.45, 0.80, and 1.20. In general, the underestimation of the BAOD leads to the overestimation of the surface reflectance. The −100 % error in the BAOD assumption caused 5.6 % overes-timation of surface reflectance when the surface reflectance was 0.1. Meanwhile, the 5 % error in surface reflectance led to 25.56 % underestimation of the AOD when the reference AOD and surface reflectance were 0.45 and 0.10, respec-tively. The uncertainty decreased with the increase of sur-face reflectance, and the sensitivity to the error in sursur-face reflectance was more significant for the low AOD condi-tion than the high AOD. In this test, the inversion error was avoided by using reference reflectance calculated under the condition of LUT bins.
Lastly, the effect of assumption in surface elevation was analyzed, as shown in Fig. 7e. The assumption of surface el-evation is linked with the Rayleigh scattering correction. The underestimation of surface elevation leads to the overestima-tion of atmospheric pressure, and thus the over-correcoverestima-tion of
the Rayleigh scattering, which eventually results in the over-estimation of surface reflectance, and thus the underestima-tion of the AOD. The sensitivity was tested for an elevaunderestima-tion of 1 km, two AODs of 0.15 and 0.80, and a surface reflectance of 0.10. The±0.5 km errors in surface elevation resulted in +9.63 % and −10.56 % errors in AOD when the reference condition was assumed to be an AOD of 0.15. The increas-ing AOD significantly reduced sensitivity to the uncertainty, and a ±0.5 km error led to +1.30 and −1.43 % when the AOD was 0.80. The dependence on surface reflectance and elevation was not significant.
From the uncertainty tests, the largest uncertainty was found in the aerosol model assumption by about 30 % al-though the effect of each uncertainty was changed by con-ditions of AOD, surface reflectance, and sun-satellite geom-etry.
4 Results and validation
4.1 Comparison with MODIS AOD
Figure 8.Red, green, and blue images obtained from GOCI measurements and examples of retrieved AOD from MI measurements on 27 April 2012. Two panels on the bottom right-hand side show the MODIS AOD product obtained from TERRA (MOD04) and AQUA (MYD04) measurements. The AOD ranges between 0 and 2 in these panels.
et al., 2014). Figure 8 shows examples of retrieved AOD from the geostationary measurements from MI, using the single-channel algorithm. The red, green, and blue images, obtained from GOCI onboard the same platform measured at 01:16, 02:16, 03:16, 04:16, 05:16, and 06:16 UTC on 27 April 2012, show dust flow from the Shandong peninsula to the northern Korean peninsula. Similarly, the images of retrieved AOD show values greater than 1.0 in the dust plume, in contrast to the values lower than 0.4 over other regions. Compared with the MODIS AOD, the retrieved AODs over dusty regions are generally higher, though the distribution of MI AOD is spa-tially well matched over non-dusty regions. The spaspa-tially av-eraged value of the MI AOD in dusty regions [110–125◦E, 35–40◦N] decreased steadily from 2.67 at 00:00 UTC to 1.69 at 07:00 UTC, and the minimum value of 1.43 was found at 03:30 UTC. Meanwhile, the spatial mean values of AOD ob-tained from the MODIS TERRA and AQUA measurements were 1.11 at 03:55 UTC and 1.18 at 05:15 UTC respectively. In Fig. 8, the AOD images of TERRA and AQUA represent
the measurements between 00:00 and 05:00 UTC, and be-tween 02:00 and 06:00 UTC, respectively.
Figure 9.Evaluation of the AOD retrieved from MI measurements during the DRAGON-NE Asia campaign. Thexaxis andyaxis indicate
the values of AOD at 550 nm obtained from AERONET and MI measurements, respectively, and the color of the symbols shows the data counts for each AOD bin. Theyaxis on the left(a,c)and right side(b,d)represents the AOD retrieved using the original and new LUT, respectively. The plots at the top(a,b)contain the data measured from all campaign sites, whereas those at the bottom(c,d)contain only the values from the sites excluded from the AOP analysis. The linear regression line with a Pearson coefficient (r) and root-mean-square error
(RMSE) were included for each plot.
4.2 Comparison with AERONET: DRAGON-NE Asia For quantitative validation, the retrieved AODs were com-pared with the measured values from the 39 AERONET sun photometer sites in Korea and Japan. To investigate the effect of the new aerosol model as an input parameter to calculate the LUTs, the results of the original and new AOD retrievals were compared, and the comparisons are shown in Fig. 9. The measured AODs from all of the numbered DRAGON-NE Asia sites listed in Table 1 were used in the compari-son shown in the top panel. In the lower panel, part of the AERONET AOD used as a validation group to test the con-sistency of the algorithm and to validate the retrieval accu-racy is shown. The data from the validation group were not included in the AOP analysis due to a lack of inversion data sets. The comparison results are shown in the bottom panel of Fig. 9. The left and right panels show evaluations of the original and new AOD, respectively.
Using the original aerosol model, the retrieved AODs agree very well with the linear regression as follows:
τMI[original LUT]=1.08τDRAGON-Asia−0.08,
RMSE=0.18, r=0.87.
Although the Pearson coefficient of 0.87 indicates a signif-icant correlation, the regression slope indicates that the re-trieved AOD is overestimated by 8 % compared with the AERONET value. Comparison with the validation group, however, shows a tendency to systematic underestimation, with a slope of 1.01 andy-offset of−0.05.
By applying the new aerosol model, the regression slope was improved to 1.00, although other measures remained similar:
τMI[new LUT]=1.00τDRAGON-Asia−0.07,
RMSE=0.17, r=0.85.
Figure 10.Taylor diagrams comparing the retrieved AODs and the values obtained from AERONET sun photometer measurements during the DRAGON-2012 campaign.(a)Comparison of results from the original AOD,(b)comparison of results from the new AOD. The numbers above each symbol indicate the number of the DRAGON-NE Asia sites, as listed in Table 1.
Thus, the overestimation of the original AOD suggests that the radiative absorptivity of the aerosol during MAM was slightly underestimated prior to the campaign. According to Fig. 6, a 1 % underestimation of SSA can result in an overes-timation of AOD by up to 7 %. The uncertainty can vary with measurement geometry, AOD, or surface reflectance. There-fore, to a large degree, the 8 % decrease in AOD can be ex-plained by a 1.1 % increase in SSA in the new aerosol model during MAM. The large RMSE and the underestimation for the validation group, however, are attributed to the spatial and temporal variation in AOPs, which cannot be standardized by the single aerosol model. Moreover, the change of aerosol model results in a decrease of percentage of the comparison data within 30 % difference range from 79.15 to 77.30 %. In terms of the comparison of the validation group, the re-gression slope decreased from 1.01 to 0.93, though the com-parison still shows strong correlation between the retrieved and measured AOD. As long as a single aerosol model is applied, the spatial and temporal variations of aerosol prop-erties are the largest uncertainty of the AOD retrieval algo-rithm. When the difference between assumed and actual SSA becomes higher than 3 %, the retrieval error exceed 30 %. The degradation of the comparison statistics shows the lim-itation of the single-channel algorithm. The uncertainties in estimation of surface reflectance and assumption of linear-ity between LUT bins have effects on the accuracy of low AOD as described in Sect. 3.5. The sensitivity tests showed that the effects of each retrieval uncertainty depend on the condition of AOD. For the condition of low AOD, the effect of the aerosol model assumption on the retrieval uncertainty in AOD is significantly lower than the effects of surface re-flectance estimation. However, an insufficient number of in-version data for an AOD bin between 0.0 and 0.3, where the AOD is lower than the criteria of quality assurance of 0.4 (440 nm), increases the uncertainty in the assumption of the
aerosol model for the condition of low AOD. Consequently, it was found that the validation statistics for low AOD (<0.4
at 550 nm) were significantly lower than that for high AOD. While the correlation coefficient and regression slope of the low AOD comparison were 0.49 and 0.35, those for the high AOD condition were 0.78 and 0.86. The ratio of the low AOD to the total comparison data set was 41.72 %. To show the re-trieval accuracy for each campaign site, the Taylor diagram (Taylor, 2001) is shown in Fig. 10. This diagram summarizes how closely a set of retrievals matches observations in terms ofr, RMSE, and standard deviation. The polar angle of the
point from thexaxis indicates the correlation coefficient, and
the radial distance represents the normalized standard devi-ation, which in this case describes the ratio of the standard deviation of the retrieved MI AOD to that of the AERONET (Yoon et al., 2014) values. The distance between the symbol and the dashed arc, which represents the standard deviation of the AERONET value, shows the similarity of the ampli-tude of their variations; a radial distance of>1 indicates that
the standard deviation of the MI AOD is greater than that of AERONET. On the other hand, the RMSE between the MI and AERONET AODs is proportional to the distance to the point on thex axis identified as “AERONET”, marked
the underestimation of AOD following an overestimation of BAOD in the case of low-AOD conditions.
The comparison statistics of the original and new AOD, plotted in the Taylor diagram, are also listed in Tables 3 and 4, respectively. The correlation coefficients obtained from the 39 DRAGON sites range from 0.66 to 0.95 and the average was 0.84 when the original aerosol model was applied. The maximum value was found at Anmyeon (site number 3) and Kunsan_NU (National University) in Korea, and the mini-mum value of 0.66 was found at Nishi-Harima (site num-ber 25) in Japan. The Anmyeon site was located in a rural area near the ocean to monitor background conditions of the atmosphere (e.g., Kim et al., 2007), and thus the dark sur-face contributes to a reduction in the uncertainty in AOD re-trieval. The Kunsan-NU site, as with the Anmyeon site, was surrounded by mountains, reservoirs, and an area that is rural. Meanwhile, the Nishi-Harima site was located on the top of Mount Onade (435.9 m altitude, Nishi-Harima Astronomical Observatory) among trees, and thus the uncertainty caused during surface correction can also be reduced. However, the comparison statistics showed systematic underestimation of the AODs by a regression slope of 0.86 and ay-intercept of
−0.06. To compare the difference between the AOD correla-tions for each sites, temporal variation of the AODs obtained from MI and AERONET measurements were represented in Fig. 11. In Fig. 11, the AOD variations for the four aforemen-tioned sites are shown in order of the (a) Anmyeon, (b) Kun-san_NU, (c) Kohriyama, and (d) Nishi-Harima sites. The red boxes and black circles, which indicate the MI AOD and the AERONET values, were well matched at (a) Anmyeon and (b) Kunsan-NU with good correlation statistics. The verti-cal distribution of symbols for each day represents diurnal variation of AOD, and the variations were also highly cor-related regardless of time. The temporal variations showed an increase in AOD during the period from 1 to 15 May at both sites. In two other sites in Japan, Kohriyama and Nishi-Harima, no temporal pattern can be found because of the low number of comparison data, though the variation of MI AOD was closely related with the AERONET value. A notable fea-ture in the comparison was the low number of data. Table 3 showed that most Japanese sites (except Fukue) have a lower number of comparison data than the Korean sites, and the low number trend was related with the frequency of the di-rect measurements by the sun photometer in Japanese sites. While the total number of direct AOD products in the level 2.0 data set ranged between 99 and 3630 in Japan, the num-ber ranged from 1296 to 5191 in Korea. The difference in data counts indicates that there were frequent rain and cloud events over Japan, resulting in uncertainty in the AOD re-trieval in Japan, including the Koriyama and Nishi-Harima sites. However, a reason for the significant underestimation trend of the MI AOD at Nishi-Harima is not clear yet.
Excluding the Fukue_2 site, which has a low number of comparison data of only 4, the regression slopes at 32 AERONET sites were higher than 1.0, and the values at 9
Figure 11.Temporal variations of AODs during the DRAGON-NE Asia campaign. The red boxes and black circles represent the val-ues retrieved from MI and AERONET measurements, respectively, and each panel shows the time series for different AERONET sites: (a)Anmyeon,(b)Kunsan_NU,(c)Kohriyama,(d)Nishi-Harima.
Table 3. Summary statistics of the comparison between the MI AOD (550 nm) retrieved with the original LUT and AERONET AOD (550 nm). The site numbers correspond to the numbers listed in Table 1 and Fig. 9a. The sites mentioned in Sect. 4.2 are represented by bold font.
Site Datan MI AOD DRAGON AOD AOD R Slope y- RMSE
no. mean (SD) mean (SD) diff. offset
1 400 0.42 (0.34) 0.43 (0.25) −0.010 0.942 1.278 −0.13 0.115
2 76 0.43 (0.21) 0.36 (0.16) 0.071 0.814 1.054 0.051 0.122
3 273 0.51 (0.39) 0.55 (0.31) −0.033 0.949 1.190 −0.138 0.121 4 341 0.63 (0.34) 0.66 (0.26) −0.023 0.829 1.101 −0.089 0.192
5 408 0.52 (0.37) 0.70 (0.36) −0.172 0.891 0.915 −0.112 0.167
6 4 0.61 (0.17) 0.68 (0.02) −0.067 0.927 7.337 −4.359 0.056
7 109 0.36 (0.24) 0.41 (0.17) −0.049 0.859 1.198 −0.130 0.122
8 182 0.46 (0.22) 0.50 (0.18) −0.044 0.771 0.955 −0.021 0.141
9 458 0.56 (0.35) 0.55 (0.26) 0.004 0.871 1.164 −0.087 0.169
10 275 0.57 (0.32) 0.59 (0.26) −0.019 0.875 1.077 −0.065 0.156
11 108 0.45 (0.27) 0.51 (0.22) −0.062 0.782 0.966 −0.045 0.165
12 23 0.58 (0.29) 0.45 (0.16) 0.138 0.849 1.581 −0.122 0.152
13 232 0.67 (0.47) 0.68 (0.37) −0.012 0.914 1.154 −0.117 0.190
14 355 0.58 (0.35) 0.64 (0.27) −0.065 0.862 1.118 −0.140 0.179
15 430 0.60 (0.35) 0.66 (0.27) −0.063 0.846 1.102 −0.130 0.189
16 227 0.70 (0.50) 0.67 (0.44) 0.031 0.952 1.104 −0.039 0.153
17 47 0.49 (0.31) 0.54 (0.21) −0.047 0.778 1.111 −0.107 0.190
18 272 0.43 (0.27) 0.49 (0.21) −0.066 0.812 1.051 −0.091 0.159
19 56 0.60 (0.28) 0.64 (0.16) −0.035 0.776 1.345 −0.254 0.173
20 254 0.66 (0.32) 0.60 (0.26) 0.058 0.890 1.090 0.003 0.147
21 71 0.41 (0.21) 0.42 (0.18) −0.009 0.834 0.987 −0.003 0.117
22 112 0.44 (0.21) 0.41 (0.14) 0.035 0.775 1.199 −0.047 0.132
23 206 0.66 (0.37) 0.58 (0.25) 0.081 0.892 1.336 −0.114 0.167
24 82 0.37 (0.26) 0.45 (0.20) −0.086 0.907 1.185 −0.170 0.107
25 46 0.30 (0.21) 0.42 (0.16) −0.120 0.656 0.862 −0.062 0.159
26 69 0.40 (0.23) 0.48 (0.22) −0.087 0.858 0.925 −0.050 0.119
27 138 0.49 (0.32) 0.51 (0.21) −0.029 0.778 1.162 −0.112 0.197
28 317 0.48 (0.29) 0.55 (0.25) −0.063 0.871 1.006 −0.067 0.143
29 336 0.62 (0.38) 0.67 (0.29) −0.054 0.835 1.080 −0.108 0.206
30 246 0.62 (0.40) 0.63 (0.27) −0.009 0.868 1.259 −0.171 0.197
31 437 0.60 (0.35) 0.61 (0.26) −0.015 0.821 1.104 −0.078 0.200
32 135 0.50 (0.27) 0.35 (0.17) 0.144 0.703 1.152 0.090 0.194
33 458 0.56 (0.39) 0.62 (0.33) −0.051 0.942 1.099 −0.112 0.130
34 290 0.63 (0.38) 0.63 (0.27) 0.004 0.913 1.274 −0.169 0.156
35 93 0.41 (0.24) 0.43 (0.17) −0.017 0.935 1.303 −0.147 0.086
36 115 0.43 (0.29) 0.51 (0.20) −0.087 0.787 1.140 −0.159 0.178
37 260 0.61 (0.35) 0.61 (0.27) −0.001 0.835 1.097 −0.060 0.194
38 92 0.32 (0.20) 0.38 (0.14) −0.055 0.804 1.136 −0.107 0.121
39 316 0.64 (0.37) 0.65 (0.26) −0.018 0.805 1.140 −0.110 0.219
of the regression slope. The change in correlation coefficient and RMSE was not significant.
5 Summary
A single-channel algorithm was used to retrieve AOD over East Asia by adopting a new aerosol model, derived from data from the mesoscale network measurement campaign deploying sun–sky radiometers, DRAGON-NE Asia 2012. The campaign was performed during MAM 2012 to improve
our understanding of the AOPs on a high spatial scale over well-known aerosol source regions where aerosol loading is affected by both desert emissions and industrial pollutants. In addition, the direct solar measurements of spectral AOD undertaken during the campaign were used to improve the satellite-based aerosol retrieval algorithm by providing a data set for validation.
Table 4. Summary statistics of the comparison between the MI AOD (550 nm) retrieved with the updated LUT and AERONET AOD (550 nm). The site numbers correspond to the numbers listed in Table 1 and Fig. 9a. The sites mentioned in Sect. 4.2 are represented by bold font.
Site Datan MI AOD DRAGON AOD AOD R Slope y- RMSE
no. mean (SD) mean (SD) diff. offset
1 402 0.39 (0.32) 0.43 (0.25) −0.033 0.944 1.205 −0.121 0.107
2 76 0.40 (0.19) 0.36 (0.16) 0.045 0.812 0.965 0.058 0.112
3 284 0.49 (0.39) 0.55 (0.32) −0.058 0.949 1.139 −0.134 0.122
4 340 0.58 (0.31) 0.66 (0.26) −0.072 0.803 0.974 −0.055 0.185
5 413 0.50 (0.35) 0.69 (0.36) −0.195 0.882 0.856 −0.095 0.164
6 4 0.58 (0.16) 0.68 (0.02) −0.097 0.926 6.857 −4.062 0.053
7 108 0.34 (0.22) 0.41 (0.17) −0.064 0.853 1.113 −0.110 0.116
8 186 0.44 (0.21) 0.50 (0.18) −0.066 0.763 0.894 −0.013 0.136
9 454 0.51 (0.32) 0.55 (0.26) −0.038 0.847 1.036 −0.057 0.167
10 276 0.53 (0.30) 0.59 (0.26) −0.065 0.854 0.973 −0.049 0.155
11 111 0.41 (0.25) 0.50 (0.21) −0.087 0.775 0.896 −0.035 0.155
12 22 0.56 (0.28) 0.45 (0.16) 0.103 0.854 1.537 −0.141 0.143
13 242 0.62 (0.44) 0.68 (0.37) −0.056 0.902 1.073 −0.106 0.190
14 353 0.53 (0.33) 0.64 (0.27) −0.111 0.842 1.014 −0.120 0.176
15 431 0.56 (0.33) 0.66 (0.27) −0.108 0.830 1.019 −0.120 0.186
16 234 0.64 (0.46) 0.66 (0.42) −0.013 0.949 1.040 −0.039 0.147
17 44 0.43 (0.24) 0.52 (0.21) −0.088 0.805 0.928 −0.050 0.139
18 276 0.40 (0.26) 0.49 (0.21) −0.092 0.787 0.979 −0.081 0.157
19 56 0.59 (0.28) 0.64 (0.16) −0.054 0.745 1.290 −0.240 0.183
20 261 0.60 (0.29) 0.59 (0.26) 0.005 0.880 0.984 0.015 0.138
21 71 0.38 (0.20) 0.42 (0.18) −0.036 0.832 0.919 −0.002 0.111
22 111 0.41 (0.19) 0.41 (0.13) 0.006 0.765 1.087 −0.029 0.123
23 208 0.62 (0.35) 0.58 (0.26) 0.034 0.885 1.179 −0.070 0.164
24 82 0.34 (0.23) 0.45 (0.19) −0.104 0.895 1.098 −0.148 0.104
25 46 0.29 (0.20) 0.42 (0.16) −0.134 0.652 0.802 −0.051 0.150
26 70 0.38 (0.23) 0.49 (0.22) −0.104 0.835 0.882 −0.047 0.125
27 137 0.46 (0.31) 0.52 (0.21) −0.058 0.774 1.112 −0.116 0.194
28 315 0.45 (0.26) 0.54 (0.25) −0.097 0.852 0.900 −0.042 0.136
29 338 0.57 (0.36) 0.67 (0.29) −0.098 0.816 0.997 −0.096 0.206
30 245 0.57 (0.37) 0.63 (0.27) −0.058 0.842 1.129 −0.138 0.197
31 440 0.55 (0.33) 0.61 (0.27) −0.060 0.798 0.997 −0.058 0.201
32 138 0.46 (0.25) 0.35 (0.17) 0.104 0.710 1.080 0.075 0.179
33 460 0.53 (0.37) 0.61 (0.33) −0.080 0.938 1.042 −0.106 0.128
34 294 0.59 (0.37) 0.64 (0.28) −0.048 0.917 1.181 −0.163 0.146
35 93 0.40 (0.24) 0.43 (0.18) −0.033 0.936 1.227 −0.132 0.082
36 117 0.42 (0.31) 0.52 (0.20) −0.104 0.770 1.171 −0.193 0.197
37 261 0.56 (0.33) 0.61 (0.27) −0.051 0.803 0.977 −0.036 0.194
38 94 0.30 (0.19) 0.37 (0.15) −0.066 0.799 1.037 −0.079 0.113
39 318 0.59 (0.35) 0.65 (0.26) −0.066 0.786 1.042 −0.093 0.217
a minimum reflectance method was applied, and the BAOD was used to correct for the persistent background aerosol lev-els over East Asia. The BAOD was obtained by using the MODIS standard AOD product from 2006 to 2012. With re-spect to aerosol model selection, however, the single-channel algorithm was limited by a lack of spectral information. For this reason, the aerosol model was integrated from a season-ally sorted inversion data set, taking into account the mon-soon climate over the region, which was used to calculate LUT. To overcome the limitations of the retrieval accuracy
ef-fect on the AOPs than the extended periods of measurement in terms of refractive index. An increase in the effective ra-dius of coarse particle distribution was also found. This in-crease in spatial resolution resulted in an inin-crease of SSA by ∼1.1 % during MAM, which was expected to lead to a de-crease in AOD.
According to the sensitivity test, the error in the retrieved AOD varied from−19 to+20 %, in proportion with the as-sumed SSA error of ±3 % in the aerosol model, for a sce-nario with a reference AOD value of 0.15 and a surface re-flectance of 0.05. The uncertainty in retrieved AOD due to the assumed SSA error was increased at greater values of AOD, and ranged between −20 and +23 % when the ref-erence AOD value was 1.20. In short, the overestimation of SSA in the aerosol model results in the underestimation of AOD, and assumed errors in SSA have a greater effect at higher values of AOD. Considering the relationship between surface reflectance and the uncertainty, the retrieval error in real measurements could be larger than the suggested value when the surface reflectance is near the critical reflectance. In the meantime, the error in surface reflectance shows larger effects in the accuracy of low AOD than the error in SSA.
The qualitative comparison between AODs retrieved from MODIS and MI showed a reasonably high correlation. The MI AOD showed the capability to track the dust plume crossing from the Shandong peninsula to the northern Ko-rean peninsula by taking advantage of geostationary mea-surements, whereas the MODIS AOD provided two AOD maps during a single day by using both Terra and Aqua. AODs retrieved with both the original and new aerosol model showed a good correlation with sun photometer data from the DRAGON-NE Asia campaign. The correlation coeffi-cient and the RMSE were slightly changed from 0.87 to 0.85 and 0.18 to 0.17, respectively, by applying the new aerosol model. Increased SSA values in the new aerosol model solved problems with AOD being overestimated, and the re-gression slope was decreased from 1.08 to 1.00. A compari-son for each campaign site also showed that the statistics of the correlation were generally improved. For some regions, however, changes in the aerosol model led to underestima-tion of the AOD.
As shown here, the use of a fixed aerosol model is an im-portant issue in a single-channel algorithm. Similarly, the ap-plication of a well-defined model for each assumed aerosol type is important to obtain accurate results from a multi-channel algorithm. According to a study with the GOCI multi-channel algorithm (Choi et al., 2015), however, the ef-fects of applying the DRAGON-NE Asia data set were less significant, in other words less dependent on the assumed aerosol model. The GOCI algorithm categorizes 26 aerosol models according to the fine-mode fraction at 550 nm and SSA at 440 nm, and selects an optimized aerosol type at each measured pixel and time. The accuracy of the BAOD is another important issue when using the minimum re-flectance method to retrieve AOD, because overestimation
of the BAOD results in a systematic underestimation of the AOD. The dense measurements of the AERONET sun pho-tometer network can be used to optimize the BAOD at higher resolution, though the network cannot cover the whole field of view of the satellite measurements. Furthermore, an im-proved correction for cloud masking is required to reduce noise in the retrieval.
Acknowledgements. We thank the principal investigators and their
staff for establishing and maintaining the AERONET sites used in this investigation. We also gratefully acknowledge the principal investigator and staff of the DRAGON-NE Asia campaign for their effort. This research was supported by the GEMS program of the Ministry of Environment, Korea, and the Eco Innovation Program of KEITI (2012000160002). This research was partially supported by the Brain Korea 21 Plus (J. Kim and M. Kim).
Edited by: M. Schulz
References
Bevan, S. L., North, P. R. J., Los, S. O., and Grey, W. M. F.: A global dataset of atmospheric aerosol optical depth and surface reflectance from AATSR, Remote Sens. Environ., 116, 199–210, doi:10.1016/j.rse.2011.05.024, 2012.
Castanho, A. D. D. A., Martins, J. V., and Artaxo, P.: MODIS aerosol optical depth Retrievals with high spatial resolution over an urban area using the critical reflectance, J. Geophys. Res.-Atmos., 113, D02201, doi:10.1029/2007jd008751, 2008. Choi, M., Kim, J., Lee, J., Kim, M., Je Park, Y., Jeong, U., Kim, W.,
Holben, B., Eck, T. F., Lim, J. H., and Song, C. K.: GOCI Yon-sei Aerosol Retrieval (YAER) algorithm and validation during DRAGON-NE Asia 2012 campaign, Atmos. Meas. Tech. Dis-cuss., 8, 9565–9609, doi:10.5194/amtd-8-9565-2015, 2015. Deroubaix, A., Martiny, N., Chiapello, I., and Marticorena, B.:
Suit-ability of OMI aerosol index to reflect mineral dust surface condi-tions: Preliminary application for studying the link with meningi-tis epidemics in the sahel, Remote Sens. Environ., 133, 116–127, doi:10.1016/j.rse.2013.02.009, 2013.
Dubovik, O. and King, M. D.: A flexible inversion algorithm for re-trieval of aerosol optical properties from Sun and sky radiance measurements, J. Geophys. Res.-Atmos., 105, 20673–20696, doi:10.1029/2000jd900282, 2000.
Dubovik, O., Smirnov, A., Holben, B. N., King, M. D., Kauf-man, Y. J., Eck, T. F., and Slutsker, I.: Accuracy assessments of aerosol optical properties retrieved from Aerosol Robotic Net-work (AERONET) Sun and sky radiance measurements, J. Geo-phys. Res.-Atmos., 105, 9791–9806, doi:10.1029/2000jd900040, 2000.
Dubovik, O., Holben, B., Eck, T. F., Smirnov, A., Kaufman, Y. J., King, M. D., Tanre, D., and Slutsker, I.: Variability of absorption and optical properties of key aerosol types observed in world-wide locations, J. Atmos. Sci., 59, 590–608, doi:10.1175/1520-0469(2002)059<0590:Voaaop>2.0.Co;2, 2002.
desert dust aerosols, J. Geophys. Res.-Atmos., 104, 31333– 31349, doi:10.1029/1999jd900923, 1999.
Fraser, R. S. and Kaufman, Y. J.: The relative importance of aerosol scattering and absorption in remote-sensing, IEEE T. Geosci. Re-mote, 23, 625–633, doi:10.1109/Tgrs.1985.289380, 1985. Frey, R. A., Ackerman, S. A., Liu, Y. H., Strabala, K. I.,
Zhang, H., Key, J. R., and Wang, X. G.: Cloud detection with MODIS. Part I: Improvements in the MODIS cloud mask for collection 5, J. Atmos. Ocean. Tech., 25, 1057–1072, doi:10.1175/2008jtecha1052.1, 2008.
Grey, W. M. F., North, P. R. J., Los, S. O., and Mitchell, R. M.: Aerosol optical depth and land surface reflectance from Multiangle AATSR measurements: Global validation and inter-sensor comparisons, IEEE T. Geosci. Remote, 44, 2184–2197, doi:10.1109/Tgrs.2006.872079, 2006.
Holben, B. N., Eck, T. F., Slutsker, I., Tanre, D., Buis, J. P., Set-zer, A., Vermote, E., Reagan, J. A., Kaufman, Y. J., Nakajima, T., Lavenu, F., Jankowiak, I., and Smirnov, A.: Aeronet – a fed-erated instrument network and data archive for aerosol charac-terization, Remote Sens. Environ., 66, 1–16, doi:10.1016/S0034-4257(98)00031-5, 1998.
Holben, B. N., Tanre, D., Smirnov, A., Eck, T. F., Slutsker, I., Abuhassan, N., Newcomb, W. W., Schafer, J. S., Chatenet, B., Lavenu, F., Kaufman, Y. J., Castle, J. V., Setzer, A., Markham, B., Clark, D., Frouin, R., Halthore, R., Karneli, A., O’Neill, N. T., Pietras, C., Pinker, R. T., Voss, K., and Zibordi, G.: An emerg-ing ground-based aerosol climatology: Aerosol optical depth from AERONET, J. Geophys. Res.-Atmos., 106, 12067–12097, doi:10.1029/2001jd900014, 2001.
Hsu, N. C., Tsay, S. C., King, M. D., and Herman, J. R.: Aerosol properties over bright-reflecting source regions, IEEE T. Geosci. Remote, 42, 557–569, doi:10.1109/Tgrs.2004.824067, 2004. Huebert, B. J., Bates, T., Russell, P. B., Shi, G. Y., Kim, Y. J.,
Kawa-mura, K., Carmichael, G., and Nakajima, T.: An overview of ACE-Asia: Strategies for quantifying the relationships between Asian aerosols and their climatic impacts, J. Geophys. Res.-Atmos., 108, 8633, doi:10.1029/2003JD003550, 2003.
IPCC: Climate Change 2013: The Physical Science Basis. Contri-bution of Working Group I to the Fifth Assessment Report of the Intergovernmental Panel on Climate Change, edited by: Stocker, T. F., Qin, D., Plattner, G.-K., Tignor, M., Allen, S. K., Boschung , J., Nauels, A., Xia, Y., Bex, V., and Midgley, P. M., Cambridge University Press, Cambridge, United Kingdom and New York, NY, USA, 1535 pp., doi:10.1017/CB O9781107415324, 2013. Kahn, R. A., Gaitley, B. J., Garay, M. J., Diner, D. J., Eck, T. F.,
Smirnov, A., and Holben, B. N.: Multiangle Imaging SpectroRa-diometer global aerosol product assessment by comparison with the Aerosol Robotic Network, J. Geophys. Res.-Atmos., 115, D23209, doi:10.1029/2010jd014601, 2010.
Kim, J., Lee, J., Lee, H. C., Higurashi, A., Takemura, T., and Song, C. H.: Consistency of the aerosol type classification from satellite remote sensing during the atmospheric brown cloud-east Asia regional experiment campaign, J. Geophys. Res.-Atmos., 112, D22s33, doi:10.1029/2006jd008201, 2007.
Kim, J., Yoon, J. M., Ahn, M. H., Sohn, B. J., and Lim, H. S.: Re-trieving aerosol optical depth using visible and mid-IR channels from geostationary satellite MTSAT-1R, Int. J. Remote Sens., 29, 6181–6192, doi:10.1080/01431160802175553, 2008.
Kim, M., Kim, J., Lee, J., Lee, Y. G., Yoon, J. M., and Song, C. H.: Analysis of Background Aerosol using Global AERONET Sun-photometer Measurements, in preparation, 2016.
Kim, M., Kim, J., Wong, M. S., Yoon, J., Lee, J., Wu, D., Chan, P. W., Nichol, J. E., Chung, C.-Y. C., and Ou, M.-L.: Improve-ment of aerosol optical depth retrieval over Hong Kong from a geostationary meteorological satellite using critical reflectance with background optical depth correction, Remote Sens. Envi-ron., 142, 176–187, 2014.
Knapp, K. R., Vonder Haar, T. H., and Kaufman, Y. J.: Aerosol op-tical depth retrieval from goes-8: Uncertainty study and retrieval validation over South America, J. Geophys. Res.-Atmos., 107, 4055, doi:10.1029/2001jd000505, 2002.
Knapp, K. R., Frouin, R., Kondragunta, S., and Prados, A.: Toward aerosol optical depth retrievals over land from GOES visible ra-diances: Determining surface reflectance, Int. J. Remote Sens., 26, 4097–4116, doi:10.1080/01431160500099329, 2005. Kotchenova, S. Y. and Vermote, E. F.: Validation of a
vec-tor version of the 6S radiative transfer code for atmospheric correction of satellite data. Part ii. Homogeneous Lamber-tian and anisotropic surfaces, Appl. Optics, 46, 4455–4464, doi:10.1364/Ao.46.004455, 2007.
Kotchenova, S. Y., Vermote, E. F., Matarrese, R., and Klemm, F. J.: Validation of a vector version of the 6S radiative transfer code for atmospheric correction of satellite data. Part i: Path radiance, Appl. Optics, 45, 6762–6774, doi:10.1364/Ao.45.006762, 2006. Lee, J., Kim, J., Song, C. H., Ryu, J. H., Ahn, Y. H., and Song, C. K.: Algorithm for retrieval of aerosol optical properties over the ocean from the Geostationary Ocean Color Imager, Remote Sens. Environ., 114, 1077–1088, doi:10.1016/j.rse.2009.12.021, 2010.
Lee, J., Kim, J., Yang, P., and Hsu, N. C.: Improvement of aerosol optical depth retrieval from MODIS spectral reflectance over the global ocean using new aerosol models archived from AERONET inversion data and tri-axial ellipsoidal dust database, Atmos. Chem. Phys., 12, 7087–7102, doi:10.5194/acp-12-7087-2012, 2012.
Levy, R. C., Remer, L. A., and Dubovik, O.: Global aerosol opti-cal properties and application to Moderate Resolution Imaging Spectroradiometer aerosol retrieval over land, J. Geophys. Res.-Atmos., 112, D13210, doi:10.1029/2006jd007815, 2007a. Levy, R. C., Remer, L. A., Mattoo, S., Vermote, E. F., and
Kauf-man, Y. J.: Second-generation operational algorithm: Retrieval of aerosol properties over land from inversion of Moderate Resolu-tion Imaging Spectroradiometer spectral reflectance, J. Geophys. Res.-Atmos., 112, D13211, doi:10.1029/2006jd007811, 2007b. Levy, R. C., Remer, L. A., Kleidman, R. G., Mattoo, S., Ichoku,
C., Kahn, R., and Eck, T. F.: Global evaluation of the Collection 5 MODIS dark-target aerosol products over land, Atmos. Chem. Phys., 10, 10399–10420, doi:10.5194/acp-10-10399-2010, 2010. Levy, R. C., Mattoo, S., Munchak, L. A., Remer, L. A., Sayer, A. M., Patadia, F., and Hsu, N. C.: The Collection 6 MODIS aerosol products over land and ocean, Atmos. Meas. Tech., 6, 2989– 3034, doi:10.5194/amt-6-2989-2013, 2013.