ACPD
12, 8465–8501, 2012Global and regional trends of aerosol optical depth over
land and ocean
N. C. Hsu et al.
Title Page
Abstract Introduction
Conclusions References
Tables Figures
◭ ◮
◭ ◮
Back Close
Full Screen / Esc
Printer-friendly Version
Interactive Discussion
Discussion
P
a
per
|
Dis
cussion
P
a
per
|
Discussion
P
a
per
|
Discussio
n
P
a
per
|
Atmos. Chem. Phys. Discuss., 12, 8465–8501, 2012 www.atmos-chem-phys-discuss.net/12/8465/2012/ doi:10.5194/acpd-12-8465-2012
© Author(s) 2012. CC Attribution 3.0 License.
Atmospheric Chemistry and Physics Discussions
This discussion paper is/has been under review for the journal Atmospheric Chemistry and Physics (ACP). Please refer to the corresponding final paper in ACP if available.
Global and regional trends of aerosol
optical depth over land and ocean using
SeaWiFS measurements from 1997 to
2010
N. C. Hsu1, R. Gautam1,2, A. M. Sayer1,2, C. Bettenhausen1,3, C. Li1,4, M. J. Jeong5, S.-C. Tsay1, and B. N. Holben1
1
NASA Goddard Space Flight Center, Greenbelt, MD, USA
2
Goddard Earth Sciences Technology And Research (GESTAR), Universities Space Research Association (USRA), Columbia, MD, USA
3
Science Systems Applications Inc., Lanham, MD, USA
4
University of Maryland, College Park, MD, USA
5
Gangneung-Wonju National University, Gangneung City, Gangwong Province, Korea Received: 5 March 2012 – Accepted: 20 March 2012 – Published: 29 March 2012 Correspondence to: N. C. Hsu (christina.hsu@nasa.gov)
ACPD
12, 8465–8501, 2012Global and regional trends of aerosol optical depth over
land and ocean
N. C. Hsu et al.
Title Page
Abstract Introduction
Conclusions References
Tables Figures
◭ ◮
◭ ◮
Back Close
Full Screen / Esc
Printer-friendly Version
Interactive Discussion
Discussion
P
a
per
|
Dis
cussion
P
a
per
|
Discussion
P
a
per
|
Discussio
n
P
a
per
|
Abstract
Both sensor calibration and satellite retrieval algorithm play an important role in the ability to determine accurately long-term trends from satellite data. Owing to the un-precedented accuracy and long-term stability of its radiometric calibration, the Sea-WiFS measurements exhibit minimal uncertainty with respect to sensor calibration. In 5
this study, we take advantage of this well-calibrated set of measurements by applying a newly-developed aerosol optical depth (AOD) retrieval algorithm over land and ocean to investigate the distribution of AOD, and to identify emerging patterns and trends in global and regional aerosol loading during its 13-yr mission. Our results indicate that the averaged AOD trend over global ocean is weakly positive from 1998 to 2010 10
and comparable to that observed by MODIS but opposite in sign to that observed by AVHRR during overlapping years. On a smaller scale, different trends are detected for different regions. For example, large upward trends are found over the Arabian Penin-sula that indicate a strengthening of the seasonal cycle of dust emission and transport processes over the whole region as well as over downwind oceanic regions. In con-15
trast, a negative-neutral tendency is observed over the desert/arid Saharan region as well as in the associated dust outflow over the North Atlantic. Additionally, we found decreasing trends over the Eastern US and Europe, and increasing trends over coun-tries such as China and India that are experiencing rapid economic development. In general, these results are consistent with those derived from ground-based AERONET 20
measurements.
1 Introduction
The impact of natural and anthropogenic sources of air pollution on Earth’s weather and climate systems and their long-term tendencies have gained increasing attention from the scientific community in recent years. Indeed, tropospheric aerosols not only 25
ACPD
12, 8465–8501, 2012Global and regional trends of aerosol optical depth over
land and ocean
N. C. Hsu et al.
Title Page
Abstract Introduction
Conclusions References
Tables Figures
◭ ◮
◭ ◮
Back Close
Full Screen / Esc
Printer-friendly Version
Interactive Discussion
Discussion
P
a
per
|
Dis
cussion
P
a
per
|
Discussion
P
a
per
|
Discussio
n
P
a
per
|
(Ramanathan et al., 2001) but also by changing cloud properties and lifetimes (Rosen-feld et al., 2008). Furthermore, the Intergovernmental Panel on Climate Change (IPCC, 2007) report indicates that the aerosol cooling effect could have partially counteracted warming from greenhouse gas increases over the past few decades. However, there are large uncertainties in the estimation of climate forcing from aerosols due to their 5
complex nature and short lifetime. In order to achieve a better understanding of the spa-tial and temporal variability of aerosol distributions on both a regional and global scale, long-term satellite measurements of high fidelity are required. From this increased un-derstanding we can then accurately evaluate aerosol effects in the climate models.
Despite its importance, deriving the small signal that represents the long-term trend 10
in aerosol distribution from the large seasonal cycles and natural year-to-year variability which result from large-scale meteorology is highly challenging. In order to use satel-lite measurements to determine aerosol trends with the required level of robustness, several key elements must be addressed. They include: (1) accuracy, precision, and stability of the sensor calibration, (2) potential for sampling bias due to insufficient tem-15
poral or spatial coverage, (3) potential for algorithm bias (i.e., differences in the cloud screening scheme, temporal changes in the aerosol or surface properties that devi-ate from assumptions used in the retrieval algorithm), (4) sufficient length of the data record, and (5) potential effects of any measurement time drift due to the diurnal cycle of atmospheric aerosol loading. Early satellite sensors, such as the Advanced Very 20
High Resolution Radiometer (AVHRR), provide a longer data record for trend deter-mination compared to later, more advanced satellite sensors such as the Sea-viewing Wide Field-of-view Sensor (SeaWiFS), Moderate Resolution Imaging Spectroradiome-ter (MODIS), Multiangle Imaging SpectroradiomeSpectroradiome-ter (MISR), and others. However, due to the limited number of spectral bands and the lack of onboard calibration for these 25
early sensors, the uncertainty associated with trends calculated using measurements from them can be significant.
ACPD
12, 8465–8501, 2012Global and regional trends of aerosol optical depth over
land and ocean
N. C. Hsu et al.
Title Page
Abstract Introduction
Conclusions References
Tables Figures
◭ ◮
◭ ◮
Back Close
Full Screen / Esc
Printer-friendly Version
Interactive Discussion
Discussion
P
a
per
|
Dis
cussion
P
a
per
|
Discussion
P
a
per
|
Discussio
n
P
a
per
|
in 1997, it has been the major source for providing a comprehensive global data set of such measurements. However, the unprecedented set of well-calibrated radi-ances measured in the wavelength range from the visible (412 nm) to the near infrared (865 nm) also make it well-suited to providing information about atmospheric aerosols (McClain et al., 1998). In this study, we will attempt to estimate trends in aerosol opti-5
cal depth (AOD) at 550 nm over land and ocean using SeaWiFS measurements from 1997 to 2010 using a new SeaWiFS aerosol dataset that has been produced as part of NASA’s MEaSUREs project (http://disc.sci.gsfc.nasa.gov/measures).
We begin in Sect. 2 by evaluating the performance of the sensor calibration and aerosol retrieval algorithm throughout the entire SeaWiFS mission. Section 3 describes 10
our methodology for trend determination. This is followed, in Sect. 4, by a discussion of the resulting annual and seasonal trends from SeaWiFS and comparisons to ground-based measurements from the Aerosol Robotic Network (AERONET, Holben et al., 1998). A summary and conclusions based on our study are given in the closing section.
2 Satellite data and their uncertainties for trend analysis
15
Since 90 % of the top-of-the-atmosphere (TOA) radiance received by a satellite sensor over ocean comes from contributions of the atmosphere such as Rayleigh and aerosol scattering, less than 10 % of the signal is attributable to the ocean itself. Consequently, the level of accuracy, precision, and long-term stability needed in radiometric mea-surements from such a sensor is much higher for ocean color retrievals than those 20
needed for corresponding land or atmospheric products. As a result of rigorous on-orbit calibration techniques developed using a combination of lunar and solar diffuser measurements and vicarious procedures, the NASA Ocean Biology Processing Group (OBPG) Calibration and Validation Team achieved an extraordinary level of absolute accuracy (1–2 %), precision (0.1 %) and, most importantly, long-term stability (0.3 % 25
ACPD
12, 8465–8501, 2012Global and regional trends of aerosol optical depth over
land and ocean
N. C. Hsu et al.
Title Page
Abstract Introduction
Conclusions References
Tables Figures
◭ ◮
◭ ◮
Back Close
Full Screen / Esc
Printer-friendly Version
Interactive Discussion
Discussion
P
a
per
|
Dis
cussion
P
a
per
|
Discussion
P
a
per
|
Discussio
n
P
a
per
|
The SeaStar platform carrying SeaWiFS was launched with a nominal center-of-swath equatorial overpass time of around noon for the daytime (descending) node. This drifted slowly through the mission into a later orbit, although remained before 12:30 p.m. until 2005; the time reached a maximum around 02:40 p.m. in July 2010, after which an orbit raising maneuver was performed to return the orbit slowly closer to 5
noon. Smirnov et al. (2002) investigated the diurnal cycle of AOD at various AERONET sites. Over this range of local times, the change in mid-visible AOD was found to be of order of a few percent or less of the daily mean AOD for most aerosol types; the most rapid diurnal variability was generally in early morning or late afternoon. This suggests that the drift in SeaWiFS orbit time is unlikely to introduce significant artifacts 10
into derived trends.
The SeaWiFS product used in this study is based upon the SeaWiFS v003 dataset that is available from http://disc.gsfc.nasa.gov/dust. This dataset spans the time period September 1997 to December 2010 and is the result of an effort funded by NASA’s MEaSUREs project to produce a long-term aerosol data record from SeaWiFS. This 15
aerosol retrieval system utilizes a combination of the Deep Blue algorithm over land (Hsu et al., 2004, 2006) and the SeaWiFS Ocean Aerosol Retrieval (SOAR) algorithm over ocean (Sayer et al., 2012a). The Level 2 products are derived with a horizontal resolution of approximately 13.5 km at nadir and include spectral AOD, ˚Angstr ¨om ex-ponent, and single scattering albedo (for dust aerosols) over land and spectral AOD, 20
˚
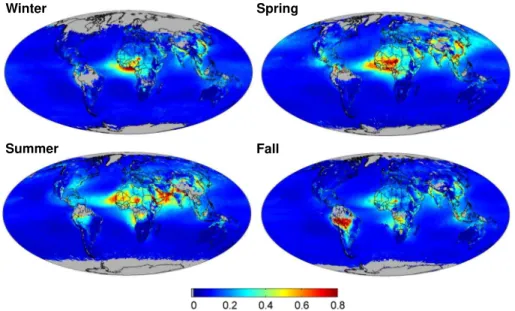
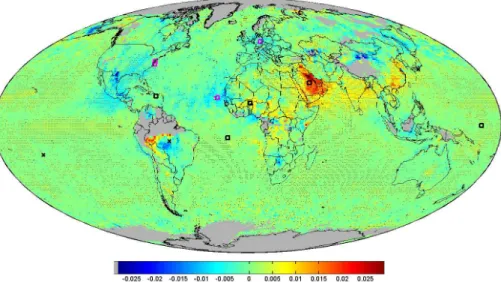
Angstr ¨om exponent, and fine mode fractional aerosol volume over ocean. Level 3 (grid-ded) products are available for daily and monthly averages at both 0.5◦×0.5◦and 1◦×1◦ resolutions. Figure 1 shows an example of the resulting seasonally-averaged AOD at 550 nm throughout the 13 yr mission using this newly-developed product. In this study, we used the Level 3 1◦×1◦ spatial resolution monthly mean SeaWiFS AOD data at 25
550 nm to calculate aerosol trends that could be efficiently compared with other satel-lite products.
mea-ACPD
12, 8465–8501, 2012Global and regional trends of aerosol optical depth over
land and ocean
N. C. Hsu et al.
Title Page
Abstract Introduction
Conclusions References
Tables Figures
◭ ◮
◭ ◮
Back Close
Full Screen / Esc
Printer-friendly Version
Interactive Discussion
Discussion
P
a
per
|
Dis
cussion
P
a
per
|
Discussion
P
a
per
|
Discussio
n
P
a
per
|
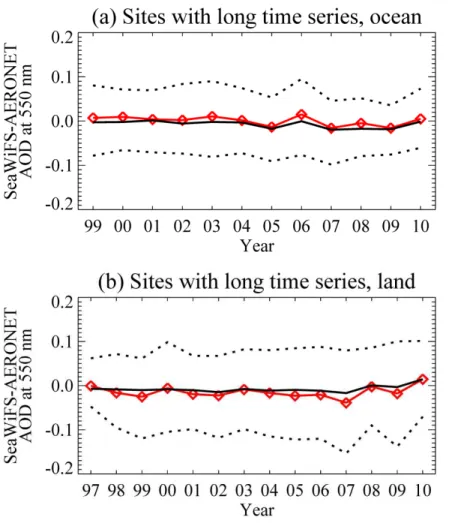
surements (Holben et al., 1998, Smirnov et al., 2000) and other satellite products is presented for land in Sayer et al. (2012a) and for ocean in Sayer et al. (2012b). Briefly, on a global basis, over one standard deviation (68 %) of AOD matchups were found to agree within an absolute expected error of 0.03±15 % over ocean and 0.05±20 % over land at 550 nm. Since a change in the quality of the retrieval with time could mask 5
or amplify any true change in AOD, it was also imperative to make an assessment of the temporal stability for this dataset. We therefore calculated the differences in 550 nm AOD between SeaWiFS and AERONET data as a function of year over ocean and land separately; the results are depicted in Fig. 2 (methodology and general validation re-sults are presented by Sayer et al., 2012a, b). Only the best quality SeaWiFS data, with 10
a quality assurance (QA) of 3 over land and a QA of 2 and 3 over ocean, are included in our analyses (as recommended in the aforementioned references). Also, in order to ensure the consistency of AERONET measurement locations throughout the SeaWiFS lifetime, only AERONET sites with records lasting for most or all of the SeaWiFS time series are considered, as otherwise an apparent change in comparison statistics could 15
simply be the result of changes in regional sampling.
For retrievals over land, the stations used in our analysis are Alta Floresta, Avignon, Banizoumbou, Beijing, Bondville, Bratts Lake, the CART site, Dakar, Dalanzadgad, GSFC, HJ Andrews, Ilorin, IMS METU-Erdemli, Ispra, Kanpur, MD Science Center, Mongu, Sede Boker, Sevilleta, Skukuza, Solar Village, and Wallops. Figure 2 shows 20
that the median and mean AOD difference between SeaWiFS and AERONET for these sites is generally small and negative; therefore, for a typical case, SeaWiFS is likely to have a slightly low bias. The lines are reasonably stable over time, suggesting that the quality of the dataset does not change throughout the SeaWiFS mission. The intercept of the best-fit line of the mean error against time is−0.016(±0.007), with a gradient of 25
ACPD
12, 8465–8501, 2012Global and regional trends of aerosol optical depth over
land and ocean
N. C. Hsu et al.
Title Page
Abstract Introduction
Conclusions References
Tables Figures
◭ ◮
◭ ◮
Back Close
Full Screen / Esc
Printer-friendly Version
Interactive Discussion
Discussion
P
a
per
|
Dis
cussion
P
a
per
|
Discussion
P
a
per
|
Discussio
n
P
a
per
|
Over ocean, fewer sites are available, particularly for the early part of the time series, so only the years 1999–2010 are considered, from the AERONET sites at Arica, Capo Verde, Dakar, Helgoland, IMS METU-Erdemli, La Parguera, Nauru, Shirahama, and Venise. The intercept of −0.008(±0.005) and gradient of−0.0014(±0.0008) per year of the best-fit line are not significantly different from zero at the 95 % confidence level 5
(the gradient is significant at the 90 % level, but is small in magnitude).
These results give confidence that the SeaWiFS aerosol dataset is suitable for the analysis of changes in AOD over this period. This does, of course, rely on the as-sumption that the evaluation at these sites is a good representation of the whole globe, although in the absence of long-term aerosol measurements at every location, this 10
cannot be assessed directly.
3 Methodology
In order to show changes in spatial and temporal distribution of aerosol loading, linear trends were calculated based on the 1◦
×1◦spatial resolution monthly mean SeaWiFS AOD data, from September 1997 to December 2010. These monthly datasets are cal-15
culated as the simple mean of the daily mean AOD for each month; the daily mean is computed from all those retrievals of sufficiently high QA (2 or 3 over ocean, 3 over land). In order to remove the large influence of the annual cycle, the data were first deseasonalized by obtaining the time series of AOT anomaly for each grid cell. The anomaly is defined as difference between monthly variation and climatology (i.e., the 20
month-wise average over all the years). A least-squares fit was applied to the AOD anomaly time series to get the slope coefficient of the linear regression that represents annual trend (AOD yr−1).
The statistical significance of the linear regression was assessed using the analysis of variance procedure which involves testing the F statistic and associated p value. 25
ACPD
12, 8465–8501, 2012Global and regional trends of aerosol optical depth over
land and ocean
N. C. Hsu et al.
Title Page
Abstract Introduction
Conclusions References
Tables Figures
◭ ◮
◭ ◮
Back Close
Full Screen / Esc
Printer-friendly Version
Interactive Discussion
Discussion
P
a
per
|
Dis
cussion
P
a
per
|
Discussion
P
a
per
|
Discussio
n
P
a
per
|
indicated as “dots” on global trend distribution maps for regions that are statistically significant at the 95 % confidence level, and the null hypothesis (that the regression coefficients are not statistically different from zero) can be rejected.
As least-squares regression can be sensitive to outliers, autocorrelation, and het-eroscedasticity of errors in the input data, linear AOD trends were also estimated using 5
the non-parametric Theil-Sen (aka “median gradients”) method, which is an estima-tor robust to these difficulties (Theil, 1950; Sen, 1968). Global trends calculated using the Theil-Sen method were within approximately 10 % of the least-squares regression values for all the sensors considered, suggesting the least-squares model is appropri-ate for this situation. As the least-squares regression technique more readily provides 10
uncertainty estimates, only the least-squares results are used hereafter.
4 Results and discussions
4.1 Correlations between SeaWiFS AOD anomaly with ENSO and NAO
In order to estimate global and regional trends in AOD, we need to first examine the inter-annual variability of the aerosol distribution and its relationship with large-scale 15
climatic variations such as the El Ni ˜no/La Ni ˜na-Southern Oscillation (ENSO) and the North Atlantic Oscillation (NAO). These large-scale meteorological processes could perturb the aerosol distributions through changes in aerosol emissions by altering the precipitation and soil moisture or in aerosol transport via varying the atmospheric circu-lation. The correlation coefficients (R) are calculated between deseasonalized monthly 20
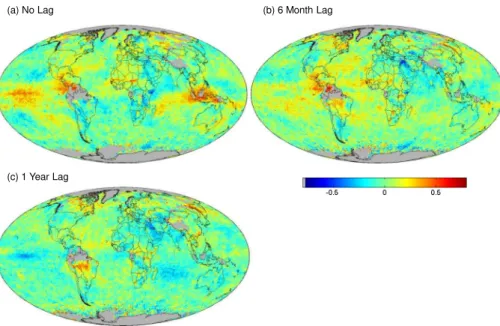
SeaWiFS AOD anomalies and the Multivariate ENSO Index (MEI; Wolter and Timlin, 1993, 1998) from 1997 to 2010.
As shown in Fig. 3a, the most prominent regions of high correlation with ENSO signa-tures are in the tropics near Indonesia and Central America. In Indonesia/Borneo, fires are primarily used to clear vegetation waste associated with deforestation for agricul-25
ACPD
12, 8465–8501, 2012Global and regional trends of aerosol optical depth over
land and ocean
N. C. Hsu et al.
Title Page
Abstract Introduction
Conclusions References
Tables Figures
◭ ◮
◭ ◮
Back Close
Full Screen / Esc
Printer-friendly Version
Interactive Discussion
Discussion
P
a
per
|
Dis
cussion
P
a
per
|
Discussion
P
a
per
|
Discussio
n
P
a
per
|
dry and precipitation is low. These smoke plumes, which can often stretch over hun-dreds of kilometers, are readily observed by satellites. The times series of SeaWiFS monthly AOD anomaly along with ENSO index is shown in Fig. 4 and indicates that the intensity of resulting smoke is predominantly linked to El-Nino-induced droughts over this region; strong peaks are seen in the years 1997–1998, 2002, and 2006.
5
The amount of precipitation affects the interannual variability of biomass burning ac-tivities and dust emission through changes in surface moisture; since these effects could be accumulative, we also calculate the correlation coefficients between SeaW-iFS AOD anomaly and the ENSO index with various time lags. Figure 3b, c shows these AOD anomaly correlations with ENSO index leading by six months and one year, 10
respectively. We note that the intensity of biomass burning smoke in Central America is sensitive not only to the ENSO induced rainfall changes during the peak burning season, but also to those accumulated throughout several months prior to the start of burning (i.e., on a 6-month time lag as shown in Fig. 3b). The lag time for South America appears to be even longer (i.e., 6 months to a year) compared to that for Central Amer-15
ica. Such time lags between ENSO and fire season severity in South America have also been reported by Chen et al. (2011), with significant lagged correlations emerging on a 3–7 month time scale. However, there seems to be little time lag observed over Indonesia between AOD anomaly and ENSO-induced drought. This is probably indica-tive of the differences in agriculture/land clearing practices between South America, 20
Central America, and Indonesia.
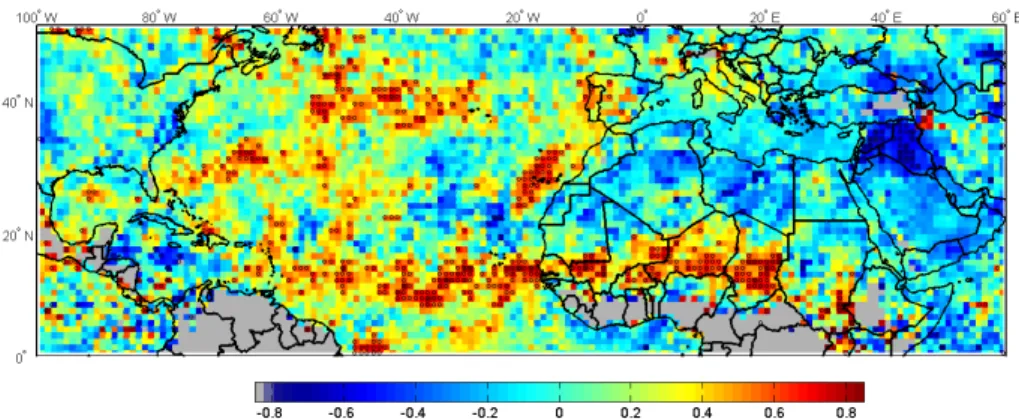
The results shown in Fig. 5 indicate that summertime Saharan dust loadings highly correlate (R >0.5 at 95 % confidence) with the ENSO index from 6 months earlier over dust source regions in Northern Sahel, as well as over the Atlantic along the dust transport pathway reaching as far as Barbados, West Indies. This is consistent with 25
ACPD
12, 8465–8501, 2012Global and regional trends of aerosol optical depth over
land and ocean
N. C. Hsu et al.
Title Page
Abstract Introduction
Conclusions References
Tables Figures
◭ ◮
◭ ◮
Back Close
Full Screen / Esc
Printer-friendly Version
Interactive Discussion
Discussion
P
a
per
|
Dis
cussion
P
a
per
|
Discussion
P
a
per
|
Discussio
n
P
a
per
|
apparently more influenced by the year-to-year variability of the precipitation, as ex-pected. Besides the transport route from the Sahel to Barbados, the high ENSO/AOD correlation results shown in Fig. 5 also indicate the possibility of a widespread associ-ation between ENSO and dust transport in the western and northern parts of the North Atlantic along the edge of the Saharan dust outflow regions. This anomalous pattern 5
also coincides with the main development region (MDR), primarily between 10◦–20◦N,
of tropical cyclone activity in the Atlantic. This is likely to be linked to the effects of ENSO induced changes of the atmospheric dynamics and circulation on the summer time Saharan dust transport into the Atlantic.
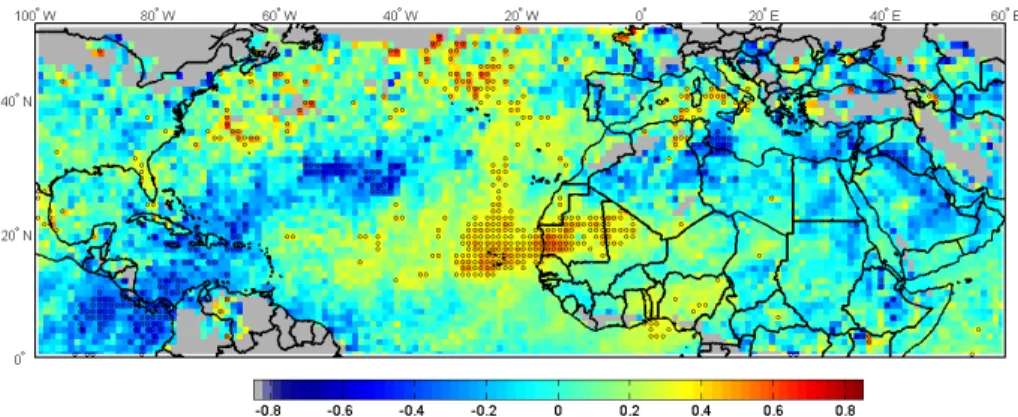
The effects of the NAO on the Saharan dust distribution are also investigated as 10
shown in Fig. 6. The NAO is one of the dominant factors of winter climate variability in the North Atlantic region, spanning Central North America and Europe. The NAO winter index used in this study is based upon the difference of normalized sea level pressure between Lisbon, Portugal and Stykkisholmur, Iceland (Hurrell, 1995). Based upon the results in Fig. 6, a sizeable and statistically significant (at 95 % confidence) 15
correlation (R >0.5) between is apparent between the SeaWiFS AOD anomaly and NAO index over extensive areas encompassing the western part of the North African continent into the North Atlantic. In addition, we also observe a secondary branch of positive correlation that is statistically significant along the pollution outflow of the Eastern US across the most northern edge of the Atlantic. We found no statistically 20
significant correlation over this region for seasons other than winter. This is consistent with the findings of Ginoux et al. (2004) and Chiapello et al. (2005) based upon the 17-yr record of TOMS data (1979–2000, except for 1982 and 1993–1996).
These results suggest that, while the NAO has a large influence on the wintertime dust distribution over the Atlantic, significant variability of the AOD anomaly in this re-25
ACPD
12, 8465–8501, 2012Global and regional trends of aerosol optical depth over
land and ocean
N. C. Hsu et al.
Title Page
Abstract Introduction
Conclusions References
Tables Figures
◭ ◮
◭ ◮
Back Close
Full Screen / Esc
Printer-friendly Version
Interactive Discussion
Discussion
P
a
per
|
Dis
cussion
P
a
per
|
Discussion
P
a
per
|
Discussio
n
P
a
per
|
Therefore, trend determination in the tropical regions is more susceptible to the in-fluence of these large-scale climatic driving forces and consequently more difficult to derive, as compared to those outside the tropics.
4.2 Global trend
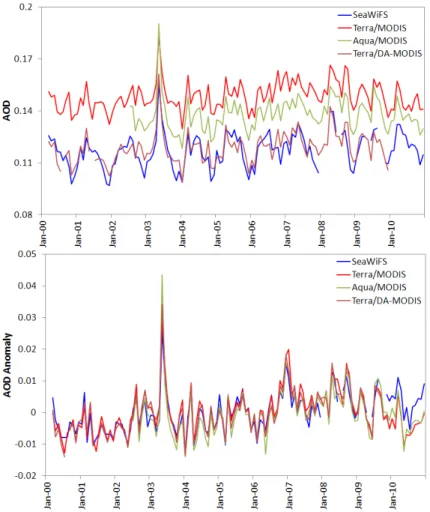
Figure 7 shows comparisons of the time series of absolute AOD and AOD anomaly 5
averaged over global ocean from SeaWiFS with those from MODIS Terra (data record beginning in 2000) and Aqua (beginning 2002). Although there is an offset between MODIS Terra and Aqua in terms of absolute values of AOD, the short-term tendency during the overlapping period is similar between the two (Zhang and Reid, 2010). This comparison shows that the interannual variability of the SeaWiFS AOD anomaly fol-10
lows both MODIS Terra and Aqua until mid-2009. From 2009 onwards, the SeaWiFS AOD anomaly is higher than that from MODIS, resulting in a more positive trend over global ocean compared to the MODIS values. According to Fig. 2, the comparisons of SeaWiFS retrieved AOD at 550 nm with the AERONET values do not indicate any drift from the zero line after the mid 2009.
15
It is worth pointing out that long-term global ocean AOD measurements based on AVHRR data have been shown to have a downward tendency for the period 1982– 2005 (Mischenko et al., 2007; Zhao et al., 2008). Although revised calibration proce-dures applied to AVHRR radiances have broadly resulted in comparable AOD when compared to MODIS (Zhao et al., 2008; Li et al., 2009), the short-term trends of AOD 20
in the period of overlap between MODIS and AVHRR are opposite in sign (positive for MODIS and negative for AVHRR) for the period 2000–2005 (Li et al., 2009; Zhang and Reid, 2010). This downward trend in AVHRR data continues until 2009, based on our analysis of the PATMOS-x AOD data (not shown), which is in contrast to the trends observed from SeaWiFS and MODIS from this study.
25
ACPD
12, 8465–8501, 2012Global and regional trends of aerosol optical depth over
land and ocean
N. C. Hsu et al.
Title Page
Abstract Introduction
Conclusions References
Tables Figures
◭ ◮
◭ ◮
Back Close
Full Screen / Esc
Printer-friendly Version
Interactive Discussion
Discussion
P
a
per
|
Dis
cussion
P
a
per
|
Discussion
P
a
per
|
Discussio
n
P
a
per
|
(ATSR-2) and AVHRR data for 1995–2001. They found that the global downward trend in the AVHRR AOD was largely driven by the southern oceans, for which the latitudinal range of sampling during daylight hours changed significantly during the study period, due to drifts in the AVHRR platform’s orbit. Even for those regions where daylight avail-ability is not an issue, diurnal variavail-ability in cloud cover can lead to changes in the 5
availability of clear-sky pixels for AOD retrieval as the satellites drift, resulting in further sampling bias (e.g., Devasthale et al., 2012). The drifts in orbit time for the AVHRR sen-sors were generally larger than for SeaWiFS, and when compositing multiple AVHRR records together to create a longer time series, there are time discontinuities when one satellite is replaced by the next. Additionally, other factors contributing to this noted dif-10
ference may be related to data sampling issues arising from different cloud-screening schemes employed by AVHRR and SeaWiFS/MODIS.
Also shown in Fig. 7 is the time series of over-ocean AOD and anomaly from the data assimilation (DA) grade MODIS-Terra dataset, which is an attempt to create a product suitable for DA through bias correction and additional quality screening of the MODIS 15
Collection 5 aerosol product (Zhang and Reid, 2006; Shi et al., 2011). Only the period 2000–2009 is available. These time series track the SeaWiFS record very closely. This is consistent with Sayer et al. (2012), who found, for collocated daily DA MODIS-Terra and SeaWiFS data over ocean, a correlation of 0.87 and bias of−0.006 between the two (SeaWiFS lower). In contrast, the Collection 5 MODIS Terra had a slightly lower 20
correlation with SeaWiFS (0.80), and SeaWiFS a more negative bias (−0.027). Only Terra data are shown; the offset between the two MODIS sensors becomes smaller in the DA-MODIS product (Shi et al., 2011; Sayer et al., 2012).
Zhang and Reid (2010) found, using a similar methodology to this study, an annual trend of 0.001 yr−1in global-average over-ocean DA MODIS Terra AOD (and a similar 25
ACPD
12, 8465–8501, 2012Global and regional trends of aerosol optical depth over
land and ocean
N. C. Hsu et al.
Title Page
Abstract Introduction
Conclusions References
Tables Figures
◭ ◮
◭ ◮
Back Close
Full Screen / Esc
Printer-friendly Version
Interactive Discussion
Discussion
P
a
per
|
Dis
cussion
P
a
per
|
Discussion
P
a
per
|
Discussio
n
P
a
per
|
the magnitude of this trend decreased by a factor of three, and it became statistically insignificant. Their best estimate is therefore that there has been no significant change in global-average over-ocean AOD during this period.
The resulting annual trends of SeaWiFS AOD anomaly over both land and ocean are derived for each 1◦
×1◦grid cell and are shown in Fig. 8. Points marked with dots 5
indicate trends significant at the 95 % confidence level (p-value<0.05). For compar-ison, we also calculate trends based upon AERONET measurements over selected sites using the same methodology, where sufficient and more-or-less continuous data records were acquired over a similar time period to SeaWiFS. These AERONET values and the corresponding SeaWiFS trends are listed in Table 1. Also, to help visualize the 10
SeaWiFS and AERONET trend comparisons in the context of the surrounding regions and over the whole globe, we superimpose the locations of AERONET sites on top of the SeaWiFS annual trend map in Fig. 7. The black and pink boxes and symbol (×) represent negative, positive, and negligible trends from AERONET data, respectively.
In general, the annual trends from 1998 to 2010 are small over most of the world. 15
However, for the mineral dust dominant regions, strong positive trends are seen over the Arabian Peninsula, while negligible trends of no statistical significance exist over most of the desert regions in China. In contrast, there is a negative tendency in the surrounding regions of the western part of North Africa as well as the Atlantic. This downward trend, which is most likely associated with the decreasing export of Saharan 20
dust from North Africa into the Atlantic, is also reflected in the AERONET data at Capo Verde. For fine mode anthropogenic aerosols, positive trends are observed in the fast developing countries over India and Eastern/Southern China, most likely associated with an increase in urban/industrial pollution. Negative trends are also seen over East-ern US and Europe, which are consistent with the AERONET trends at GSFC/COVE, 25
ACPD
12, 8465–8501, 2012Global and regional trends of aerosol optical depth over
land and ocean
N. C. Hsu et al.
Title Page
Abstract Introduction
Conclusions References
Tables Figures
◭ ◮
◭ ◮
Back Close
Full Screen / Esc
Printer-friendly Version
Interactive Discussion
Discussion
P
a
per
|
Dis
cussion
P
a
per
|
Discussion
P
a
per
|
Discussio
n
P
a
per
|
significant for other areas such as South America, North America, Africa, and South-east Asia.
Finally, it is evident from the results shown in Table 1 that, except for Capo Verde and COVE, most of the island/coastal AERONET measurements exhibit either positive or negligible trends over the tropical Pacific (Tahiti and Nauru), South Atlantic (Ascension 5
Island), the Caribbean (La Parguera), and the Northwest Pacific (Shirahama). The cor-responding trend values derived from the SeaWiFS records seem to be comparable to those from the AERONET data.
4.3 Seasonal and regional trends
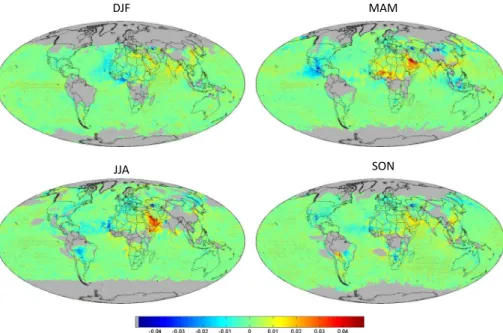
Since, as shown in Fig. 1, there is strong seasonality in both the emission intensities 10
of natural and anthropogenic aerosols over various source regions and their impact on large-scale aerosol distributions, trend analyses were performed separately for each season. These seasonal trends were calculated over each 10×10 grid for the DJF, MAM, JJA and SON time spans and are presented in Fig. 9. The corresponding time series of seasonal mean AOD anomaly over Northern India (20◦–30◦N, 75◦–85◦E),
15
Eastern China (30◦–40◦N, 110◦–120◦E), the Arabian Peninsula (10◦–35◦N, 35◦–60◦E), Europe (43◦–55◦N, 0◦–30◦E), and the Eastern United States (30◦–45◦N, 70◦–90◦W) are shown in Fig. 10. In order to have a reasonable temporal distribution in the analy-sis, trends were computed based on the time series of individual months for a partic-ular season (stacked together), instead of calculating a seasonal mean trend. In other 20
words, a slope coefficient was estimated from a time series consisting of DJF 1997, followed by DJF 1998 and so forth, thus from a total of 39 data points. Linear trends and their significance are shown in Fig. 9 in the same fashion as in Fig. 8.
It is apparent from the results shown in Fig. 9 that there are strong positive trends over both the Arabian Peninsula as well as the surrounding Arabian Sea, especially 25
ACPD
12, 8465–8501, 2012Global and regional trends of aerosol optical depth over
land and ocean
N. C. Hsu et al.
Title Page
Abstract Introduction
Conclusions References
Tables Figures
◭ ◮
◭ ◮
Back Close
Full Screen / Esc
Printer-friendly Version
Interactive Discussion
Discussion
P
a
per
|
Dis
cussion
P
a
per
|
Discussion
P
a
per
|
Discussio
n
P
a
per
|
to upward trends in AOD over surrounding oceanic regions largely associated with the spring- and summer-time dust outflow. We also found supporting evidence of a systematically increasing aerosol loading tendency from AERONET observations at Solar Village in Saudi Arabia, as well as a decreasing trend in ˚Angstr ¨om exponent (440 nm–870 nm) for the period 1999–2010 (Fig. 11). Recently, Yoon et al. (2011a) also 5
reported an increasing (decreasing) AOD ( ˚Angstr ¨om exponent) for the period 2001– 2008, based on analysis of AERONET data from the Solar Village site. The upward trend in AOD from AERONET data is 0.018 yr−1for the 11-yr period shown in Fig. 11,
while a positive trend is also obtained from the SeaWiFS data for the overlapping period over a 1◦×1◦ region collocated with the Solar Village site (Table 1). Furthermore, we 10
discern from the top panel of Fig. 11 that the seasonal cycle of aerosol loading has strengthened on an approximate inter-annual scale, with measurable decrease in the
˚
Angstr ¨om exponent. These observations lead us to posit that the seasonal cycle of dust emissions (loading as well as outflow) has strengthened in the past 11–13 yr spanning the AERONET and SeaWiFS data record over this region. The region-wide trend from 15
the SeaWiFS AOD data record (September 1997 to December 2010) is estimated to be 0.009 yr−1(
±0.00076) when averaged over the Arabian Peninsula (10◦N–35◦N, 35◦E– 60◦E). As clearly noted in the spatial trend distribution (Fig. 8), this large regional trend
is an order of magnitude higher than the global mean trend (land and ocean) as well as the global mean trend only over land.
20
The global mean trends are weakly positive with large variability and are only rep-resentative for the relatively short time scale of the data record (a little over 13 yr) and therefore are deemed to be negligible or not significant. However, it is important to emphasize the large sustained upward trends observed over the Arabian Peninsula and the need to monitor future trends, and/or construct a longer-term aerosol record in 25
retrospect to better quantify the changes in aerosol loading, causes and regional (and downwind) climate impacts.
ACPD
12, 8465–8501, 2012Global and regional trends of aerosol optical depth over
land and ocean
N. C. Hsu et al.
Title Page
Abstract Introduction
Conclusions References
Tables Figures
◭ ◮
◭ ◮
Back Close
Full Screen / Esc
Printer-friendly Version
Interactive Discussion
Discussion
P
a
per
|
Dis
cussion
P
a
per
|
Discussion
P
a
per
|
Discussio
n
P
a
per
|
the North Atlantic, particularly during the winter season. However, these patterns in the trends seem to coincide with the AOD-NAO correlation map depicted in Fig. 6. There-fore, the negative trend in the SeaWiFS AOD anomaly during the winter months is likely a reflection of the downward trend in the NAO strength from 1997 to 2010. Similarly, the locations of negative trends in the summer AOD anomaly over the Sahel and across 5
the Atlantic also mimic the AOD-ENSO correlation shown in Fig. 5. Consequently, the large-scale meteorological processes such as NAO and ENSO largely regulate the ex-port of the Saharan dust in the Atlantic. Overall, trends observed over the North Africa exhibit relatively smaller trends and weak seasonal dependency. However, there seems to be a significant positive trend over the Sahel region during springtime which is also 10
reflected in the AERONET data at Banizoumbou.
Over East Asia, the aerosol loading appears to exhibit negligible trends of no statis-tical significance in Eastern China during the active dust outbreak season (i.e., spring-time); the corresponding AOD anomaly time series is depicted in Fig. 10 (top-right panel). The amount of mineral dust reaching this region seems to decrease from 1998 15
to 2004–2005, but became quite high again in the later years (2006–2010). Overall, the insignificant trends for the dust-dominant season over Eastern China are due to large inter-annual variability in the observed aerosol loading. In South Asia, the regions over Northern India along the Indo-Gangetic plain are often influenced during the pre-monsoon season with heavy dust plumes transported from the Thar Desert in North-20
western India (Gautam et al., 2011). Based upon Fig. 10 (top-left panel), these dust activities seem to increase significantly from 1998 and peak around 2003. However, since 2003 the dust intensity is seen to steadily decrease during the spring (MAM). Recent studies based on satellite observations from MISR and MODIS have also al-luded to this decrease in dust loading over Northern India from 2000 onwards (Dey and 25
ACPD
12, 8465–8501, 2012Global and regional trends of aerosol optical depth over
land and ocean
N. C. Hsu et al.
Title Page
Abstract Introduction
Conclusions References
Tables Figures
◭ ◮
◭ ◮
Back Close
Full Screen / Esc
Printer-friendly Version
Interactive Discussion
Discussion
P
a
per
|
Dis
cussion
P
a
per
|
Discussion
P
a
per
|
Discussio
n
P
a
per
|
For biomass burning regions such as Indonesia, South America, and in particular Central America, the aerosol trends are observed to be negative from 1998 to 2010. However, the year-to-year variabilities of smoke emission over these regions are most likely driven by the ENSO induced effects discussed in the previous section. Our cal-culations also show that there are no observed aerosol trends of statistical significance 5
over Southeast Asia (i.e., Indo-China) as well as regions in North America, Europe, and Siberia where forest fires frequently occur.
Over regions where anthropogenic fine mode aerosols are prevalent, our study shows that there are downward trends in AOD over the Eastern US and Europe during the summer months (i.e., the peak season of air pollution build-up in these regions). 10
However, for the rapidly developing countries in Asia, the AOD tendencies are pos-itive. In particular, during the heavy winter haze months, significant upward trends are observed in the regions of Eastern and Southern China, the East China Sea, and in Northern and Central India and the surrounding oceanic regions, particularly over the Bay of Bengal. In contrast to the weak tendencies in the boreal spring/pre-15
monsoon months that are largely due to inter-annual variability of dust transport, the relatively stable conditions during dry winter/post-monsoon period favors accumulation of aerosols/pollutants. Hence, the upward trends are most likely due to increase in regional urban/industrial pollution. Yoon et al. (2011b), using SeaWiFS data (with a dif-ferent AOD retrieval algorithm) found positive trends in AOD during springtime and fall 20
over the Pearl River delta in China; positive trends in this region are also seen in this study, although only statistically-significant on an annual, rather than seasonal scale due to frequent cloud cover. In terms of overall trends, it is interesting to note that both East and South Asia exhibit similar patterns during the high aerosol loading seasons, i.e., a systematic increasing trend during the winter haze period and a rather vari-25
ACPD
12, 8465–8501, 2012Global and regional trends of aerosol optical depth over
land and ocean
N. C. Hsu et al.
Title Page
Abstract Introduction
Conclusions References
Tables Figures
◭ ◮
◭ ◮
Back Close
Full Screen / Esc
Printer-friendly Version
Interactive Discussion
Discussion
P
a
per
|
Dis
cussion
P
a
per
|
Discussion
P
a
per
|
Discussio
n
P
a
per
|
4.4 Zonal average trend
In order to help study the radiative effects of aerosols on Earth’s climate, we also com-pute zonal-averaged trends (averaged from 180◦W to 180◦E over both land and ocean) based upon this 13 yr SeaWiFS data record; these trends are displayed in Fig. 12 (right panel). Trends from zonal mean of AOD anomalies for both annual and seasonal aver-5
ages are calculated and shown from 55◦S to 55◦N at 5◦ intervals. The corresponding zonal averaged absolute AOD values are also depicted in Fig. 12 (left panel) for com-parison. As expected, the absolute AOD is much higher in the Northern Hemisphere compared to the Southern Hemisphere, which is mostly dominated by the oceans and is, in general, pristine. Most of the tropospheric aerosol burden resides between the 10
equator and 40◦N for all four seasons, except for the springtime Asian dust outbreak
which peaks at mid-latitudes in the Northern Hemisphere, and the biomass burning activities over South America, Africa, and Southeast Asia in the Southern Hemisphere during the fall months (SON).
As shown in Fig. 12 (right panel), the corresponding overall annual trends are mostly 15
positive over the latitude zone from equator to 30◦N, where most of the aerosol sources reside, although there are significant self-compensating positive and negative trends within this zone as depicted in Fig. 8. On a seasonal basis, the primary peak tendency in AOD occurs during the winter months around 25◦–40◦N and is largely associated with changes in India and China as well as adjacent waters. However, the springtime 20
zonal mean trends are slightly negative around 35◦–45◦N due to weak decreases over
the dust source regions in Northwestern China, while remaining positive in the 10◦– 30◦N latitude zone as a result of larger increasing trends in the Arabian Peninsula
dominating over the decreasing trend in Central America. The net positive summer trends over the tropics and subtropics in the Northern Hemisphere are also a product 25
burn-ACPD
12, 8465–8501, 2012Global and regional trends of aerosol optical depth over
land and ocean
N. C. Hsu et al.
Title Page
Abstract Introduction
Conclusions References
Tables Figures
◭ ◮
◭ ◮
Back Close
Full Screen / Esc
Printer-friendly Version
Interactive Discussion
Discussion
P
a
per
|
Dis
cussion
P
a
per
|
Discussion
P
a
per
|
Discussio
n
P
a
per
|
ing activities, peak in the fall (SON) months. Most of the aerosol tendency in this region is not statistically significant, especially near the smoke sources over land, due to large year-to-year fluctuation. However, a significant positive trend around 35◦S is detected, which may be linked to the increasing amount of biomass burning smoke transported out of Southern Australia and Southeastern Africa. Overall, significant upward trends in 5
annual mean AOD are found over the tropics and sub-tropics; they are largely amplified by the increasing dust emissions and outflow from the Arabian Peninsula during boreal spring and summer seasons.
5 Conclusions
Compared to other satellite sensors, SeaWiFS has unprecedentedly high accuracy 10
and long-term stability (1–2 % and 0.3 %, respectively) in radiometric calibration as a result of rigorous lunar, solar and vicarious calibrations performed by the OBPG team. Therefore, the corresponding long-term drift in SeaWiFS AOD time series due to sen-sor calibration is negligible. However, as described in Sect. 1, several other factors in addition to calibration, such as retrieval algorithm deficiency, could also contribute to 15
the temporal variability of satellite retrieved AOD data records. In order to examine the effect of retrieval algorithm on trend analysis, we compare the SeaWiFS v003 AOD products against ground-based AERONET measurements acquired over the 13 yr mis-sion lifetime. The results indicate that there is no apparent year-to-year shift over either land or ocean between these two measurements, suggesting that the SeaWiFS v003 20
data are suitable for estimating the interannual changes in AOD on both global and regional scales.
Our trend analyses based upon the SeaWiFS data from 1998 to 2010 show that the global annual trend of AOD during this period, although weakly positive, is essen-tially negligible when compared to the magnitudes of contributions from other factors, 25
ACPD
12, 8465–8501, 2012Global and regional trends of aerosol optical depth over
land and ocean
N. C. Hsu et al.
Title Page
Abstract Introduction
Conclusions References
Tables Figures
◭ ◮
◭ ◮
Back Close
Full Screen / Esc
Printer-friendly Version
Interactive Discussion
Discussion
P
a
per
|
Dis
cussion
P
a
per
|
Discussion
P
a
per
|
Discussio
n
P
a
per
|
derived from the MODIS sensors aboard Terra and Aqua. However, it is in opposite sign to AVHRR data during the overlapping years. On regional scales, the estimated trends in this study suggest that the AOD tendency could be significantly large. We note that there are decreasing trends over the Eastern US and Europe, possibly due to a corresponding decrease manmade air pollution levels. Yet, over the rapidly develop-5
ing countries such as China and India, significant increasing trends in AOD are seen in these source regions and their surrounding downwind oceans, particularly during the dry winter/post-monsoon months when the atmosphere is relatively stable, thus favoring accumulation of aerosols.
For the mineral dust-dominated parts of the world, strong positive trends are detected 10
over the Arabian Peninsula and the adjacent waters. In contrast, a negative tendency is observed in the emission and export of Saharan dust over the Western North Africa and the North Atlantic. Overall, based on 13 yr of data, a relatively contrasting pattern in trends seem to have emerged in the tropics/subtropics largely modulated by dust emis-sions and transport processes encompassing the Saharan arid lands and the Arabian 15
Peninsula and their downwind oceanic regions, with downward and upward tendencies, respectively.
In order to reduce the uncertainty in estimating climate forcing caused by tropo-spheric aerosols, it is important to produce the best quality climatology of aerosol properties with sufficient data length by merging aerosol information obtained from 20
the multiple satellite sensors that are currently available. SeaWiFS data extends from 1997 to 2010, which has many overlapping years with MODIS, MISR, AVHRR, and TOMS, and thus provides a good benchmark to characterize instrument drifts due to calibration for other satellite measurements. However, 13 yr of satellite measurements is not enough to establish long-term trends of aerosols, particularly in the tropics where 25
ACPD
12, 8465–8501, 2012Global and regional trends of aerosol optical depth over
land and ocean
N. C. Hsu et al.
Title Page
Abstract Introduction
Conclusions References
Tables Figures
◭ ◮
◭ ◮
Back Close
Full Screen / Esc
Printer-friendly Version
Interactive Discussion
Discussion
P
a
per
|
Dis
cussion
P
a
per
|
Discussion
P
a
per
|
Discussio
n
P
a
per
|
and to be flown on future JPSS satellites to achieve the statistically adequate length of data records necessary for climate studies.
Acknowledgement. This work was supported by the NASA MEaSUREs program, managed by
Martha Maiden. The authors gratefully acknowledge the efforts made by the SeaWiFS Ocean Biology Processing Group for producing the SeaWiFS level 1 data, the SeaDAS software, and
5
NCEP meteorological fields for SeaWiFS retrievals. We would also like to express our gratitude to several AERONET PIs in establishing and maintaining the long-term stations used in this investigation. We thank Jingfeng Huang for useful discussions related to Saharan dust activity and ENSO.
References
10
Chen, Y., Randerson, J. T., Morton, D. C., DeFries, R. S., Collatz, G. J., Kasibhatla, P. S., Giglio, L., Jin, Y., and Marlier, M. E.: Forecasting fire season severity in South America using sea surface temperature anomalies, Science, 334, 787, 2011.
Chiapello, I., Moulin, C., and Prospero, J. M.: Understanding the long-term variability of African dust transport across the Atlantic as recorded in both Barbados surface concentrations and
15
large-scale Total Ozone Mapping Spectrometer (TOMS) optical thickness, J. Geophys. Res., 110, D18S10, doi:10.1029/2004JD005132, 2005.
Devasthale, A., Karlsson, K.-G., Quaas, J., and Grassl, H.: Correcting orbital drift signal in the time series of AVHRR derived convective cloud fraction using rotated empirical orthogonal function, Atmos. Meas. Tech., 5, 267–273, doi:10.5194/amt-5-267-2012, 2012.
20
Dey, S. and Di Girolamo, L.: A decade of change in aerosol properties over the Indian subcon-tinent, Geophys. Res. Lett., 38, L14811, doi:10.1029/2011GL048153, 2011.
Eplee, R. E., Meister Jr., G., Patt, F. S., Franz, B. A., and McClain, C. R.: Uncertainty assess-ment of the SeaWiFS on-orbit calibration, Proc. SPIE, 8153, 815310, 2011.
Ginoux, P., Prospero, J., Torres, O., and Chin, M.: Long-term simulation of global dust
distri-25
bution with the GOCART model: correlation with North Atlantic Oscillation, Environ. Modell. Softw., 19, 113–128, 2004.
Gautam, R., Hsu, N. C., Tsay, S. C., Lau, K. M., Holben, B., Bell, S., Smirnov, A., Li, C., Hansell, R., Ji, Q., Payra, S., Aryal, D., Kayastha, R., and Kim, K. M.: Accumulation of aerosols over the Indo-Gangetic plains and southern slopes of the Himalayas: distribution,
ACPD
12, 8465–8501, 2012Global and regional trends of aerosol optical depth over
land and ocean
N. C. Hsu et al.
Title Page
Abstract Introduction
Conclusions References
Tables Figures
◭ ◮
◭ ◮
Back Close
Full Screen / Esc
Printer-friendly Version
Interactive Discussion
Discussion
P
a
per
|
Dis
cussion
P
a
per
|
Discussion
P
a
per
|
Discussio
n
P
a
per
|
properties and radiative effects during the 2009 pre-monsoon season, Atmos. Chem. Phys., 11, 12841–12863, doi:10.5194/acp-11-12841-2011, 2011.
Holben, B. N., Eck, T. F., Slutsker, I., Tanre, D., Buis, J. P., Setzer, A., Vermote, E., Reagan, J. A., Kaufman, Y., Nakajima, T., Lavenu, F., Jankowiak, I., and Smirnov, A.: AERONET – a federated instrument network and data archive for aerosol characterization, Remote Sens.
5
Environ., 66, 1–16, 1998.
Hsu, N. C., Tsay, S.-C., King, M. D., and Herman, J. R.: Aerosol properties over bright-reflecting source regions, IEEE Trans. Geosci. Remote Sens., 42, 557–569, 2004.
Hsu, N. C., Tsay, S.-C., King, M. D., and Herman, J. R.: Deep Blue retrievals of Asian aerosol properties during ACE-Asia, IEEE Trans. Geosci. Remote Sens., 44, 3180–3195, 2006.
10
Hurrell, J. W.: Decadal trend in the North Atlantic Oscillation: regional temperatures and pre-cipitations, Science, 269, 676–679, 1995.
Intergovernmental Panel on Climate Change (IPCC): The scientific basis, Cambridge University Press, Cambridge, UK and New York, NY, USA, 996 pp., 2007.
Kaskaoutis, D. G., Kharol, S. K., Sinha, P. R., Singh, R. P., Badarinath, K. V. S., Mehdi, W.,
15
and Sharma, M.: Contrasting aerosol trends over South Asia during the last decade based on MODIS observations, Atmos. Meas. Tech. Discuss., 4, 5275–5323, doi:10.5194/amtd-4-5275-2011, 2011.
Levy, R. C., Remer, L. A., Kleidman, R. G., Mattoo, S., Ichoku, C., Kahn, R., and Eck, T. F.: Global evaluation of the Collection 5 MODIS dark-target aerosol products over land, Atmos.
20
Chem. Phys., 10, 10399–10420, doi:10.5194/acp-10-10399-2010, 2010.
Li, Z., Zhao, X., Kahn, R., Mishchenko, M., Remer, L., Lee, K. H., Wang, M., Laszlo, I., Naka-jima, T., and Maring, H.: Uncertainties in satellite remote sensing of aerosols and impact on monitoring its long-term trend: a review and perspective, Ann. Geophys., 27, 2755–2770, 2009,
25
http://www.ann-geophys.net/27/2755/2009/.
Lu, Z., Zhang, Q., and Streets, D. G.: Sulfur dioxide and primary carbonaceous aerosol emis-sions in China and India, 1996–2010, Atmos. Chem. Phys., 11, 9839–9864, doi:10.5194/acp-11-9839-2011, 2011.
Meister, G., Franz, B. A., Kwiatkowska, E. J., and McClain, C. R.: Corrections to the calibration
30
ACPD
12, 8465–8501, 2012Global and regional trends of aerosol optical depth over
land and ocean
N. C. Hsu et al.
Title Page
Abstract Introduction
Conclusions References
Tables Figures
◭ ◮
◭ ◮
Back Close
Full Screen / Esc
Printer-friendly Version
Interactive Discussion
Discussion
P
a
per
|
Dis
cussion
P
a
per
|
Discussion
P
a
per
|
Discussio
n
P
a
per
|
Mishchenko, M. I., Geogdzhayev, I. V., Rossow, W. B., Cairns, B., Carlson, B. E., Lacis, A. A., Liu, L., and Travis, L. D.: Long-term satellite record reveals likely recent aerosol trend, Sci-ence, 315, 1543, doi:10.1126/science.1136709, 2007.
Prospero, J. M. and Lamb, P. J.: African droughts and dust transport to the Caribbean: Climate change implications, Science, 302, 1024–1027, 2003.
5
Ramanathan, V., Crutzen, P. J., Kiehl, J. T., and Rosenfeld, D.: Aerosols, climate and the hydro-logical cycle, Science, 294, 2119–2124, 2001.
Rosenfeld, D., Lohmann, U., Raga, G. B., O’Dowd, C. D., Kulmala, M., Fuzzi, S., Reissell, A., and Andreae, M. O.: Flood or drought: how do aerosols affect precipitation?, Science, 321, 1309–1313, doi:10.1126/science.1160606, 2008.
10
Sayer, A. M., Hsu, N. C., Bettenhausen, C., Ahmad, Z., Holben, B. N., Smirnov, A., Thomas, G. E., and Zhang, J.: SeaWiFS Ocean Aerosol Retrieval (SOAR): algo-rithm, validation, and comparison with other datasets, J. Geophs. Res, 117, D03206, doi:10.1029/2011JD016599, 2012a.
Sayer, A. M., Hsu, N. C., Bettenhausen, C., Jeong, M. J., Holben, B. N., and Zhang, J.: Global
15
and regional evaluation of over-land spectral aerosol optical depth retrievals from SeaWiFS, Atmos. Meas. Tech. Discuss., 5, 2169–2220, doi:10.5194/amtd-5-2169-2012, 2012.
Sen, P. K.: Estimates of the regression coefficient based on Kendall’s tau, J. Am. Stat. Assoc., 63, 1379–1389, 1968.
Shi, Y., Zhang, J., Reid, J. S., Holben, B., Hyer, E. J., and Curtis, C.: An analysis of the collection
20
5 MODIS over-ocean aerosol optical depth product for its implication in aerosol assimilation, Atmos. Chem. Phys., 11, 557–565, doi:10.5194/acp-11-557-2011, 2011.
Smirnov, A., Holben, B. N., Eck, T. F., Dubovik, O., and Slutsker, I.: Cloud-screening and qual-ity control algorithms for the AERONET database, Remote Sens. Environ., 73, 337–349, doi:10.1016/S0034-4257(00)00109-7, 2000.
25
Smirnov, A., Holben, B. N., Eck, T. F., Slutsker, I., Chatenet, B., and Pinker, R. T.: Diurnal variability of aerosol optical depth observed at AERONET (Aerosol Robotic Network) sites, Geophys. Res. Lett., 29, 2115, doi:10.1029/2002GL016305, 2002.
Theil, H.: A rank-invariant method of linear and polynomial regression analysis. I, II, III, Nederl. Akad. Wetensch. Proc., 53, 386–392, 521–525, 1397–1412, 1950.
30
ACPD
12, 8465–8501, 2012Global and regional trends of aerosol optical depth over
land and ocean
N. C. Hsu et al.
Title Page
Abstract Introduction
Conclusions References
Tables Figures
◭ ◮
◭ ◮
Back Close
Full Screen / Esc
Printer-friendly Version
Interactive Discussion
Discussion
P
a
per
|
Dis
cussion
P
a
per
|
Discussion
P
a
per
|
Discussio
n
P
a
per
|
for ATSR-2 and insights into the long term global AOD trend over the ocean, Atmos. Chem. Phys., 10, 4849–4866, doi:10.5194/acp-10-4849-2010, 2010.
Wolter, K. and Timlin, M. S.: Monitoring ENSO in COADS with a seasonally adjusted prin-cipal component index. Proc. of the 17th Climate Diagnostics Workshop, Norman, OK, NOAA/NMC/CAC, NSSL, Oklahoma Clim. Survey, CIMMS and the School of Meteor., Univ.
5
of Oklahoma, Norman, OK, 52–57, 1993.
Wolter, K. and Timlin, M. S., Measuring the strength of ENSO events – how does 1997/98 rank?, Weather, 53, 315–324, 1998.
Yoon, J., von Hoyningen-Huene, W., Kokhanovsky, A. A., Vountas, M., and Burrows, J. P.: Trend analysis of the Aerosol Optical Thickness and ˚Angstr ¨om Exponent derived from
10
the global AERONET spectral observations, Atmos. Meas. Tech. Discuss., 4, 5325–5388, doi:10.5194/amtd-4-5325-2011, 2011a.
Yoon, J., von Hoyningen-Huene, W., Vountas, M., and Burrows, J. P.: Analysis of linear long-term trend of aerosol optical thickness derived from SeaWiFS using BAER over Europe and South China, Atmos. Chem. Phys., 11, 12149–12167, doi:10.5194/acp-11-12149-2011,
15
2011b.
Zhang, J. and Reid, J. S., MODIS aerosol product analysis for data assimilation: assessment of over-ocean level 2 aerosol optical thickness retrievals, J. Geophys. Res., 111, D22207, doi:10.1029/2005JD006898, 2006.
Zhang, J. and Reid, J. S.: A decadal regional and global trend analysis of the aerosol optical
20
depth using a data-assimilation grade over-water MODIS and Level 2 MISR aerosol products, Atmos. Chem. Phys., 10, 10949–10963, doi:10.5194/acp-10-10949-2010, 2010.
Zhao, T. X.-P., Laszlo, I., Guo, W., Heidinger, A., Cao, C., Jelenak, A., Tarpley, D., and Sul-livan, J.: Study of long-term trend in aerosol optical thickness observed from operational AVHRR satellite instrument, J. Geophys. Res., 113, D07201, doi:10.1029/2007JD009061,
25
ACPD
12, 8465–8501, 2012Global and regional trends of aerosol optical depth over
land and ocean
N. C. Hsu et al.
Title Page
Abstract Introduction
Conclusions References
Tables Figures
◭ ◮
◭ ◮
Back Close
Full Screen / Esc
Printer-friendly Version
Interactive Discussion
Discussion
P
a
per
|
Dis
cussion
P
a
per
|
Discussion
P
a
per
|
Discussio
n
P
a
per
|
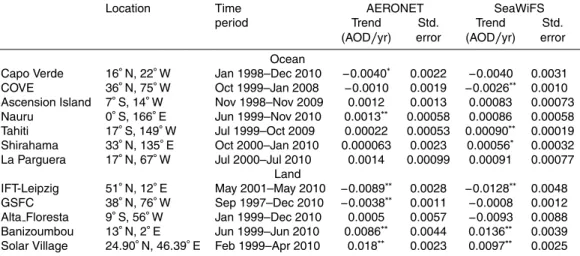
Table 1.Comparisons of SeaWiFS-derived trends with those from AERONET measurements.
Location Time AERONET SeaWiFS period Trend Std. Trend Std.
(AOD/yr) error (AOD/yr) error Ocean
Capo Verde 16◦N, 22◦W Jan 1998–Dec 2010
−0.0040∗ 0.0022 −0.0040 0.0031
COVE 36◦N, 75◦W Oct 1999–Jan 2008
−0.0010 0.0019 −0.0026∗∗ 0.0010
Ascension Island 7◦S, 14◦W Nov 1998–Nov 2009 0.0012 0.0013 0.00083 0.00073
Nauru 0◦S, 166◦E Jun 1999–Nov 2010 0.0013∗∗ 0.00058 0.00086 0.00058
Tahiti 17◦S, 149◦W Jul 1999–Oct 2009 0.00022 0.00053 0.00090∗∗ 0.00019
Shirahama 33◦N, 135◦E Oct 2000–Jan 2010 0.000063 0.0023 0.00056∗ 0.00032
La Parguera 17◦N, 67◦W Jul 2000–Jul 2010 0.0014 0.00099 0.00091 0.00077
Land IFT-Leipzig 51◦N, 12◦E May 2001–May 2010
−0.0089∗∗ 0.0028
−0.0128∗∗ 0.0048
GSFC 38◦N, 76◦W Sep 1997–Dec 2010
−0.0038∗∗ 0.0011 −0.0008 0.0012
Alta Floresta 9◦S, 56◦W Jan 1999–Dec 2010 0.0005 0.0057
−0.0093 0.0088 Banizoumbou 13◦N, 2◦E Jun 1999–Jun 2010 0.0086∗∗ 0.0044 0.0136∗∗ 0.0039
Solar Village 24.90◦N, 46.39◦E Feb 1999–Apr 2010 0.018∗∗ 0.0023 0.0097∗∗ 0.0025 ∗Indicates trends significant at 90 %.
ACPD
12, 8465–8501, 2012Global and regional trends of aerosol optical depth over
land and ocean
N. C. Hsu et al.
Title Page
Abstract Introduction
Conclusions References
Tables Figures
◭ ◮
◭ ◮
Back Close
Full Screen / Esc
Printer-friendly Version
Interactive Discussion
Discussion
P
a
per
|
Dis
cussion
P
a
per
|
Discussion
P
a
per
|
Discussio
n
P
a
per
|
Summer
Spring Winter
Fall
ACPD
12, 8465–8501, 2012Global and regional trends of aerosol optical depth over
land and ocean
N. C. Hsu et al.
Title Page
Abstract Introduction
Conclusions References
Tables Figures
◭ ◮
◭ ◮
Back Close
Full Screen / Esc
Printer-friendly Version
Interactive Discussion
Discussion
P
a
per
|
Dis
cussion
P
a
per
|
Discussion
P
a
per
|
Discussio
n
P
a
per
|
Fig. 2. Yearly variations in the differences between SeaWiFS and AERONET AOD over (a)
ACPD
12, 8465–8501, 2012Global and regional trends of aerosol optical depth over
land and ocean
N. C. Hsu et al.
Title Page
Abstract Introduction
Conclusions References
Tables Figures
◭ ◮
◭ ◮
Back Close
Full Screen / Esc
Printer-friendly Version
Interactive Discussion
Discussion
P
a
per
|
Dis
cussion
P
a
per
|
Discussion
P
a
per
|
Discussio
n
P
a
per
|
(a) No Lag (b) 6 Month Lag
(c) 1 Year Lag
Fig. 3. Correlation coefficients of SeaWiFS deseasonalized monthly AOD anomaly with the
multivariate ENSO index (MEI)(a) from the same month, (b) leading by 6 months, and (c)
ACPD
12, 8465–8501, 2012Global and regional trends of aerosol optical depth over
land and ocean
N. C. Hsu et al.
Title Page
Abstract Introduction
Conclusions References
Tables Figures
◭ ◮
◭ ◮
Back Close
Full Screen / Esc
Printer-friendly Version
Interactive Discussion
Discussion
P
a
per
|
Dis
cussion
P
a
per
|
Discussion
P
a
per
|
Discussio
n
P
a
per
|
Fig. 4.Time series of AOD anomaly and ENSO Index over Indonesia region (8◦S–8◦N,
ACPD
12, 8465–8501, 2012Global and regional trends of aerosol optical depth over
land and ocean
N. C. Hsu et al.
Title Page
Abstract Introduction
Conclusions References
Tables Figures
◭ ◮
◭ ◮
Back Close
Full Screen / Esc
Printer-friendly Version
Interactive Discussion
Discussion
P
a
per
|
Dis
cussion
P
a
per
|
Discussion
P
a
per
|
Discussio
n
P
a
per
|
1
Fig. 5.Lagged correlation of summertime average (JJA) mean AOD anomaly with winter (DJ)
ACPD
12, 8465–8501, 2012Global and regional trends of aerosol optical depth over
land and ocean
N. C. Hsu et al.
Title Page
Abstract Introduction
Conclusions References
Tables Figures
◭ ◮
◭ ◮
Back Close
Full Screen / Esc
Printer-friendly Version
Interactive Discussion
Discussion
P
a
per
|
Dis
cussion
P
a
per
|
Discussion
P
a
per
|
Discussio
n
P
a
per
|
1
Fig. 6.Correlation of AOD anomaly and NAO Index during winter (DJF) months. Dots indicate