AMTD
8, 9565–9609, 2015GOCI Yonsei Aerosol Retrieval (YAER)
algorithm and validation
M. Choi et al.
Title Page
Abstract Introduction
Conclusions References
Tables Figures
◭ ◮
◭ ◮
Back Close
Full Screen / Esc
Printer-friendly Version Interactive Discussion
Discussion
P
a
per
|
Discussion
P
a
per
|
Discussion
P
a
per
|
Discussion
P
a
per
|
Atmos. Meas. Tech. Discuss., 8, 9565–9609, 2015 www.atmos-meas-tech-discuss.net/8/9565/2015/ doi:10.5194/amtd-8-9565-2015
© Author(s) 2015. CC Attribution 3.0 License.
This discussion paper is/has been under review for the journal Atmospheric Measurement Techniques (AMT). Please refer to the corresponding final paper in AMT if available.
GOCI Yonsei Aerosol Retrieval (YAER)
algorithm and validation during
DRAGON-NE Asia 2012 campaign
M. Choi1, J. Kim1, J. Lee2,3, M. Kim1, Y. Je Park4, U. Jeong1, W. Kim1, B. Holben3,
T. F. Eck3,5, J. H. Lim6, and C. K. Song6
1
Department of Atmospheric Sciences, Yonsei University, Seoul, South Korea
2
Earth System Science Interdisciplinary Center, University of Maryland, College Park, MD, USA
3
NASA Goddard Space Flight Center, Greenbelt, MD, USA
4
Korea Ocean Satellite Center, Korea Institute of Ocean Science and Technology, Ansan, South Korea
5
Universities Space Research Association, Columbia, MD, USA
6
National Institute of Environmental Research (NIER), Inchon, South Korea
Received: 22 July 2015 – Accepted: 5 August 2015 – Published: 15 September 2015
Correspondence to: J. Kim ([email protected])
AMTD
8, 9565–9609, 2015GOCI Yonsei Aerosol Retrieval (YAER)
algorithm and validation
M. Choi et al.
Title Page
Abstract Introduction
Conclusions References
Tables Figures
◭ ◮
◭ ◮
Back Close
Full Screen / Esc
Printer-friendly Version Interactive Discussion
Discussion
P
a
per
|
Discussion
P
a
per
|
Discussion
P
a
per
|
Discussion
P
a
per
|
Abstract
The Geostationary Ocean Color Imager (GOCI) onboard the Communication, Ocean, and Meteorology Satellites (COMS) is the first multi-channel ocean color imager in geostationary orbit. Hourly GOCI top-of-atmosphere radiance has been available for the retrieval of aerosol optical properties over East Asia since March 2011. This study
5
presents improvements to the GOCI Yonsei Aerosol Retrieval (YAER) algorithm over ocean and land together with validation results during the DRAGON-NE Asia 2012 campaign. Optical properties of aerosol are retrieved from the GOCI YAER algorithm including aerosol optical depth (AOD) at 550 nm, fine-mode fraction (FMF) at 550 nm, single scattering albedo (SSA) at 440 nm, Angstrom exponent (AE) between 440 and
10
860 nm, and aerosol type from selected aerosol models in calculating AOD. Assumed aerosol models are compiled from global Aerosol Robotic Networks (AERONET) inver-sion data, and categorized according to AOD, FMF, and SSA. Nonsphericity is consid-ered, and unified aerosol models are used over land and ocean. Different assumptions for surface reflectance are applied over ocean and land. Surface reflectance over the
15
ocean varies with geometry and wind speed, while surface reflectance over land is ob-tained from the 1–3 % darkest pixels in a 6 km×6 km area during 30 days. In the East China Sea and Yellow Sea, significant area is covered persistently by turbid waters, for which the land algorithm is used for aerosol retrieval. To detect turbid water pix-els, TOA reflectance difference at 660 nm is used. GOCI YAER products are validated
20
using other aerosol products from AERONET and the MODIS Collection 6 aerosol data from “Dark Target (DT)” and “Deep Blue (DB)” algorithms during the DRAGON-NE Asia 2012 campaign from March to May 2012. Comparison of AOD from GOCI and AERONET gives a Pearson correlation coefficient of 0.885 and a linear regression
equation with GOCI AOD=1.086×AERONET AOD – 0.041. GOCI and MODIS AODs
25
AMTD
8, 9565–9609, 2015GOCI Yonsei Aerosol Retrieval (YAER)
algorithm and validation
M. Choi et al.
Title Page
Abstract Introduction
Conclusions References
Tables Figures
◭ ◮
◭ ◮
Back Close
Full Screen / Esc
Printer-friendly Version Interactive Discussion
Discussion
P
a
per
|
Discussion
P
a
per
|
Discussion
P
a
per
|
Discussion
P
a
per
|
surface reflectance assumptions. Other GOCI YAER products show lower correlation with AERONET than AOD, but are still qualitatively useful.
1 Introduction
Aerosols have an important role in the Earth’s climate system, influencing climate di-rectly through scattering and absorbing radiation, and indidi-rectly by acting as cloud
con-5
densation nuclei (IPCC, 2013). Both ground-based and satellite measurements show an increasing trend of aerosol optical depth (AOD) over East Asia (IPCC, 2013; Hsu et al., 2012; Yoon et al., 2014). In particular, the increasing AOD trend over Asia is strongest during the dry seasons from December to May. Furthermore, aerosol types over East Asia are more complex than over other regions (J. Kim et al., 2007; Lee
10
et al., 2010a). To quantify its impact on climate, accurate observation of aerosol over East Asia is required.
Aerosol can be detected by remote sensing from ground-based and satellite mea-surement. AERONET (Aerosol Robotic Networks) is the representative global network of ground-based sun photometer observations, with an absolute observation
uncer-15
tainty for a single AOD measurement of 0.01 (Holben et al., 1998; Eck et al., 1999). Satellite observations from low earth orbit (LEO) and geostationary earth orbit (GEO) allow detection of aerosol over a wider area. Many aerosol retrieval algorithms have been developed and improved using multi-channel sensors in LEO such as the Moder-ate Resolution Imaging Spectroradiometer (MODIS), Sea-Viewing Wide Field-of-View
20
Sensor (SeaWiFS), Medium Resolution Imaging Spectrometer (MERIS), Ozone Mon-itoring Instrument (OMI), and Visible Infrared Imaging Radiometer Suite (VIIRS) (Hig-urashi and Nakajima, 1999; J. Kim et al., 2007; Hsu et al., 2006, 2013; Jackson et al., 2013; Kaufman et al., 1997a; Levy et al., 2007, 2013; Remer et al., 2005; Sayer et al., 2012; Torres et al., 1998, 2007, 2012; von Hoyningen-Huene et al., 2011).
Multi-25
AMTD
8, 9565–9609, 2015GOCI Yonsei Aerosol Retrieval (YAER)
algorithm and validation
M. Choi et al.
Title Page
Abstract Introduction
Conclusions References
Tables Figures
◭ ◮
◭ ◮
Back Close
Full Screen / Esc
Printer-friendly Version Interactive Discussion
Discussion
P
a
per
|
Discussion
P
a
per
|
Discussion
P
a
per
|
Discussion
P
a
per
|
AOD from MODIS is reported as 0.03+5 % over ocean and 0.05+15 % over land (Re-mer et al., 2008; Levy et al., 2010). Aerosol retrieval algorithms have been developed using data from GEO meteorological satellite series such as the Geostationary Opera-tional Environmental Satellite (GOES), Geostationary Meteorological Satellite (GMS), and Multifunction Transport Satellite (MTSAT) (Kim et al., 2008; Knapp et al., 2002;
5
Wang et al., 2003; Yoon et al., 2007; Urm and Sohn, 2005). These satellites provided high temporal resolution observation with several observations per day, but had disad-vantages with the coarser spatial resolution due to the higher orbit altitude than LEO and lower accuracy due to a wider spectral response function and single visible chan-nel. The magnitude of the uncertainty of retrieved AOD using GOES has been reported
10
as 0.13 (Knapp et al., 2005). Despite the extensive observations to date, the confidence level of satellite-based globally averaged AOD trends is still “low” (IPCC, 2013).
The Geostationary Ocean Color Imager (GOCI) onboard the Communication, Ocean, and Meteorological Satellites (COMS) is the first multi-channel visible– and near infrared–wavelength sensor in GEO (Ahn et al., 2012; Choi et al., 2012; Kang
15
et al., 2006). The center wavelengths of the eight channels are 412, 443, 490, 555, 660, 680, 745 and 865 nm, similar to other ocean color sensors such as the Coastal Zone Color Scanner (CZCS), SeaWiFS, MERIS, and MODIS, but GOCI has higher spatial resolution of 500 m×500 m from GEO. It observes East Asia hourly during the
daytime, a total of eight times per day. A prototype of the GOCI Yonsei AErosol
Re-20
trieval (YAER) algorithm was developed (Lee et al., 2010b) and is improved in this study to include dynamic and non-spherical aerosol models as in (Lee et al., 2012). Aerosol optical properties (AOPs) such as aerosol optical depth, size information, and absorptivity can be retrieved hourly from the GOCI YAER algorithm with spatial reso-lution of 6 km×6 km. The availability of hourly AOPs, not only AOD, for East Asia from
25
AMTD
8, 9565–9609, 2015GOCI Yonsei Aerosol Retrieval (YAER)
algorithm and validation
M. Choi et al.
Title Page
Abstract Introduction
Conclusions References
Tables Figures
◭ ◮
◭ ◮
Back Close
Full Screen / Esc
Printer-friendly Version Interactive Discussion
Discussion
P
a
per
|
Discussion
P
a
per
|
Discussion
P
a
per
|
Discussion
P
a
per
|
The Distributed Regional Aerosol Gridded Observation Networks – North East Asia 2012 campaign (DRAGON-NE Asia 2012 campaign) took place in Korea and Japan from 1 March to 31 May to observe aerosol and its variability using a dense mesoscale network of ground-based sun photometers. The campaign provides a dataset for vali-dation of aerosol retrieval algorithms.
5
This study introduces the improvement of the GOCI YAER algorithm and valida-tion results during the DRAGON-NE Asia 2012 campaign. Because MODIS data were used for the prototype algorithm before the launch of GOCI, this study is the first to use real GOCI data. The GOCI YAER products are validated with AERONET data from 38 sites during the DRAGON-NE Asia 2012 campaign. Inter-comparison of AOPs
be-10
tween GOCI and MODIS Collection 6 (C6) is also performed for the same period. This study uses data from the campaign to thoroughly validate the improved GOCI YAER algorithm.
In Sect. 2, the improvements of the GOCI YAER algorithm are summarized. In Sect. 3, some aerosol event cases are analyzed using products from the improved
15
algorithm. In Sect. 4, retrieved GOCI YAER products are validated with AERONET and MODIS. In Sect. 5, an error analysis of GOCI YAER AOD against AERONET AOD is presented. Section 6 provides a summary and conclusions.
2 Improvements of the GOCI YAER algorithm
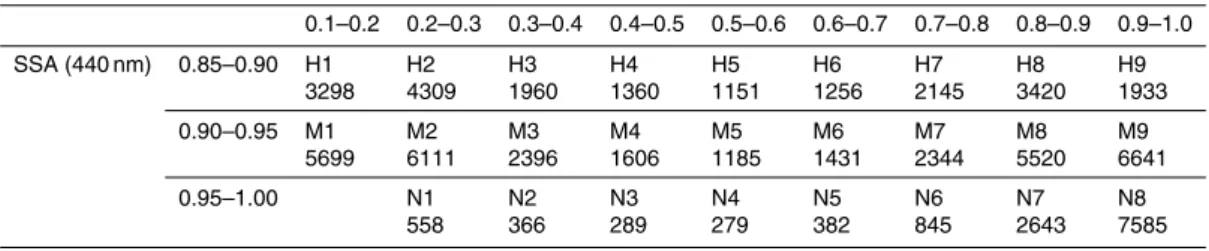
Figure 1 shows the flowchart for the GOCI YAER algorithm. The improvements will be
20
described according to the sequence shown in the flowchart.
Since the distribution of GOCI Level 1B (L1B) radiance data in March 2011, the GOCI YAER algorithm has been updated. The flowchart describes the contents of the overall algorithm step by step. Starting with the GOCI L1B radiance, the top-of-atmosphere reflectance (ρTOA) is calculated,
25
ρTOA(λ)=
π·L(λ)
µ0·E0(λ)
AMTD
8, 9565–9609, 2015GOCI Yonsei Aerosol Retrieval (YAER)
algorithm and validation
M. Choi et al.
Title Page
Abstract Introduction
Conclusions References
Tables Figures
◭ ◮
◭ ◮
Back Close
Full Screen / Esc
Printer-friendly Version Interactive Discussion
Discussion
P
a
per
|
Discussion
P
a
per
|
Discussion
P
a
per
|
Discussion
P
a
per
|
whereλis the wavelength of each GOCI channel (412, 443, 490, 555, 660, 680, 745, 865 nm), L(λ) is observed radiance from GOCI, µ0 is the cosine of the solar zenith
angle (θ0), andE0is the extraterrestrial solar flux.
2.1 Cloud masking and quality assurance
The three cloud masking tests are the absolute reflectance test, uniformity test, and
5
dust callback test, and consist of
1. ρTOA(490 nm)>0.40→cloud over land or ocean
2. Standard deviation of 3×3 pixelsρTOA(412 nm)>0.0025→cloud over land
Standard deviation of 3×3 pixelsρTOA(865 nm)>0.0025→cloud over ocean
3. ρTOA(412 nm)/ρTOA(660 nm)>0.75→Dust over ocean (not masked) 10
Note that ocean pixels with glint angle less than 40◦ are also masked out. After cloud masking, 12×12 pixel area, with each pixel of resolution 500 m×500 m are composited to give aerosol retrieval resolution of 6 km×6 km. In this step, only pixels with values of
ρTOA(490 nm) within the central 20–60 % of the range for the 144 pixels are averaged
for aerosol retrieval resolution. The darkest 20 % and the brightest 40 % of pixels are
15
discarded to remove remaining cloud, cloud shadow, and surface contamination and retain the dark pixels that are suitable for aerosol retrieval (Remer et al., 2005; Levy et al., 2007). The number of pixels used for aerosol retrieval resolution and the retrieved AOD at 550 nm determine the quality assurance (QA) measure for each pixel, as listed in Table 1. The GOCI YAER algorithm allows a retrieved AOD range from−0.1 to 5.0,
20
but QA is only greater than 1 when the value is in the range between−0.05 and 3.6.
2.2 Surface reflectance over land and ocean
The lack of a 2.1 µm channel in GOCI limits the capability to estimate surface re-flectance in the visible from the 2.1 µm TOA rere-flectance as in the MODIS DT algo-rithm (Levy et al., 2007; Kaufman et al., 1997b). Instead, the GOCI YAER algoalgo-rithm
AMTD
8, 9565–9609, 2015GOCI Yonsei Aerosol Retrieval (YAER)
algorithm and validation
M. Choi et al.
Title Page
Abstract Introduction
Conclusions References
Tables Figures
◭ ◮
◭ ◮
Back Close
Full Screen / Esc
Printer-friendly Version Interactive Discussion
Discussion
P
a
per
|
Discussion
P
a
per
|
Discussion
P
a
per
|
Discussion
P
a
per
|
uses the minimum reflectivity technique to determine the surface reflectance (ρSFC)
over land and turbid water (Herman and Celarier, 1997; Hsu et al., 2004; Koelemeijer et al., 2003). First, each scene’s TOA reflectance is corrected to the Rayleigh-corrected reflectance (RCR) (Hsu et al., 2013). It is assumed that in a 30 day period, changes in surface reflectance are insignificant and there is at least one clear day (Lee et al.,
5
2010b). To increase the number of samples to find clear pixels, it is also assumed that surface reflectance is homogeneous over in 12×12 pixels. Thus, the spatial resolution
of surface reflectance is the same as the aerosol retrieval resolution of 6 km×6 km. To allow for changes of surface reflectance with sun–satellite geometry, RCRs at a given hour during the day are composited for each month. The maximum number of samples
10
available to determine surface reflectance at a pixel is 144 pixels×30 days, a total of
4320 samples. Samples are sorted in ascending order according to RCR at 412 nm and selected from the darkest 1–3 %. At 412 nm, the variability of surface reflectance is lower and atmospheric signals such as Rayleigh scattering or aerosol reflectance are higher than at longer wavelengths. Thus, the RCR at 412 nm is used to find clear
15
pixels during the 30 day window. Threshold of 1 % for lower bound is to avoid cloud shadow. The threshold of 3 % for the upper bound comes from the ratio of the first minimum during 30 days. The RCRs of selected pixels are averaged for each chan-nel, giving a surface reflectance corresponding to the middle of each month (day 15). Finally, linear interpolation according to retrieval date is applied.
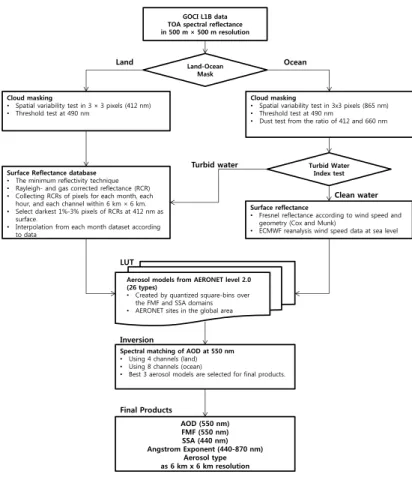
20
Figure 2 shows examples of surface reflectance at 443 and 660 nm; the difference between ocean and land is less at 443 nm, but noticeable at 660 nm. Turbid water areas with high reflectance at 660 nm are found near the coast of China in the Bohai Sea and in the northern East China Sea; this clearly shows a semi-permanent presence of turbid water pixels during the 30 days. From March to May, surface reflectances decrease over
25
land because of melting snow and increasing vegetation. The land algorithm is applied to pixels where surface reflectances at 443, 490, 555, and 660 nm are less than 0.3.
AMTD
8, 9565–9609, 2015GOCI Yonsei Aerosol Retrieval (YAER)
algorithm and validation
M. Choi et al.
Title Page
Abstract Introduction
Conclusions References
Tables Figures
◭ ◮
◭ ◮
Back Close
Full Screen / Esc
Printer-friendly Version Interactive Discussion
Discussion
P
a
per
|
Discussion
P
a
per
|
Discussion
P
a
per
|
Discussion
P
a
per
|
of in the Look-up Table (LUT) calculation using a radiative transfer model. The nodal points of wind speed in the LUT calculation are 1, 3, 5, 7, 9, and 20 m s−1. Using ECMWF wind speed data with 0.25◦×0.25◦ spatial resolution at every 6 h, the LUT is interpolated to each pixel’s wind speed to calculate AOD over the ocean. Note that ocean retrieval is performed only when the sun glint angle is greater than 40◦ (Remer
5
et al., 2005).
2.3 Turbid water detection
Aerosol retrieval over turbid water is a difficult problem for the GOCI YAER algorithm. Half of ocean in the GOCI field-of-regard (FOR) is the Yellow Sea with very high year-round turbidity. If the wind-speed dependent ocean surface reflectance is applied over
10
turbid water, the surface reflectance can be underestimated, and thus AOD can be overestimated. The previous GOCI YAER algorithm (Lee et al., 2010b) used the sur-face reflectance ratio (SRR) for turbid water detection, which is the ratio of sursur-face re-flectance at 640 and 860 nm. If turbid water pixels are detected, the surface rere-flectance from the second minimum RCR during the previous 30 day period is used for AOD
re-15
trieval. Persistent–turbid areas during the previous 30 days can be detected in this way, but it is hard to detect rapid temporal variations of turbidity. In this study, real-time turbid water detection is applied.
According to Li et al. (2003), ρTOA at 550, 660, and 865 nm showed higher
val-ues over turbid water than over clear water. They used the difference between ρTOA 20
at 550 nm and the value interpolated to 550 nm from ρTOA at 470, 1240, 1640, and
2130 nm using a linear fit on a log–log scale. In this study, because GOCI does not have IR channels,∆ρ660is defined as the difference in reflectance at 660 nm between
the observedρTOAat 660 nm and linearly interpolated betweenρTOAat 412 and 865–
660 nm. Increased ρTOA due to turbid water is stronger at 660 nm than at 412 and 25
865 nm so that∆ρ660shows a higher value over turbid water than over clear water.
To determine the threshold of∆ρ660for distinguishing turbid and clear water over the
AMTD
8, 9565–9609, 2015GOCI Yonsei Aerosol Retrieval (YAER)
algorithm and validation
M. Choi et al.
Title Page
Abstract Introduction
Conclusions References
Tables Figures
◭ ◮
◭ ◮
Back Close
Full Screen / Esc
Printer-friendly Version Interactive Discussion
Discussion
P
a
per
|
Discussion
P
a
per
|
Discussion
P
a
per
|
Discussion
P
a
per
|
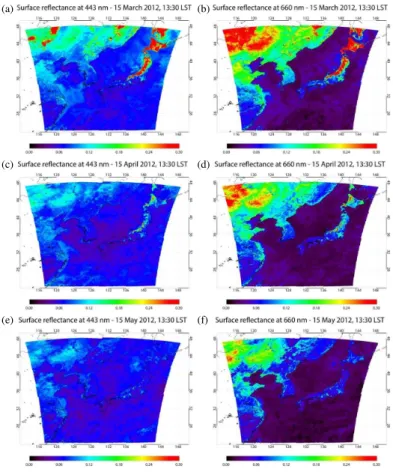
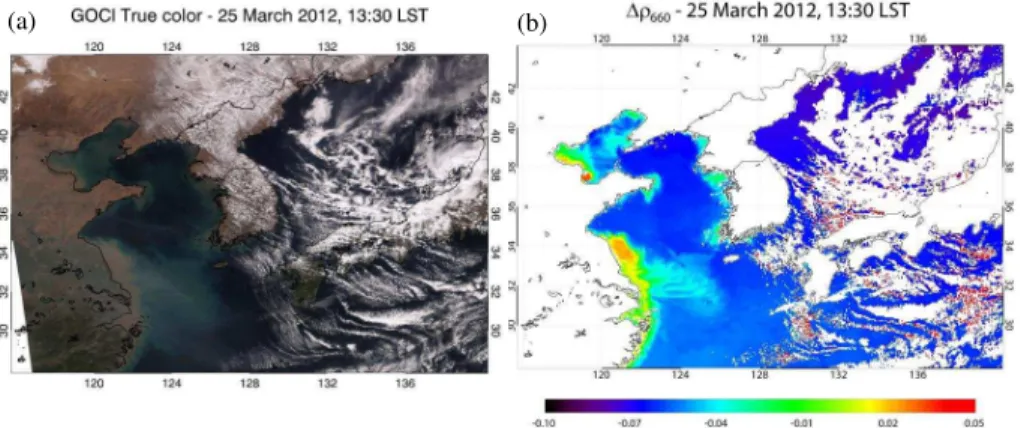
to February 2014 are analyzed. The analysis is implemented over two distinct areas: the Yellow Sea (115–126◦E, 30–40◦N) and an area of clear water (130–140◦E, 25– 30◦N), as in Lee et al. (2010b). A strict threshold for defining pixels as clear water is necessary to prevent misdetection of less turbid water as aerosol. Figure 3 shows the cumulative normal distribution of∆ρ660, where ratios below−0.05 are 99.0 and 67.4 %
5
for clear water and Yellow Sea pixels, respectively. Finally, pixels with ∆ρ660 below
−0.05 are not considered as turbid water so that the ocean algorithm is applied. On the contrary, pixels where∆ρ660is above−0.05 are considered as turbid water so that
the land algorithm is applied. Note that the surface reflectance of turbid water pixels is adjusted to the minimum turbidity during the 30 days so that surface reflectance can
10
be underestimated when severely turbid water occurs within the 30 days. Values of the ratio below 0.02 comprise 99.6 % of the Yellow Sea pixels. Therefore, pixels where
∆ρ660 is above 0.02 are considered as severely turbid water, and excluded from the
retrieval procedure.
To confirm whether∆ρ660effectively detects turbid water, two turbid water cases are 15
selected in Fig. 4. One is a clean atmosphere case (26 April 2012), and another case involves dust over the northern part of the Yellow Sea (27 April 2012). To compare the sensitivity between pixels over turbid water and those with absorbing aerosol, the Deep blue Aerosol Index (DAI) is calculated using GOCI TOA reflectance at 412 and 443 nm (Hsu et al., 2004, 2006; Ciren and Kondragunta, 2014). Note that DAI and
20
∆ρ660are plotted over no-cloud pixels. Only positive DAI pixels are presented to check
for the existence of absorbing aerosol such as dust. The true color image for the clean case shows severe turbidity in the ocean along the coast lines of eastern China and the western Korean peninsula. The next day, there is heavy Asian dust over northern Yellow Sea, and turbid water is in the same position as the day before.∆ρ660shows a higher 25
signal over turbid water (∼0.02) than Asian dust (∼ −0.01), while DAI shows a higher signal over Asian dust (∼4.8) than turbid water (∼1.6). Although heavy aerosol plumes
AMTD
8, 9565–9609, 2015GOCI Yonsei Aerosol Retrieval (YAER)
algorithm and validation
M. Choi et al.
Title Page
Abstract Introduction
Conclusions References
Tables Figures
◭ ◮
◭ ◮
Back Close
Full Screen / Esc
Printer-friendly Version Interactive Discussion
Discussion
P
a
per
|
Discussion
P
a
per
|
Discussion
P
a
per
|
Discussion
P
a
per
|
not cause problems because the land algorithm is applied, and the area is not masked out.
An additional role of∆ρ660is to detect the remaining cloud-contaminated pixels after
cloud masking. There are inhomogeneous cloud pixels over the right half of the scene in Fig. 5. Most cloud pixels are effectively screened by the cloud-masking steps, but
5
thin cloud pixels remain and show high∆ρ660 above 0.05 (red color). This is a similar
to the “Visible Reflectance Anomaly” of the VIIRS aerosol algorithm (Jackson et al., 2013). Because pixels with ∆ρ660 above 0.02 are considered as severe turbid water
and screened, the remaining cloud pixels are also masked using this test.
2.4 Aerosol models
10
Assumed aerosol models play an important role in aerosol retrieval. To reflect global climatological properties, AERONET inversion data (Dubovik and King, 2000) are used for aerosol models. A classification method for AERONET inversion data using Fine-mode fraction (FMF) at 550 nm and Single scattering albedo (SSA) at 440 nm is adopted (J. Kim et al., 2007; Lee et al., 2010a, 2012), but there are some differences
15
for the GOCI YAER algorithm.
Composited AERONET data are only used for the period up to February 2011, which is before GOCI’s first observation, to avoid overlap between the period of climatology and retrieval. Global sites are selected where the number of individual AERONET re-trieval data is greater than 10 times giving a total of 747 sites. From those sites, the
20
number of data that have all the AOPs in all channels is 66 712. They are classified into 26 aerosol models according to FMF at 550 nm and SSA at 440 nm (Table 2). Note that AOPs change as AOD increases because of the hygroscopic growth effect or aggrega-tion (Reid et al., 1998; Eck et al., 2003). Therefore, each aerosol model is separated again into low, moderate, and high AOD groups corresponding to the AOD ranges of
25
AMTD
8, 9565–9609, 2015GOCI Yonsei Aerosol Retrieval (YAER)
algorithm and validation
M. Choi et al.
Title Page
Abstract Introduction
Conclusions References
Tables Figures
◭ ◮
◭ ◮
Back Close
Full Screen / Esc
Printer-friendly Version Interactive Discussion
Discussion
P
a
per
|
Discussion
P
a
per
|
Discussion
P
a
per
|
Discussion
P
a
per
|
The AERONET inversion algorithm considers aerosol nonsphericity using a mixture of polydisperse, randomly-oriented homogeneous spheroids (Mishchenko et al., 1997; Dubovik et al., 2006). Phase functions of the inversion data applying nonsphericity are adopted directly into aerosol models.
2.5 LUT calculation and inversion procedure
5
Table 3 shows the LUT dimensions for calculation using libRadtran, a radiative transfer model (RTM) (Mayer and Kylling, 2005). The input options of this RTM to calculate
ρTOA for different aerosol conditions include the spectral phase function and SSA so
that the values of each model from AERONET inversion data can be used directly. Note that the input spectral AODs for LUT calculation are normalized to 550 nm using the
10
climatology of each model’s Angstrom exponent (AE) between 440 and 870 nm. In the inversion step, AOD is calculated from the comparison between observed and calculated reflectance according to the assumed aerosol model. The retrieved AOD at each channel is converted to the value at 550 nm using the AE of each aerosol model. If the observed aerosol properties are exactly the same as those of one of the aerosol
15
models and there are no other errors, the AODs from the GOCI channels converted to 550 nm should have the same values. Only four channels (443, 555, 660, and 680 nm) are used over land when surface reflectances in these channels are less than 0.3. Otherwise, all eight channels are used over ocean because the ocean surface is darker than the land. To find optimized aerosol models, the standard deviation (stddev) of the
20
converted AODs at 550 nm from spectral values is calculated for each model. The three models with lowest stddev are then selected for the final AOD, FMF, SSA, and AE. Note that the final products are the stddev-weighted averages from the selected aerosol models. The GOCI YAER algorithm classifies a total of six aerosol types using the retrieved final FMF and SSA (Table 4).
AMTD
8, 9565–9609, 2015GOCI Yonsei Aerosol Retrieval (YAER)
algorithm and validation
M. Choi et al.
Title Page
Abstract Introduction
Conclusions References
Tables Figures
◭ ◮
◭ ◮
Back Close
Full Screen / Esc
Printer-friendly Version Interactive Discussion
Discussion
P
a
per
|
Discussion
P
a
per
|
Discussion
P
a
per
|
Discussion
P
a
per
|
3 Case studies of GOCI YAER products during the DRAGON-NE Asia 2012
campaign
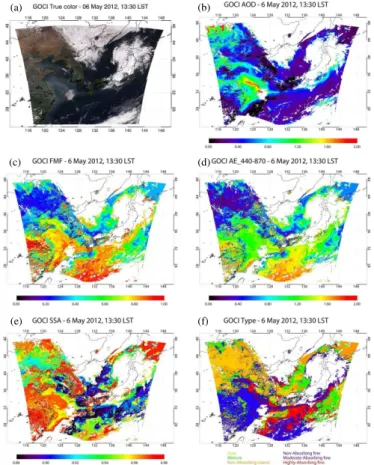
During the DRAGON-NE Asia 2012 campaign, there are several cases of high aerosol loading. Two representative cases are presented here; the heavy pollution haze case on 6 May, and the dust case on 27 April. On 6 May 2012, a white haze plume was
de-5
tected over northeastern China and the Yellow Sea from the true color image as shown in Fig. 6a. GOCI YAER AOD, FMF, AE, SSA, and aerosol type are plotted in Fig. 6b–f. Note that all pixels regardless of QA values are included in the AOD plot, while only pixels with positive AOD are shown for other products. High AOD ranging from 1.2 to 2.0 is found at the center of the haze plume, with retrieved FMF and AE of about
10
0.8 and 1.2, respectively. This means that the haze aerosol is a fine-mode dominated aerosol. The SSAs at those pixels are in the range 0.955–0.975, corresponding to non-absorbing aerosol. The detected aerosol type of the haze is therefore “Non-non-absorbing fine” aerosol, shown as blue in Fig. 6f.
The distribution of FMF, AE, and SSA over land is more inhomogeneous than over
15
ocean, particularly, for pixels with low AOD, which may be due to the spatial variation of land surface reflectance and its uncertainty. Nevertheless, it is encouraging that there is less discrepancy between ocean and land, with products showing a continuous distribution across the coastline for both high (∼1.0) and low AOD (∼0.3) pixels.
Another case is a severe dust case on 27 April 2012 as shown Fig. 7. Heavy yellow
20
dust plumes are evident in the GOCI true color image. These developed in the Gobi Desert the previous day were transported to the northern part of the Korean peninsula across the Yellow Sea. The dust plume has a horizontal scale about 1000 km from inland China to the Yellow Sea, with AOD at its center above 2.0 (red color), and about 1.2 at the edge of the plume. The dust plume over the northern part of the Korean
25
AMTD
8, 9565–9609, 2015GOCI Yonsei Aerosol Retrieval (YAER)
algorithm and validation
M. Choi et al.
Title Page
Abstract Introduction
Conclusions References
Tables Figures
◭ ◮
◭ ◮
Back Close
Full Screen / Esc
Printer-friendly Version Interactive Discussion
Discussion
P
a
per
|
Discussion
P
a
per
|
Discussion
P
a
per
|
Discussion
P
a
per
|
absorbing aerosol. From the FMF and SSA, the aerosol plume is classified as “Dust”, shown as yellow in Fig. 7f.
4 Evaluation of GOCI YAER products during the DRAGON-NE Asia 2012
campaign
Generally, in spring, various aerosol events such as Yellow dust or anthropogenic
5
aerosol occur frequently and intensively over East Asia (Redemann et al., 2003; Schmid et al., 2003; S. W. Kim et al., 2007). Although the campaign was limited to the spring, it has the advantage of abundant ground-based observations over Korea and Japan. During the campaign, a total of 40 sun photometers were deployed at ur-ban sites and coastline sites. Over the urur-ban areas of Seoul and Osaka, in particular,
10
distances between AERONET sites are about 10 km, which makes validation of satel-lite data possible at high spatial resolution.
MODIS onboard Aqua and Terra is a representative sensor for observing global aerosol, and its aerosol retrieval algorithms have been developed and improved con-tinuously (Remer et al., 2005; Levy et al., 2007; Hsu et al., 2006). Recently, an updated
15
new version was released as C6 (Levy et al., 2013; Hsu et al., 2013). MODIS aerosol products consist of dark target (DT) over both ocean and land and deep blue (DB) products over land-only. Their validation against AERONET showed good agreement globally (Levy et al., 2013; Sayer et al., 2013). Because the validation of GOCI us-ing AERONET is limited in spatial coverage, inter-comparison usus-ing the satellite-based
20
MODIS dataset is valuable for GOCI YAER evaluation over East Asia.
AMTD
8, 9565–9609, 2015GOCI Yonsei Aerosol Retrieval (YAER)
algorithm and validation
M. Choi et al.
Title Page
Abstract Introduction
Conclusions References
Tables Figures
◭ ◮
◭ ◮
Back Close
Full Screen / Esc
Printer-friendly Version Interactive Discussion
Discussion
P
a
per
|
Discussion
P
a
per
|
Discussion
P
a
per
|
Discussion
P
a
per
|
4.1 Validation conditions between ground-based AERONET and
satellite-based GOCI and MODIS
For the validation, 38 of the campaign sites are selected, each at least 20 observed days. The current Level 2.0 version 2 direct-sun all points observation products, inver-sion products, and the spectral de-convolution algorithm (SDA) products are used in
5
this study (Holben et al., 1998; O’Neill et al., 2003; Dubovik and King, 2000). From the direct sun measurement, AOD and Angstrom exponent are used. The validation for FMF is done using both inversion and SDA products, while the validation for SSA is done using inversion products. Note that the almucantar observation is only possible when the solar zenith angle is greater than 50◦(Dubovik et al., 2000), so inversion data
10
are unavailable near noon.
Aerosol data from GOCI and AERONET are collocated temporally and spatially for the comparison. The ground-based AERONET observes the sun/sky radiance at in-tervals of a few minutes at a fixed site, while GOCI observes aerosol over East Asia at hourly intervals. GOCI pixels within 25 km of an AERONET site are averaged, and
15
AERONET data within 30 min from GOCI observation time are averaged. Colocation is carried out when at least one pixel of GOCI and one temporal value of AERONET exist. Note that AERONET does not observe AOD at 550 nm directly so that it is inter-polated from other channels using a quadratic fit on a log-log scale (Eck et al., 1999). The colocation condition between AERONET and MODIS is the same as for GOCI.
20
Note that validation of MODIS using AERONET is performed for AOD only.
4.2 Inter-comparison condition between MODIS and GOCI
The different characteristics of MODIS and GOCI as LEO and GEO sensors, respec-tively, need to be considered when inter-comparison is performed. Spatial colocation is based on the fixed grid scale in the GOCI FOR. The GOCI observation area is divided
25
into 0.2◦×0.2◦ latitude–longitude resolution grid cells. Therefore, MODIS and GOCI
AMTD
8, 9565–9609, 2015GOCI Yonsei Aerosol Retrieval (YAER)
algorithm and validation
M. Choi et al.
Title Page
Abstract Introduction
Conclusions References
Tables Figures
◭ ◮
◭ ◮
Back Close
Full Screen / Esc
Printer-friendly Version Interactive Discussion
Discussion
P
a
per
|
Discussion
P
a
per
|
Discussion
P
a
per
|
Discussion
P
a
per
|
Temporal colocation is based on the MODIS observation time. MODIS level 2 aerosol data are provided as granules, and the maximum difference in scan time in one granule is about 5 min. The maximum difference in GOCI scan time for one scene is about 30 min, and GOCI scans the FOR every hour. Therefore, two GOCI scenes within 1 h centered on the MODIS overpass time are interpolated to the MODIS time, and are
5
collocated with MODIS temporally.
4.3 Validation of AOD
The validation involves use of the linear regression equation, and validation metrics in-clude the Pearson’s linear correlation coefficient (R), root mean square error (RMSE), mean absolute error (MAE), mean bias error (MBE), and the ratio within expected error
10
(% within EE). Note that MBE and MAE are the mean of differences and absolute dif-ferences of value between AERONET and GOCI, respectively. The range of expected error (EE) of AOD is adopted from MODIS DT over land.
Figure 8 shows the spatially and temporally collocated AOD of
AERONET vs. GOCI and MODIS at the 38 DRAGON AERONET
15
sites. “MODIS_Corrected_Optical_Depth_Land” at 550 nm and
“MODIS_Deep_Blue_Aerosol_Optical_Depth_550_Land_Best_Estimate” from
MODIS/Aqua are used as the AOD of MODIS DT and DB, respectively. A total of 9602 data points are matched with GOCI for all QA values, and 8652 for only
QA=3 data. There is good agreement between AERONET and GOCI with high
20
data counts (red color) gathered near the one-to-one line. Because GOCI pixels with QA=3 are less cloud contaminated than those with all QA values, there are fewer overestimated pixels from the GOCI QA=3 set. Thus, all validation criteria show better results for QA=3 than for all QA except for the y intercept of the linear regression line. Most comparison points are concentrated within the EE and immediately below
25
EE in AERONET AOD<0.4, but widespread points above EE result in the increase of the y intercept for all QA. Such pixels seem to be contaminated by cloud so, in
AMTD
8, 9565–9609, 2015GOCI Yonsei Aerosol Retrieval (YAER)
algorithm and validation
M. Choi et al.
Title Page
Abstract Introduction
Conclusions References
Tables Figures
◭ ◮
◭ ◮
Back Close
Full Screen / Esc
Printer-friendly Version Interactive Discussion
Discussion
P
a
per
|
Discussion
P
a
per
|
Discussion
P
a
per
|
Discussion
P
a
per
|
with AERONET, they intercept has a more negative value of −0.041 than for all QA
(−0.001). The correlation coefficient for AOD between AERONET and GOCI (QA=3) is 0.885, which is higher than for MODIS DT (0.881) and DB (0.872). For RMSE, MAE, and % within EE, GOCI is better than MODIS DT. Munchak et al. (2013) described that MODIS DT Collection 6 AOD is biased high over urban surfaces.
5
Otherwise, the recent MODIS DB Collection 6 algorithm controls surface reflectance differently according to surface type, giving high accuracy regardless of surface type (Hsu et al., 2013). The ratio within EE of MODIS DB against AERONET is 69.7 % for all AERONET sites, which is greater than for GOCI (56.9 %).
Results of inter-comparison of AOD between GOCI and MODIS are shown in Fig. 9.
10
Note that ocean pixels near most coastal sites are classified as turbid water and re-trieved using the land algorithm. Thus, it is hard to validate the GOCI ocean algorithm using AERONET, but it is possible using MODIS DT ocean AOD. Inter-comparison of
the ocean AOD of MODIS DT and GOCI shows good agreement (R=0.912). The
slope of the regression line is 0.983 and they intercept is 0.056. Both algorithms
con-15
sider wind speed dependent surface reflectance. Because the ocean surface is darker than the land surface, it is easier to detect cloud pixels over ocean and so there are fewer overestimation points for GOCI.
The GOCI AOD over ocean is retrieved from the ocean algorithm over clear water and the land algorithm over turbid water (or heavy aerosol loading). The AOD over
tur-20
bid water pixels is not retrieved in the MODIS DT ocean algorithm, so direct comparison over turbid water is impossible (Lee et al., 2010b)
A common feature of comparisons of GOCI products using MODIS DT and DB over land is that there are more scattered points above the one-to-one line than in
comparisons between AERONET and GOCI. Because cloud is effectively cleared in
25
dis-AMTD
8, 9565–9609, 2015GOCI Yonsei Aerosol Retrieval (YAER)
algorithm and validation
M. Choi et al.
Title Page
Abstract Introduction
Conclusions References
Tables Figures
◭ ◮
◭ ◮
Back Close
Full Screen / Esc
Printer-friendly Version Interactive Discussion
Discussion
P
a
per
|
Discussion
P
a
per
|
Discussion
P
a
per
|
Discussion
P
a
per
|
tinguish the cloud signal clearly over land using only visible characteristics because of bright surface reflectance, especially for urban surfaces. If cloud is not removed cor-rectly, its signal is considered as aerosol, and AOD is overestimated. This explains the greater number of pixels scattered above the one-to-one line in both comparisons over land. GOCI YAER AOD over land is better correlated with MODIS DB (R=0.856) than
5
DT (R=0.794), and the linear regression line over land between GOCI and MODIS DB is also closer to the one-to-one line than with MODIS DT. In MODIS DT, visible-wavelength surface reflectances over land are retrieved from TOA reflectances of IR channels (2.1 µm), while the minimum reflectance method is used for the surface re-flectance database in MODIS DB. That method is also applied for determining surface
10
reflectance for GOCI YAER; hence the tendency and accuracy of retrieved AOD from GOCI are closer to MODIS DB than DT.
4.4 Validation of Angstrom exponent, fine-mode fraction, and single scattering
albedo
The GOCI YAER AE, FMF, and SSA are determined from the climatological values of
15
the three selected aerosol models in the inversion procedure to calculate AOD. There-fore, the possible product retrieval ranges are limited by the aerosol models. AE, FMF, and SSA can be retrieved in the ranges of 0.0930–1.744, 0.156–0.956, and 0.871– 0.970, respectively.
Figure 10a and b shows the comparison of AE between AERONET and GOCI. The
20
correlation coefficient is 0.566 in Fig. 10a, which is significantly lower than for the AOD comparison (0.885). The difference in spectral aerosol signal does not vary much with aerosol model when AOD is low, so the error of AE can be large at low AOD. When AOD is less than 0.3, the value of AE are about 1.3 for AERONET, but about 0.7 for the GOCI retrieval; thus when these points are removed, the correlation coefficient increases to
25
0.664 in Fig. 10b. AE is underestimated from GOCI compared with AERONET (MBE=
−0.255) for the whole range although highest density of points from AERONET and
AMTD
8, 9565–9609, 2015GOCI Yonsei Aerosol Retrieval (YAER)
algorithm and validation
M. Choi et al.
Title Page
Abstract Introduction
Conclusions References
Tables Figures
◭ ◮
◭ ◮
Back Close
Full Screen / Esc
Printer-friendly Version Interactive Discussion
Discussion
P
a
per
|
Discussion
P
a
per
|
Discussion
P
a
per
|
Discussion
P
a
per
|
Although the MODIS DT AE over land can be calculated using spectral AOD at 470 and 660 nm, inter-comparison of the AE between MODIS DT and GOCI is not done over land in this study. Levy et al. (2010) reported that AE is not available globally at sufficient quantitative accuracy so that it was removed from the main products of the Collection 6 DT algorithm (Levy et al., 2013). Therefore, comparison is only performed
5
over the ocean. The MODIS DT AOD over the ocean is retrieved at 550 and 860 nm, so the AE between these two channels is compared with the GOCI AE in Fig. 10c. Over the ocean both GOCI and MODIS DT assume Fresnel reflectance with wind speed dependence for the surface reflectance, and the surface reflectances is similar between GOCI and MODIS DT over, and the surface reflectance of ocean is lower than that of
10
land. Therefore, high counts are well matched and the RMSE and MBE (0.386 and 0.021, respectively) are better than those of AERONET vs. GOCI (0.400 and−0.255, respectively) although the correlation coefficient is much lower at 0.386.
FMF is provided directly from SDA AERONET, or calculated using the almucantar retrievals of fine AOD and the total AOD at 675 nm from AERONET inversions. Both
15
AERONET FMF products are compared with the GOCI YAER FMF in Fig. 11a and b. Note that both comparisons are for AERONET AOD>0.3. The correlation coeffi -cients are 0.685 and 0.748 for SDA and inversion AERONET, respectively. These are higher values than for AE validation, but less than for AOD validation. High counts of AERONET are grouped around 0.9–1.0, but those of GOCI are grouped at 0.8. GOCI
20
FMF is underestimated compared with AERONET for the whole FMF range. The MBE values are−0.180 and−0.168, respectively.
The inter-comparison of FMF between MODIS DT and GOCI over the ocean is shown in Fig. 11c. The correlation is better (R=0.418 and RMSE=0.184) than for of AE (R=0.332 and RMSE=0.386). The validation results for FMF are analogous
25
to those of AE because both parameters are sensitive to the particle size in visible wavelengths.
AMTD
8, 9565–9609, 2015GOCI Yonsei Aerosol Retrieval (YAER)
algorithm and validation
M. Choi et al.
Title Page
Abstract Introduction
Conclusions References
Tables Figures
◭ ◮
◭ ◮
Back Close
Full Screen / Esc
Printer-friendly Version Interactive Discussion
Discussion
P
a
per
|
Discussion
P
a
per
|
Discussion
P
a
per
|
Discussion
P
a
per
|
AERONET SSA is only provided for AOD>0.4 and almucantar observation is per-formed when the solar zenith angle is greater than 50◦(Dubovik and King, 2000).
The correlation coefficient is 0.368, which is the lowest among the GOCI products. Nevertheless, the accuracy of GOCI SSA is comparable with that of OMI SSA over East Asia. According to Jethva et al. (2014), the correlation coefficient between AERONET
5
and OMI SSA is 0.406. They also showed that 44.91 and 70.29 % of OMI SSA data are within differences of ±0.03 and ±0.05 with respect to AERONET. GOCI SSA shows
higher ratios than OMI, 71.0 and 86.3 %, for the same criteria over North East Asia. A preliminary redundancy test (Lee et al., 2012), which showed that GOCI SSA may be underestimated at high SSA (∼0.95) and overestimated at low SSA (∼0.85), is
10
consistent with the results of GOCI SSA validation against AERONET. The difference between absorbing and non-absorbing aerosols is significant in the UV and shorter visible (blue) wavelengths, and weak at longer visible (green and red) wavelengths. GOCI YAER algorithm is optimized for AOD retrieval using aerosol model composition classified by FMF and SSA. In the next generation GOCI-2 mission to be launched in
15
2019, SSA can be retrieved more accurately utilizing UV channel.
In conclusion, GOCI AE, FMF, and SSA show lower accuracy than AOD. Neverthe-less, these values can be useful for qualitative studies, although not for quantitative studies.
5 Error analysis of GOCI YAER AOD
20
Uncertainties in surface reflectance, assumed aerosol model, cloud masking, and ge-ometry result in systematic errors of retrieved AOD. In this section, the difference in AOD between GOCI and AERONET is analyzed to quantify the respective error sources affecting the accuracy of GOCI AOD.
The difference in AOD between GOCI and AERONET is shown in Fig. 13a as a
func-25
AMTD
8, 9565–9609, 2015GOCI Yonsei Aerosol Retrieval (YAER)
algorithm and validation
M. Choi et al.
Title Page
Abstract Introduction
Conclusions References
Tables Figures
◭ ◮
◭ ◮
Back Close
Full Screen / Esc
Printer-friendly Version Interactive Discussion
Discussion
P
a
per
|
Discussion
P
a
per
|
Discussion
P
a
per
|
Discussion
P
a
per
|
AERONET AOD<0.4, while there is no consistent bias but a skewed distribution to-ward the positive differences for AERONET AOD>0.9. The minimum reflectivity tech-nique can overestimate surface reflectance due to contamination by the remaining cloud or aerosol, resulting in negative bias at low AOD. On the other hand, the ac-curacy at high AOD can be affected by the assumed aerosol model or cloud masking.
5
An insignificant bias of the median points supports the validity of the assumed aerosol model, but a positive skewed distribution can be attributed to the remaining cloud con-tamination due to cloud masking using visible channels only. It is difficult to distinguish aerosol and cirrus cloud without information from IR wavelengths (Lee et al., 2013).
The next comparison is the difference in AOD between GOCI and AERONET plotted
10
against scattering angle in Fig. 13b. There is a consistently negative bias over all scat-tering angles for low AOD (<0.3), where it is difficult to find noticeable scattering angle dependency. For high AOD (>0.3), GOCI AOD is underestimated at scattering angles near 115 and 140◦and overestimated at 145◦and above 160◦.
The method for determining surface reflectance is applied equally to all pixels
re-15
gardless of surface type. To test the accuracy as a function of surface type, the nor-malized difference vegetation index (NDVI) is adopted, defined as (ρTOA(865 nm)−
ρTOA(660 nm))/(ρTOA(865 nm)+ρTOA(660 nm)). Generally, it is negative over ocean and
positive over land. It is close to 1 when the surface is green because of vegetation growth, while it is close to zero over less green areas. Figure 13c shows the diff
er-20
ence in AOD between GOCI and AERONET plotted against NDVI. Note that negative NDVI is possible when GOCI ocean pixels are collocated with AERONET at coastal sites. The difference is small (0–0.05) and the bias is for low NDVI (−0.4 to 0.1).
How-ever, the difference decreases linearly from 0.05 to−0.2 as NDVI increases from 0.1 to 0.6, due to the limitation in minimum reflectivity technique with search window of one
25
AMTD
8, 9565–9609, 2015GOCI Yonsei Aerosol Retrieval (YAER)
algorithm and validation
M. Choi et al.
Title Page
Abstract Introduction
Conclusions References
Tables Figures
◭ ◮
◭ ◮
Back Close
Full Screen / Esc
Printer-friendly Version Interactive Discussion
Discussion
P
a
per
|
Discussion
P
a
per
|
Discussion
P
a
per
|
Discussion
P
a
per
|
due to the most densely vegetated surfaces in both Korea and Japan being forested mountains therefore some AOD may be below the elevated surface altitude as very few AERONET sites were located on mountains.
6 Conclusion
The prototype GOCI YAER algorithm over the ocean (Lee et al., 2010b) was further
5
developed with employing a non-spherical aerosol model to improve aerosol retrieval algorithm over the ocean using MODIS data (Lee et al., 2012). From this heritage, the GOCI YAER algorithm is extended to land and improved over the ocean and land. GOCI has the advantages of high spatial (500 m×500 m) and temporal (hourly) resolution using eight channels in visible wavelengths. Therefore, other properties such as FMF,
10
AE, and SSA as well as AOD can be retrieved from the GOCI YAER algorithm at 6 km×6 km resolution.
Different surface reflectance assumptions and channels are applied for the land and ocean. Turbid water is classified according to∆ρ660, and the land algorithm is applied
over turbid water. Nonsphericity and dynamical properties of aerosol are reflected in
15
the aerosol models.
The DRAGON-NE Asia 2012 campaign in spring has enabled the evaluation of GOCI YAER products over 38 sites in Korea and Japan using AERONET data and MODIS over East Asia. AOD from the GOCI YAER shows good agreement with AERONET with a correlation coefficient of 0.885, which is better than for MODIS DT (R=0.836) and
20
DB (R=0.872). The ratio within±(0.05+0.15×AERONET_AOD) of GOCI is 56.9 %, which is worse than MODIS DB (69.7 %) but better than MODIS DT (44.0 %). In the inter-comparison between GOCI and MODIS, GOCI and MODIS DT show good agree-ment over ocean with high correlation (R=0.912). Over land, GOCI YAER shows
bet-ter agreement and less bias with MODIS DB (R=0.856, RMSE=0.212) than MODIS
25
AMTD
8, 9565–9609, 2015GOCI Yonsei Aerosol Retrieval (YAER)
algorithm and validation
M. Choi et al.
Title Page
Abstract Introduction
Conclusions References
Tables Figures
◭ ◮
◭ ◮
Back Close
Full Screen / Esc
Printer-friendly Version Interactive Discussion
Discussion
P
a
per
|
Discussion
P
a
per
|
Discussion
P
a
per
|
Discussion
P
a
per
|
GOCI agrees less well with AEORNET (R=0.566–0.748) and tends to underestimate (MBE=−0.335 to−0.168). Over ocean, the comparison of size parameters between
GOCI and MODIS DT shows significantly poorer agreement (R=0.386–0.418), but
data points with high frequency are well matched. For the SSA, GOCI shows low cor-relation of 0.368 and 0.082 with AERONET and MODIS DB, respectively, but the range
5
of SSA (0.90–0.95) is well matched each other. In conclusion, GOCI YAER AOD shows high accuracy against MODIS, and other aerosol parameter products can be used qual-itatively although their accuracy is less than AOD.
From the error analysis, GOCI YAER AOD shows a negative bias of−0.1 for low AOD (<0.4), and the negative bias increases as NDVI becomes higher. It is necessary to
10
improve the accuracy of surface reflectance over vegetated areas for the next version, and possibly account for the elevation of forested mountains relative to the aerosol vertical profile.
The phase function of non-spherical properties from AERONET is included directly by using a scalar RTM, libRadtran; this RTM is less accurate for calculating Rayleigh
15
scattering for the short visible wavelengths (∼400 nm). A vector RTM might be helpful
in improving the accuracy of the GOCI YAER algorithm in the near future. The current validation period is limited to Spring 2012, and thus the seasonal dependence of accu-racy is not presented in this study. Nearly 4 years of GOCI data have been accumulated since March 2011, which will allow long-term validation and analysis to be carried out
20
to investigate retrieval accuracies and uncertainties in the near future.
Acknowledgements. We thank the Korean Institute of Ocean Science and Technology (KIOST)
for the development and application of GOCI in this research. We also thank all PI investigators
and their stafffor establishing and maintaining the AERONET sites of DRAGON-NE Asia 2012
campaign used in this investigation. We also thank the MODIS science team for providing 25
AMTD
8, 9565–9609, 2015GOCI Yonsei Aerosol Retrieval (YAER)
algorithm and validation
M. Choi et al.
Title Page
Abstract Introduction
Conclusions References
Tables Figures
◭ ◮
◭ ◮
Back Close
Full Screen / Esc
Printer-friendly Version Interactive Discussion
Discussion
P
a
per
|
Discussion
P
a
per
|
Discussion
P
a
per
|
Discussion
P
a
per
|
References
Ahn, J. H., Park, Y. J., Ryu, J. H., Lee, B., and Oh, I. S.: Development of atmospheric correction algorithm for Geostationary Ocean Color Imager (GOCI), Ocean Sci., 47, 247–259, 2012, http://www.ocean-sci.net/47/247/2012/.
Choi, J. K., Park, Y. J., Ahn, J. H., Lim, H. S., Eom, J., and Ryu, J. H.: GOCI, 5
the world’s first geostationary ocean color observation satellite, for the monitoring of temporal variability in coastal water turbidity, J. Geophys. Res.-Oceans, 117, C09004, doi:09010.01029/02012JC008046, 2012.
Ciren, P. and Kondragunta, S.: Dust aerosol index (DAI) algorithm for MODIS, J. Geophys. Res.-Atmos., 119, 4770–4792, 2014.
10
Cox, C. and Munk, W.: Statistics of the sea surface derived from sun glitter, J. Mar. Res., 13, 198–227, 1954.
Dubovik, O. and King, M. D.: A flexible inversion algorithm for retrieval of aerosol optical prop-erties from Sun and sky radiance measurements, J. Geophys. Res.-Atmos., 105, 20673– 20696, 2000.
15
Dubovik, O., Smirnov, A., Holben, B. N., King, M. D., Kaufman, Y. J., Eck, T. F., and Slutsker, I.: Accuracy assessments of aerosol optical properties retrieved from Aerosol Robotic Network (AERONET) Sun and sky radiance measurements, J. Geophys. Res.-Atmos., 105, 9791– 9806, 2000.
Dubovik, O., Sinyuk, A., Lapyonok, T., Holben, B. N., Mishchenko, M., Yang, P., Eck, T. F., 20
Volten, H., Munoz, O., Veihelmann, B., van der Zande, W. J., Leon, J. F., Sorokin, M., and Slutsker, I.: Application of spheroid models to account for aerosol particle non-sphericity in remote sensing of desert dust, J. Geophys. Res.-Atmos., 111, D11208, doi:10.1029/2005JD006619, 2006.
Eck, T. F., Holben, B. N., Reid, J. S., Dubovik, O., Smirnov, A., O’Neill, N. T., Slutsker, I., 25
and Kinne, S.: Wavelength dependence of the optical depth of biomass burning, urban, and desert dust aerosols, J. Geophys. Res.-Atmos., 104, 31333–31349, 1999.
Eck, T. F., Holben, B. N., Reid, J. S., O’Neill, N. T., Schafer, J. S., Dubovik, O., Smirnov, A., Yamasoe, M. A., and Artaxo, P.: High aerosol optical depth biomass burning events: a
com-parison of optical properties for different source regions, Geophys. Res. Lett., 30, 2035,
30
AMTD
8, 9565–9609, 2015GOCI Yonsei Aerosol Retrieval (YAER)
algorithm and validation
M. Choi et al.
Title Page
Abstract Introduction
Conclusions References
Tables Figures
◭ ◮
◭ ◮
Back Close
Full Screen / Esc
Printer-friendly Version Interactive Discussion
Discussion
P
a
per
|
Discussion
P
a
per
|
Discussion
P
a
per
|
Discussion
P
a
per
|
Herman, J. R. and Celarier, E. A.: Earth surface reflectivity climatology at 340–380 nm from TOMS data, J. Geophys. Res.-Atmos., 102, 28003–28011, 1997.
Higurashi, A. and Nakajima, T.: Development of a two-channel aerosol retrieval algorithm on a global scale using NOAA AVHRR, J. Atmos. Sci., 56, 924–941, 1999.
Holben, B. N., Eck, T. F., Slutsker, I., Tanre, D., Buis, J. P., Setzer, A., Vermote, E., Reagan, J. A., 5
Kaufman, Y. J., Nakajima, T., Lavenu, F., Jankowiak, I., and Smirnov, A.: AERONET – a fed-erated instrument network and data archive for aerosol characterization, Remote Sens. En-viron., 66, 1–16, 1998.
Hsu, N. C., Tsay, S. C., King, M. D., and Herman, J. R.: Aerosol properties over bright-reflecting source regions, IEEE T. Geosci. Remote, 42, 557–569, 2004.
10
Hsu, N. C., Tsay, S. C., King, M. D., and Herman, J. R.: Deep blue retrievals of Asian aerosol properties during ACE-Asia, IEEE T. Geosci. Remote, 44, 3180–3195, 2006.
Hsu, N. C., Gautam, R., Sayer, A. M., Bettenhausen, C., Li, C., Jeong, M. J., Tsay, S.-C., and Holben, B. N.: Global and regional trends of aerosol optical depth over land and ocean using SeaWiFS measurements from 1997 to 2010, Atmos. Chem. Phys., 12, 8037–8053, 15
doi:10.5194/acp-12-8037-2012, 2012.
Hsu, N. C., Jeong, M. J., Bettenhausen, C., Sayer, A. M., Hansell, R., Seftor, C. S., Huang, J., and Tsay, S. C.: Enhanced Deep Blue aerosol retrieval algorithm: the second generation, J. Geophys. Res.-Atmos., 118, 9296–9315, 2013.
IPCC: Climate Change 2013: The Physical Science Basis. Contribution of Working Group I to 20
the Fifth Assessment Report of the Intergovernmental Panel on Climate Change, Cambridge University Press, Cambridge, UK and New York, NY, USA, 2013.
Jackson, J. M., Liu, H. Q., Laszlo, I., Kondragunta, S., Remer, L. A., Huang, J. F., and Huang, H. C.: Suomi-NPP VIIRS aerosol algorithms and data products, J. Geophys. Res.-Atmos., 118, 12673–12689, 2013.
25
Jethva, H., Torres, O., and Ahn, C.: Global assessment of OMI aerosol single-scattering albedo using ground-based AERONET inversion, J. Geophys. Res.-Atmos., 119, 9020–9040, 2014. Kang, G., Youn, H. S., Choi, S. B., and Coste, P.: Radiometric Calibration of COMS
Geosta-tionary Ocean Color Imager, in: Sensors, Systems, and Next-Generation Satellites X, Proc. SPIE, Stockholm, Sweden, doi:10.1117/12.689888, 2006.
30
AMTD
8, 9565–9609, 2015GOCI Yonsei Aerosol Retrieval (YAER)
algorithm and validation
M. Choi et al.
Title Page
Abstract Introduction
Conclusions References
Tables Figures
◭ ◮
◭ ◮
Back Close
Full Screen / Esc
Printer-friendly Version Interactive Discussion
Discussion
P
a
per
|
Discussion
P
a
per
|
Discussion
P
a
per
|
Discussion
P
a
per
|
Kaufman, Y. J., Wald, A. E., Remer, L. A., Gao, B. C., Li, R. R., and Flynn, L.: The MODIS 2.1-mu m channel – Correlation with visible reflectance for use in remote sensing of aerosol, IEEE T. Geosci. Remote, 35, 1286–1298, 1997b.
Kim, J., Lee, J., Lee, H. C., Higurashi, A., Takemura, T., and Song, C. H.: Consistency of the aerosol type classification from satellite remote sensing during the Atmospheric Brown 5
Cloud-East Asia Regional Experiment campaign, J. Geophys. Res.-Atmos., 112, D22S33, doi:10.1029/2006JD008201, 2007.
Kim, J., Yoon, J. M., Ahn, M. H., Sohn, B. J., and Lim, H. S.: Retrieving aerosol optical depth using visible and mid-IR channels from geostationary satellite MTSAT-1R, Int. J. Remote Sens., 29, 6181–6192, 2008.
10
Kim, S. W., Yoon, S. C., Kim, J., and Kim, S. Y.: Seasonal and monthly variations of columnar aerosol optical properties over east Asia determined from multi-year MODIS, LIDAR, and AERONET Sun/sky radiometer measurements, Atmos. Environ., 41, 1634–1651, 2007. Knapp, K. R., Vonder Haar, T. H., and Kaufman, Y. J.: Aerosol optical depth retrieval from
GOES-8: Uncertainty study and retrieval validation over South America, J. Geophys. Res.-15
Atmos., 107, 4055, doi:10.1029/2001JD000505, 2002.
Knapp, K. R., Frouin, R., Kondragunta, S., and Prados, A.: Toward aerosol optical depth re-trievals over land from GOES visible radiances: determining surface reflectance, Int. J. Re-mote Sens., 26, 4097–4116, 2005.
Koelemeijer, R. B. A., de Haan, J. F., and Stammes, P.: A database of spectral surface reflectivity 20
in the range 335–772 nm derived from 5.5 years of GOME observations, J. Geophys. Res.-Atmos., 108, 4070, doi:10.1029/2002jd002429, 2003.
Lee, J., Kim, J., Song, C. H., Kim, S. B., Chun, Y., Sohn, B. J., and Holben, B. N.: Characteristics of aerosol types from AERONET sunphotometer measurements, Atmos. Environ., 44, 3110– 3117, 2010a.
25
Lee, J., Kim, J., Song, C. H., Ryu, J. H., Ahn, Y. H., and Song, C. K.: Algorithm for retrieval of aerosol optical properties over the ocean from the Geostationary Ocean Color Imager, Remote Sens. Environ., 114, 1077–1088, 2010b.
Lee, J., Kim, J., Yang, P., and Hsu, N. C.: Improvement of aerosol optical depth retrieval from MODIS spectral reflectance over the global ocean using new aerosol models archived from 30
AMTD
8, 9565–9609, 2015GOCI Yonsei Aerosol Retrieval (YAER)
algorithm and validation
M. Choi et al.
Title Page
Abstract Introduction
Conclusions References
Tables Figures
◭ ◮
◭ ◮
Back Close
Full Screen / Esc
Printer-friendly Version Interactive Discussion
Discussion
P
a
per
|
Discussion
P
a
per
|
Discussion
P
a
per
|
Discussion
P
a
per
|
Lee, J., Hsu, N. C., Bettenhausen, C., and Sayer, A. M.: Retrieval of aerosol optical depth under thin cirrus from MODIS: application to an ocean algorithm, J. Geophys. Res.-Atmos., 118, 10111–10124, 2013.
Levy, R. C., Remer, L. A., Mattoo, S., Vermote, E. F., and Kaufman, Y. J.: Second-generation operational algorithm: retrieval of aerosol properties over land from inversion of Moderate 5
Resolution Imaging Spectroradiometer spectral reflectance, J. Geophys. Res.-Atmos., 112, D13211, doi:10.11029/12006jd007811, 2007.
Levy, R. C., Remer, L. A., Kleidman, R. G., Mattoo, S., Ichoku, C., Kahn, R., and Eck, T. F.: Global evaluation of the Collection 5 MODIS dark-target aerosol products over land, Atmos. Chem. Phys., 10, 10399–10420, doi:10.5194/acp-10-10399-2010, 2010.
10
Levy, R. C., Mattoo, S., Munchak, L. A., Remer, L. A., Sayer, A. M., Patadia, F., and Hsu, N. C.: The Collection 6 MODIS aerosol products over land and ocean, Atmos. Meas. Tech., 6, 2989–3034, doi:10.5194/amt-6-2989-2013, 2013.
Li, R. R., Kaufman, Y. J., Gao, B. C., and Davis, C. O.: Remote sensing of suspended sediments and shallow coastal waters, IEEE T. Geosci. Remote, 41, 559–566, 2003.
15
Mayer, B. and Kylling, A.: Technical note: The libRadtran software package for radiative trans-fer calculations – description and examples of use, Atmos. Chem. Phys., 5, 1855–1877, doi:10.5194/acp-5-1855-2005, 2005.
Mishchenko, M. I., Travis, L. D., Kahn, R. A., and West, R. A.: Modeling phase functions for dustlike tropospheric aerosols using a shape mixture of randomly oriented polydisperse 20
spheroids, J. Geophys. Res.-Atmos., 102, 16831–16847, 1997.
Munchak, L. A., Levy, R. C., Mattoo, S., Remer, L. A., Holben, B. N., Schafer, J. S., Hostetler, C. A., and Ferrare, R. A.: MODIS 3 km aerosol product: applications over land in an urban/suburban region, Atmos. Meas. Tech., 6, 1747–1759, doi:10.5194/amt-6-1747-2013, 2013.
25
O’Neill, N. T., Eck, T. F., Smirnov, A., Holben, B. N., and Thulasiraman, S.: Spectral dis-crimination of coarse and fine mode optical depth, J. Geophys. Res.-Atmos., 108, 4559, doi:10.1029/2002jd002975, 2003.
Park, M. E., Song, C. H., Park, R. S., Lee, J., Kim, J., Lee, S., Woo, J.-H., Carmichael, G. R., Eck, T. F., Holben, B. N., Lee, S.-S., Song, C. K., and Hong, Y. D.: New approach to monitor 30
AMTD
8, 9565–9609, 2015GOCI Yonsei Aerosol Retrieval (YAER)
algorithm and validation
M. Choi et al.
Title Page
Abstract Introduction
Conclusions References
Tables Figures
◭ ◮
◭ ◮
Back Close
Full Screen / Esc
Printer-friendly Version Interactive Discussion
Discussion
P
a
per
|
Discussion
P
a
per
|
Discussion
P
a
per
|
Discussion
P
a
per
|
Redemann, J., Masonis, S. J., Schmid, B., Anderson, T. L., Russell, P. B., Livingston, J. M., Dubovik, O., and Clarke, A. D.: Clear-column closure studies of aerosols and water va-por aboard the NCAR C-130 during ACE-Asia, 2001, J. Geophys. Res.-Atmos., 108, 8655, doi:10.1029/2003jd003442, 2003.
Reid, J. S., Hobbs, P. V., Ferek, R. J., Blake, D. R., Martins, J. V., Dunlap, M. R., and Liousse, C.: 5
Physical, chemical, and optical properties of regional hazes dominated by smoke in Brazil, J. Geophys. Res.-Atmos., 103, 32059–32080, 1998.
Remer, L. A., Kaufman, Y. J., Tanré, D., Mattoo, S., Chu, D. A., Martins, J. V., Li, R. R., Ichoku, C., Levy, R. C., Kleidman, R. G., Eck, T. F., Vermote, E., and Holben, B. N.: The MODIS aerosol algorithm, products, and validation, J. Atmos. Sci., 62, 947–973, 2005. 10
Remer, L. A., Kleidman, R. G., Levy, R. C., Kaufman, Y. J., Tanre, D., Mattoo, S., Martins, J. V., Ichoku, C., Koren, I., Yu, H. B., and Holben, B. N.: Global aerosol climatology from the MODIS satellite sensors, J. Geophys. Res.-Atmos., 113, D14S07, doi:10.1029/2007jd009661, 2008. Saide, P. E., Kim, J., Song, C. H., Choi, M., Cheng, Y. F., and Carmichael, G. R.:
Assimila-tion of next generaAssimila-tion geostaAssimila-tionary aerosol optical depth retrievals to improve air quality 15
simulations, Geophys. Res. Lett., 41, 9188–9196, 2014.
Sayer, A. M., Hsu, N. C., Bettenhausen, C., Ahmad, Z., Holben, B. N., Smirnov, A., Thomas, G. E., and Zhang, J.: SeaWiFS Ocean Aerosol Retrieval (SOAR): algorithm, validation, and comparison with other data sets, J. Geophys. Res.-Atmos., 117, D03206, doi:03210.01029/02011jd016599, 2012.
20
Sayer, A. M., Hsu, N. C., Bettenhausen, C., and Jeong, M. J.: Validation and uncertainty es-timates for MODIS Collection 6 “Deep Blue” aerosol data, J. Geophys. Res.-Atmos., 118, 7864–7872, 2013.
Schmid, B., Hegg, D. A., Wang, J., Bates, D., Redemann, J., Russell, P. B., Livingston, J. M., Jonsson, H. H., Welton, E. J., Seinfeld, J. H., Flagan, R. C., Covert, D. S., Dubovik, O., 25
and Jefferson, A.: Column closure studies of lower tropospheric aerosol and water vapor
during ACE-Asia using airborne Sun photometer and airborne in situ and ship-based lidar measurements, J. Geophys. Res.-Atmos., 108, 8656, doi:10.1029/2002jd003361, 2003. Torres, O., Bhartia, P. K., Herman, J. R., Ahmad, Z., and Gleason, J.: Derivation of aerosol
prop-erties from satellite measurements of backscattered ultraviolet radiation: theoretical basis, J. 30
Geophys. Res.-Atmos., 103, 17099–17110, 1998.