ACPD
15, 10773–10812, 2015Improvements in AOD retrieval from
geostationary measurements
M. Kim et al.
Title Page
Abstract Introduction
Conclusions References
Tables Figures
◭ ◮
◭ ◮
Back Close
Full Screen / Esc
Printer-friendly Version
Interactive Discussion
Discussion
P
a
per
|
Discussion
P
a
per
|
Discussion
P
a
per
|
Discussion
P
a
per
|
Atmos. Chem. Phys. Discuss., 15, 10773–10812, 2015 www.atmos-chem-phys-discuss.net/15/10773/2015/ doi:10.5194/acpd-15-10773-2015
© Author(s) 2015. CC Attribution 3.0 License.
This discussion paper is/has been under review for the journal Atmospheric Chemistry and Physics (ACP). Please refer to the corresponding final paper in ACP if available.
Improvements in AOD retrieval from
geostationary measurements over Asia
with aerosol optical properties derived
from the DRAGON-Asia campaign
M. Kim1, J. Kim1, U. Jeong1, W. Kim1, B. Holben2, T. F. Eck2,3, J. H. Lim4, C. K. Song4, and S. Lee4,*
1
Department of Atmosphere Sciences/IEAA BK 21 plus, Yonsei University, Seoul, Korea 2
NASA Goddard Space Flight Center, Greenbelt, MD, USA 3
Universites Space Research Association, Columbia, MD, USA 4
National Institute of Environmental Research (NIER), Inchon, Korea *
now at: Asia Center for Air Pollution Research (ACAP), Niigata-shi, Japan
Received: 11 March 2015 – Accepted: 24 March 2015 – Published: 14 April 2015
Correspondence to: J. Kim (jkim2@yonsei.ac.kr)
ACPD
15, 10773–10812, 2015Improvements in AOD retrieval from
geostationary measurements
M. Kim et al.
Title Page
Abstract Introduction
Conclusions References
Tables Figures
◭ ◮
◭ ◮
Back Close
Full Screen / Esc
Printer-friendly Version
Interactive Discussion
Discussion
P
a
per
|
Discussion
P
a
per
|
Discussion
P
a
per
|
Discussion
P
a
per
|
Abstract
An aerosol model optimized for East Asia is improved by applying inversion data from both long-term monitoring of the Aerosol Robotic Network (AERONET) sun photome-ter and the Distributed Regional Aerosol Gridded Observation Networks (DRAGON)-Asia campaign from 2012. This model plays an important role in retrieving accurate 5
aerosol optical depth (AOD) from satellite-based measurements. In particular, the per-formance of a single visible channel algorithm, limited to a specific aerosol type, from real-time measurements is strongly affected by the assumed aerosol optical properties (AOPs) for the measured scene. In sensitivity tests, a 4 % difference in single scatter-ing albedo (SSA) between modeled and measured values can cause a retrieval error in 10
AOD of over 20 %, and the overestimation of SSA leads to an underestimation of AOD. Based on the AERONET inversion datasets obtained over East Asia before 2011, sea-sonally analyzed AOPs can be summarized by SSAs (measured at 675 nm) of 0.92, 0.94, 0.92, and 0.91 for spring (March, April, and May), summer (June, July, and Au-gust), autumn (September, October, and November), and winter (December, January, 15
and February), respectively. After DRAGON-Asia 2012, the SSA during spring shows a slight increase to 0.93. The large volume of data and spatially concentrated measure-ments from this campaign can be used to improve the representative aerosol model for East Asia. Accordingly, the AOD datasets retrieved from a single channel algorithm, which uses a pre-calculated look-up table (LUT) with the new aerosol model, show 20
an improved correlation with the measured AOD during the DRAGON-Asia campaign (March to May 2012). Compared with the correlation of the AOD retrieved using the original aerosol model, the regression slope between the new AOD and the AERONET values is reduced from 1.08 to 1.00, while the change of they-offset of−0.08 is signif-icant. The correlation coefficients for the comparisons are 0.87 and 0.85, respectively. 25
ACPD
15, 10773–10812, 2015Improvements in AOD retrieval from
geostationary measurements
M. Kim et al.
Title Page
Abstract Introduction
Conclusions References
Tables Figures
◭ ◮
◭ ◮
Back Close
Full Screen / Esc
Printer-friendly Version
Interactive Discussion
Discussion
P
a
per
|
Discussion
P
a
per
|
Discussion
P
a
per
|
Discussion
P
a
per
|
1 Introduction
An understanding of global aerosol distribution and its optical characteristics is im-portant not only for predictions related to climate change, but also for monitoring the effects of changing air quality on human health. It is widely accepted that aerosol has both direct and indirect effects on the Earth radiation budget (IPCC, 2013). Aerosols 5
are also linked to respiratory illness (e.g. Pope and Dockery, 2006) and meningitis epi-demics (e.g. Deroubaix et al., 2013). The global aerosol distribution shows high spatial and temporal variability, and many studies have developed aerosol retrieval algorithms utilizing both low earth orbit (LEO) satellite measurements (Diner et al., 2001; Hig-urashi and Nakajima, 1999; Hsu et al., 2004; Kaufman et al., 1997; Kim et al., 2007; 10
Levy et al., 2010; Lyapustin et al., 2011b; Mishchenko et al., 1999; Remer et al., 2005; Tanre et al., 1997; Torres et al., 1998, 2007; von Hoyningen-Huene et al., 2003; Wong et al., 2010) and geostationary orbit (GEO) satellite measurements (Kim et al., 2008, 2014; Lee et al., 2010; Knapp et al., 2002, 2005; Urm and Sohn, 2005; Wang et al., 2003; Yoon et al., 2007; Zhang et al., 2011).
15
These studies have typically adopted an inversion approach, using a pre-calculated look-up table (LUT) based on assumed aerosol optical properties (AOPs) to retrieve aerosol information from the measured visible reflectance at the top of the atmo-sphere. In this method, the accurate estimation of surface reflectance and assump-tion of optimized aerosol optical type are key to retrieving accurate aerosol informa-20
tion. Under conditions of low aerosol optical depth (AOD), the estimation of surface reflectance is most crucial, while assumptions about the type of aerosol are more sig-nificant in cases where AOD is higher. A variation in single scattering albedo (SSA)
of ±3 % (based on a reference value of 0.90) results in a 10 % error for moderate
AOD (τ=0.5 at 0.67 µm) and a 32 % error for large AODs (τ=1.5) (Zhang et al.,
25
Pear-ACPD
15, 10773–10812, 2015Improvements in AOD retrieval from
geostationary measurements
M. Kim et al.
Title Page
Abstract Introduction
Conclusions References
Tables Figures
◭ ◮
◭ ◮
Back Close
Full Screen / Esc
Printer-friendly Version
Interactive Discussion
Discussion
P
a
per
|
Discussion
P
a
per
|
Discussion
P
a
per
|
Discussion
P
a
per
|
son coefficient, regression slope, and the percentage of data within an expected er-ror bound. Ground-based measurements are essential to the construction of a well-defined aerosol model to calculate a LUT. Aerosol observations from ground-based sun/sky radiometer measurements, such as the AERONET, provide accurate global and local AOPs, including AOD and radiative absorptivity. Numerous aerosol models 5
for satellite aerosol algorithms have been based on the AERONET datasets. Field cam-paigns can improve these models further by providing AOPs at a high spatial resolu-tion. The AERONET project significantly improved our understanding of the mesoscale variation of aerosol characteristics. Recently, the Distributed Regional Aerosol Gridded Observation Networks (DRAGON)-Asia 2012 campaign over South Korea and Japan, 10
from March to May 2012, provided a valuable insight into the characteristics of aerosol over metropolitan areas http://aeronet.gsfc.nasa.gov/new_web/DRAGON-Asia_2012_ Japan_South_Korea.html). In Korea, 20 Cimel sun-sky radiometer instruments were deployed in Seoul, as well as in eastern and western parts of the country. In Japan, about 20 instruments were deployed in Osaka, West Japan and Fukushima valley. The 15
distribution of DRAGON-Korea and -Japan sites is shown in Fig. 1, along with the num-ber of AOD data provided in level 2.0 (cloud screened and quality assured; Smirnov et al., 2000) direct products during the campaign. The campaign studied aerosol char-acteristics over known polluted areas affected by diverse aerosol sources such as dust and urban pollutants. In addition, the fine spatial resolution data from the campaign 20
were used to validate the satellite aerosol algorithm, and to improve the accuracy of the algorithm over this region.
To investigate the role of the mesoscale network of ground-based aerosol mea-surements in the satellite-based AOD retrieval, a single channel algorithm by Kim et al. (2014) is used in this study. Previous studies (e.g. Knapp et al., 2002; Yoon, 25
ACPD
15, 10773–10812, 2015Improvements in AOD retrieval from
geostationary measurements
M. Kim et al.
Title Page
Abstract Introduction
Conclusions References
Tables Figures
◭ ◮
◭ ◮
Back Close
Full Screen / Esc
Printer-friendly Version
Interactive Discussion
Discussion
P
a
per
|
Discussion
P
a
per
|
Discussion
P
a
per
|
Discussion
P
a
per
|
as described by Kim et al. (2014), is used to integrate the aerosol optical model with the seasonally compiled volume size distribution and refractive index obtained from AERONET retrievals, taking into account the monsoon climate of the region. Due to the importance of the aerosol type selection, the present study also applies the critical reflectance method (Fraser and Kaufman, 1985) to detremine the aerosol absorption 5
for each measured scene over urban areas. Subsequently, the accumulated datasets of AOPs over the area of interest are used to improve the representative aerosol model and the accuracy of retrieved AOD. In this study, the aerosol model is newly analyzed and applied to the algorithm, to compare the retrieved AODs with directly measured values from the DRAGON-Asia campaign.
10
The datasets used in this study are summarized in Sect. 2, and details of the single channel algorithm and its results are described in Sect. 3. The algorithm is similar in nature to that described by Kim et al. (2014), which improved the basic single chan-nel algorithm by applying the critical reflectance method and background AOD (BAOD) correction. The BAOD was defined to represent the persistent concentration of aerosol 15
even in the clearest air condition, and was estimated by finding the minimum AOD among the long-term measurement. Since the algorithm estimated surface reflectance based on the minimum reflectance method, underestimation or neglect of the BAOD results in the overestimation of the surface reflectance, and thus leads to the underes-timation of AOD (Knapp et al., 2002; Yoon, 2006). Though the application of the critical 20
reflectance was effective in the Kim et al. (2014) study, the correction for BAOD in es-timates of surface reflectance showed a more significant effect. The BAOD correction is also adopted here, whereas the critical reflectance method is not considered. Modi-fications to the aerosol model using data from the DRAGON-Asia campaign, and their effects on subsequent retrievals, are outlined in Sect. 4.
ACPD
15, 10773–10812, 2015Improvements in AOD retrieval from
geostationary measurements
M. Kim et al.
Title Page
Abstract Introduction
Conclusions References
Tables Figures
◭ ◮
◭ ◮
Back Close
Full Screen / Esc
Printer-friendly Version
Interactive Discussion
Discussion
P
a
per
|
Discussion
P
a
per
|
Discussion
P
a
per
|
Discussion
P
a
per
|
2 Data
2.1 AERONET
The AERONET, a network of globally distributed ground-based sun photometers, is widely used to understand global AOPs and to validate satellite-based aerosol prod-ucts. The AERONET sun photometer measurements of direct solar radiation provide 5
accurate measurements of AOD (∼0.01 in the visible and near-infrared and ∼0.02
in the UV) under cloud-free conditions (Eck et al., 1999; Holben et al., 1998, 2001), and sky radiance measurements in an almucantar scenario can be inverted to calcu-late AOPs such as size distribution, single scattering albedo, phase functions, and the complex index of refraction (Dubovik and King, 2000; Dubovik et al., 2000, 2002). 10
During the DRAGON-Asia 2012 campaign, deployed sun photometers provided the high spatial-resolution information to address characteristics of mega-city aerosol. Fig-ure 2 shows average and standard deviation for each of AOD (500 nm) and Ångström Exponent (AE, 440–870 nm) measured during the campaign. In Fig. 2a, the average AOD ranged between 0.23 and 0.52, and showed a decreasing trend towards south-15
east. The maximum value of 0.52 was found at two sites in Fukue (128.68◦E, 32.75◦N)
and Sanggye (127.07◦E, 37.66◦N), while the minimum value of 0.23 was found at
Kohriyama site (140.38◦E, 37.36◦N). In terms of local average, the mean AOD of 0.43
in Seoul was higher than the value of 0.30 in Osaka. Similarly, the standard deviation of AOD in Fig. 2b was decreased in the eastern part of Korea. While the standard 20
deviation varying between 0.22 and 0.31 in Seoul, the values of Japan was between 0.11 and 0.16. The regional difference was figured out also in terms of AE in Fig. 2c. The respective average AE of 1.20 and 1.27 in Seoul and Osaka represents that the particle size in Seoul is larger than that of Osaka, in general. Meanwhile, the low spatial variation in the AE represents that the change of particle size for each site was not sig-25
ACPD
15, 10773–10812, 2015Improvements in AOD retrieval from
geostationary measurements
M. Kim et al.
Title Page
Abstract Introduction
Conclusions References
Tables Figures
◭ ◮
◭ ◮
Back Close
Full Screen / Esc
Printer-friendly Version
Interactive Discussion
Discussion
P
a
per
|
Discussion
P
a
per
|
Discussion
P
a
per
|
Discussion
P
a
per
|
In this study, the extensive AERONET inversion data (level 2.0 daily products) over East Asia (20–50◦N, 95–145◦E) were used to analyse optimized AOPs; the retrieved
volume size distribution and complex refractive indices, which are utilized to compute the spectral SSA. Level 2.0 AOD datasets measured for the DRAGON-Asia 2012 cam-paign with more than 50 data points were used to validate the retrieval results. The 5
AERONET sites used, including the campaign sites, are listed in Table 1, along with the period of the inversion products. The campaign sites are numbered, and sites in-dicated by bold character represent the validation site selected randomly to test the consistency of the retrieval accuracy. At those validation sites, direct AOD products are used to validate the algorithm, but inversion products are excluded from the integration 10
of aerosol model. A total of 12 126 inversion datasets from 1999 to 2012 were compiled, and 84 091 AOD datasets at 39 campaign sites in spring of 2012 were applied.
2.2 Meteorological imager
A multi-purpose geostationary satellite, Communication, Ocean, and Meteorological
Satellite (COMS), designed to orbit at a longitude of 128.2◦E, was launched on
15
27 June 2010 by the Korean government http://nmsc.kma.go.kr/html/homepage/en/ chollian/choll_info.do). The satellite performs meteorological and ocean monitoring by using the Meteorological Imager (MI) and Geostationary Ocean Color Imager (GOCI) instruments. The MI measures the single visible reflectance (0.55–0.80 µm) at a 1 km spatial resolution, and the brightness temperature (BT) at four IR wavelengths at a 4 km 20
ACPD
15, 10773–10812, 2015Improvements in AOD retrieval from
geostationary measurements
M. Kim et al.
Title Page
Abstract Introduction
Conclusions References
Tables Figures
◭ ◮
◭ ◮
Back Close
Full Screen / Esc
Printer-friendly Version
Interactive Discussion
Discussion
P
a
per
|
Discussion
P
a
per
|
Discussion
P
a
per
|
Discussion
P
a
per
|
2.3 MODIS AOD
To estimate the BAOD distribution over East Asia, an AOD product at 10 km×10 km
resolutions from the Moderate Resolution Imaging Spectroradiometer (MODIS) was used (Collection 5.1; MYD04_Lv2.0). The AOD at 550 nm from a dark target algorithm (Levy et al., 2007, 2010; Remer et al., 2005) was interpolated onto a grid of 0.25◦
×0.25◦
5
to find the minimum value for each area. The expected error in the AOD product is
±(0.05+15 %), and over 66 % of the retrieved AODs from the MODIS algorithm lie
within the error range, with a correlation coefficient of 0.9 (Levy et al., 2010).
3 Single channel algorithm
The basic concept of the single channel algorithm lies in the inversion of the top-of-10
atmosphere (TOA) reflectance to AOD by using the one-to-one relationship between two variables under condition of known geometry and surface reflectance. The sensitiv-ities of the reflectance to each variable are forward-modeled using a radiative transfer model (RTM), assuming certain microphysical properties for the aerosol. The results are compiled into a LUT, where the assumed characteristics of the AOPs form the basis 15
for the aerosol model. Generally, the LUT for a single channel algorithm lists the cal-culated reflectance as a function of AOD, surface reflectance, measurement geometry, and the assumed aerosol model. In this study, a dynamic aerosol model was con-structed using long-term AERONET inversion data to consider changes in refractive index, the mode radius and the width (standard deviation) in the volume size distribu-20
tion with respect to the AOD. The volume size distribution consists of two modes, fine and coarse, and both vary in accordance with assumed AOD in the RTM simulation. In addition, the aerosol model was designed to include the seasonal variation in AOPs, with a different LUT selected depending on the season in which the measurement was taken. A flowchart of the AOD retrieval algorithm for MI measurements is shown in 25
ACPD
15, 10773–10812, 2015Improvements in AOD retrieval from
geostationary measurements
M. Kim et al.
Title Page
Abstract Introduction
Conclusions References
Tables Figures
◭ ◮
◭ ◮
Back Close
Full Screen / Esc
Printer-friendly Version
Interactive Discussion
Discussion
P
a
per
|
Discussion
P
a
per
|
Discussion
P
a
per
|
Discussion
P
a
per
|
under the assumption that the increase in AOD makes a positive contribution to TOA reflectance over a dark surface. The minimum TOA reflectance obtained from the pre-vious 30 day measurement was converted to surface reflectance, after correcting for scattering by atmospheric molecules and for BAOD.
The AOD was retrieved only for cloud-free pixels satisfying threshold tests of TOA re-5
flectance and brightness temperature (BT). The thresold of 0.35 for the TOA reflectance at the visible channel saperated bright cloud pixel, and the thresold of 5 K for the BT difference between the maximum BT for the previous 30 days and the BT of the current pixel saperated cold cloud pixel. The pixels which have BT lower than 265 K were also masked out. Additionally, thresholds for BT differences between IR1 and IR2, and IR1 10
and IR4 were taken from Frey et al. (2008). The thresholds to distinguish cloud and aerosol pixel, and to detect low level cloud were adjusted as follows by trial and error.
Visible reflectance>0.35 IR1-IR2>0.5 K & IR1<268 K IR1-IR2>0.5 K & IR1max-IR1>5 K 15
IR1-IR2>1.5 K & IR1-IR4<−6 K for Ocean IR1-IR2>−0.5 K & IR1-IR4<−18 K for Ocean IR1-IR2>0.5 K & IR1-IR4<−10 K for Ocean IR1-IR2>1.5 K & IR1-IR4<−14 K for Land
3.1 Surface reflectance and BAOD
20
The BAOD represents a residual AOD value even in the clearest conditions; i.e. the minimum AOD for each location. According to analyses of global AERONET direct measurements, the minimum AOD over urban areas or near an aerosol source region is non-zero due to the steady emission of aerosol (Kim et al., 2015). An underesti-mation of BAOD results in an overestiunderesti-mation of retrieved AOD. In an environment of 25
neg-ACPD
15, 10773–10812, 2015Improvements in AOD retrieval from
geostationary measurements
M. Kim et al.
Title Page
Abstract Introduction
Conclusions References
Tables Figures
◭ ◮
◭ ◮
Back Close
Full Screen / Esc
Printer-friendly Version
Interactive Discussion
Discussion
P
a
per
|
Discussion
P
a
per
|
Discussion
P
a
per
|
Discussion
P
a
per
|
ligible, particularly over East Asia. Accordingly, Kim et al. (2014) used the monthly BAOD obtained from AERONET direct measurements in Hong Kong for AOD retrieval in the region. Subsequently, the BAOD was estimated from the MODIS AOD product for 7 years from 2006 to 2012, and used here in order to take advantage of the fine spatial resolution of the satellite measurements. The BAOD ranged from 0.00 to 0.56, 5
with an average value of 0.3 (Fig. 4). The median value of the BAOD over land was 0.017, while the value over the ocean was 0.022 (sea-salt aerosol is the most likely cause of the increased BAOD over the ocean). However, the values near metropolitan areas such as Beijing, Seoul, Tokyo, and Hong Kong were generally higher than 0.1. Over the industrialized region located in the lower reaches of the Yangtze River and 10
near Hong Kong, the values reached over 0.30. Conversely, the region located far from the aerosol source showed low BAODs. Overall, the BAOD map clearly reveals the most heavily polluted region as a hotspot.
The surface reflectance was estimated from the minimum TOA reflectance, after correcting for atmospheric and BAOD effects. For details of the atmospheric correction, 15
see Kim et al. (2014).
3.2 Aerosol model
The calculated TOA reflectance from RTM simulations is affected by the concentration, particle size/shape and radiative absorptivity of aerosol. Consequently, an increase in the SSA of the particle correlates positively with TOA reflectance for the same AOD. 20
The use of a well-defined aerosol model to generate the LUT is therefore crucial to obtaining accurate AOD values from the inversion method. Since the geostationary MI steadily observes the same field of view at a fixed location, a regionally integrated aerosol model for the area of interest can suggest typical characteristics from these data. In this study, as previously mentioned, the aerosol models were obtained from 25
a seasonal average of AERONET inversion datasets over East Asia, and two groups
of inversion datasets were applied to examine the effect of the DRAGON-Asia
ACPD
15, 10773–10812, 2015Improvements in AOD retrieval from
geostationary measurements
M. Kim et al.
Title Page
Abstract Introduction
Conclusions References
Tables Figures
◭ ◮
◭ ◮
Back Close
Full Screen / Esc
Printer-friendly Version
Interactive Discussion
Discussion
P
a
per
|
Discussion
P
a
per
|
Discussion
P
a
per
|
Discussion
P
a
per
|
AERONET sites from 1999 to 2010, with total 4898 data points. The sites for this first dataset were selected from the same lists as used by Kim et al. (2014). This group was named as the original dataset, and the name and location of these sites are rep-resented by italic type. The full list shown by normal character in Table 1 summarizes the sites used to construct the new data group as described in Sect. 2.1.
5
The new group includes 40 additional AERONET sites and extends the measure-ment period by up to 2 years. The greater quantity of data, from the increased number of sites and the extended measurement periods, allows us to optimize the aerosol model for the monitored region. To compare the effects of the temporal extension and spatially more dense measurements, the integrated AOPs for each case are presented 10
in Table 2. The upper 4 rows of the table show the seasonal average value of SSA at 675 nm from the original dataset for each AOD bin. The total averages of the SSA were 0.92, 0.94, 0.92, and 0.91 for MAM (March, April, and May), JJA (June, July, and August), SON (September, October, and November), and DJF (December, Jan-uary, and February), respectively. The SSAs obtained from the temporally extended 15
datasets from the same sites, shown in the middle part of Table 2, were not signifi-cantly different from the original values. Although the values for higher AODs (>0.8) were slightly increased during DJF, the mean was not significantly changed due to the relatively low number of high AOD measurements compared with the number of lower AOD measurements. A slight decrease in SSA for an AOD bin of 0.15 is attributed to 20
the extended measurement period except for JJA. When data from the DRAGON-Asia campaign, and a few additional sites in China, were applied, all of AOD bins showed increased SSA above 0.005 during MAM, and increasing the total SSA from 0.92 to 0.93. A slight decrease in SSA for AOD bins (1.2) during SON is attributed to the in-creased number of sites, and an increase in SSA for higher AODs (>0.8) during DJF 25
ACPD
15, 10773–10812, 2015Improvements in AOD retrieval from
geostationary measurements
M. Kim et al.
Title Page
Abstract Introduction
Conclusions References
Tables Figures
◭ ◮
◭ ◮
Back Close
Full Screen / Esc
Printer-friendly Version
Interactive Discussion
Discussion
P
a
per
|
Discussion
P
a
per
|
Discussion
P
a
per
|
Discussion
P
a
per
|
changes in SSA caused by the larger dataset were not strongly significant, and the original dataset remains representative of the characteristics of AOPs over the East Asia region. In addition, the change in SSA during MAM indicates that the increased
number of measurement sites has a greater effect than the extended measurement
period. 5
The refractive indices obtained from the inversion groups are listed in Table 3. Com-pared with the original group, the new group (temporal-spatially extended group) shows an increase in imaginary part of the refractive index by>0.001 during MAM and DJF. In general, the value of the real and imaginary parts of the refractive indices are in-creased and dein-creased, respectively, with increases in AOD. While the real part of 10
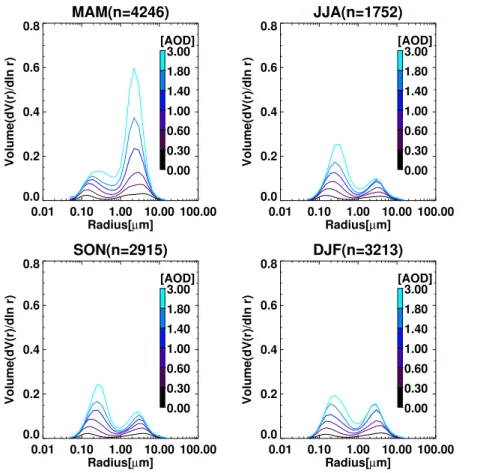
refractive index is higher during MAM and DJF than JJA and SON, the imaginary value increases as going from MAM to DJF. Meanwhile, Fig. 5 shows the volume size distri-bution analyzed from the new data group for each season and AOD bin. In the case of volume size distribution, the fine mode particles of a bi-modal log-normal size distri-bution tend to dominate. When the AOD is greater than 1.2 during MAM, however, the 15
coarse-mode particles become dominant due to more frequent dust events. With the increase in AOD, the mode radius of fine particles is increased, while that of coarse particles is decreased. In accordance with these variations in the volume size distri-bution and the refractive index, the SSA tends to increase with increasing AOD. With respect to seasonal variation, the SSA is high during JJA due to the hygroscopic growth 20
of aerosol particles in humid conditions and also cloud processing. However, the large emission of black carbon (BC) from heating sources and dust from deserts causes a decrease in SSA during MAM and DJF. Using aerosol models derived from both the original and new datasets, LUTs were calculated by using the 6SV (Second Simula-tion of a Satellite Signal in the Solar Spectrum–Vector) RTM (Vermote et al., 1997; 25
ACPD
15, 10773–10812, 2015Improvements in AOD retrieval from
geostationary measurements
M. Kim et al.
Title Page
Abstract Introduction
Conclusions References
Tables Figures
◭ ◮
◭ ◮
Back Close
Full Screen / Esc
Printer-friendly Version
Interactive Discussion
Discussion
P
a
per
|
Discussion
P
a
per
|
Discussion
P
a
per
|
Discussion
P
a
per
|
calculate the LUTs. Surface elevation was also included to increase the accuracy of Rayleigh scattering correction.
As mentioned above, the AOD is retrieved by comparing measured and calculated TOA reflectance for a given set of measurement condition. Because the calculation of TOA reflectance is performed as a function of several input variables, the values in the 5
LUTs were linearly interpolated with the values in the neighbouring bins.
3.3 Sensitivity to assumed aerosol optical properties
To estimate the accuracy of retrievals from the inversion of the single channel algo-rithm, and to understand its sensitivity to uncertainty in the assumed SSA, a reference test was performed. In this test, the TOA reflectance, was analyzed for a ±4 %
vari-10
ation in SSA relative to the reference condition, from simulations using the RTM for
four different reference conditions of both AOD and SSA with assumed geometries.
In the simulation, the surface reflectance was assumed to be 0.05 and 0.10, and the scattering angle was varied from 135.7 to 173.2◦with respect to the geostationary mea-surement conditions. The surface elevation was at sea level, and cloud-free conditions 15
were assumed. The retrieved AOD from the simulated reflectance was then compared with the assumed reference AOD value. Because the AOD was retrieved from the
sim-ulated TOA reflectance by assuming the reference SSA, the ±4 % variation in SSA
cause an error in AOD. The results for the comparison between the reference value and retrieved AODs for each simulated reflectance are shown in Fig. 6. The case with 20
zero SSA error indicates that the assumed SSA for the retrieval was the same as the reference SSA. In other cases, the positive error in SSA indicates that the SSA used to calculate the LUT was overestimated when compared with the reference value. The errors in AOD and SSA were calculated as follows:
AOD error [%]=[(retrieved AOD−reference AOD)/reference AOD]·100
25
ACPD
15, 10773–10812, 2015Improvements in AOD retrieval from
geostationary measurements
M. Kim et al.
Title Page
Abstract Introduction
Conclusions References
Tables Figures
◭ ◮
◭ ◮
Back Close
Full Screen / Esc
Printer-friendly Version
Interactive Discussion
Discussion
P
a
per
|
Discussion
P
a
per
|
Discussion
P
a
per
|
Discussion
P
a
per
|
There is a strong negative correlation between the errors in SSA and AOD. The in-crease of absolute error in the SSA assumption results in an inin-creased AOD retrieval error, and the overestimation of SSA leads to an underestimation of AOD. In terms of the absolute value of AOD error, the effects of the positive and negative errors in SSA are symmetric in general, though the effect of the negative SSA is slightly greater. The 5
effect of assumed errors in SSA is more significant in scenarios with higher AOD. The SSA error of±3 % results in an AOD error of−18.70 % (−0.03, an absolute difference) and 20.34 % (0.03), respectively, when the reference AOD is 0.15 and the surface re-flectance is 0.05. The range of error is increased when the reference AOD is higher, with retrieval errors of−20.03 % (−0.24) and 23.31 % (0.28) caused by a ±3 % SSA
10
error when the reference AOD is 1.20.
The error in AOD also increases with the increase of assumed surface reflectance relative to true reflectance. When the surface reflectance is increased from 0.05 to 0.10, the errors in the reference AOD of 0.15 were ranged between−35 % (−0.05) and 36 % (0.05). The increase of effect of the SSA assumption was related with the one-15
to-one correlation between the “critical reflectance” and SSA reflectance (Castanho et al., 2008; Fraser and Kaufman, 1985). Whereas the increase of aerosol contributes to the increase of TOA reflectance over dark surface, the increase of AOD reduces the TOA reflectance by shielding the upwelling reflectance from bright surface. There exist, therefore, the surface reflectance at which the positive and negative contributions 20
ACPD
15, 10773–10812, 2015Improvements in AOD retrieval from
geostationary measurements
M. Kim et al.
Title Page
Abstract Introduction
Conclusions References
Tables Figures
◭ ◮
◭ ◮
Back Close
Full Screen / Esc
Printer-friendly Version
Interactive Discussion
Discussion
P
a
per
|
Discussion
P
a
per
|
Discussion
P
a
per
|
Discussion
P
a
per
|
4 Results and validation
4.1 Comparison with MODIS AOD
The greatest advantage of geostationary measurements is the availability of contin-uous measurements at high temporal resolution, thus obtaining more cloud-free ob-servations. In particular, the continuous monitoring of aerosol emission and transport 5
plays an important role in predicting changes in air quality, as well as understanding the effects of aerosol on climate change, over the North Pacific region. Figure 7 shows examples of retrieved AOD from the geostationary measurements from MI, using the single channel algorithm. The RGB images, obtained from GOCI measurements at 00:00, 02:00, 04:00, and 06:00 UTC on 27 April 2012, show dust flow from the Shan-10
dong Peninsula to the northern Korean Peninsula. Similarly, the images of retrieved AOD show values greater than 1.0 in the dust plume, while the AOD over other re-gions is lower than 0.4. Compared with the MODIS AOD, the distribution of MI AOD is spatially well matched, though the retrieved values over dusty regions are slightly higher. Spatially averaged value of the MI AOD in dusty region [110–125◦E, 35–40◦N]
15
decreased steadily from 2.67 at 00:00 UTC to 1.69 at 07:00 UTC, and the minimum value of 1.43 was found at 03:00 UTC 30. Meanwhile, the spatial mean values of AOD obtained respectively from TERRA and AQUA measurements were 1.11 at 03:00 UTC 55 and 1.18 at 05:00 UTC 15.
The results from MI also show the transport and concentration of aerosol over 20
a 30 min interval, while the MODIS product can provide only two images each day. The map of MI AOD in hourly intervals shows that the high concentration of aerosol was mostly observed over northern China and the Yellow Sea before 03:00 UTC, with the dust plume extending to the East Sea across the northern Korean Peninsula. We can deduce from the change in the dust stream that the wind field changed from straight 25
ACPD
15, 10773–10812, 2015Improvements in AOD retrieval from
geostationary measurements
M. Kim et al.
Title Page
Abstract Introduction
Conclusions References
Tables Figures
◭ ◮
◭ ◮
Back Close
Full Screen / Esc
Printer-friendly Version
Interactive Discussion
Discussion
P
a
per
|
Discussion
P
a
per
|
Discussion
P
a
per
|
Discussion
P
a
per
|
the low sensitivity of the aerosol compared with the surface. However, unlike the MI retrieval, part of the dust scene over the ocean was missed in the MODIS retrieval due to sun-glint masking.
4.2 Comparison with AERONET: DRAGON-Asia
For quantitative validation, the retrieved AODs were compared with the measured val-5
ues from the 39 AERONET sun-photometer sites in Korea and Japan. To investigate the effect of the new aerosol model as an input parameter to calculate the LUTs, the results of the original and new AOD retrievals were compared respectively, and the comparisons were shown in Fig. 8. The measured AODs from all of the numbered DRAGON-Asia sites listed in Table 1 were used in the comparison shown in the top 10
panel. In the lower panel, part of the AERONET AOD was used as a validation group to test the consistency of the algorithm and to validate the retrieval accuracy. The data from the validation group were not included in the AOP analysis due to a lack of inver-sion datasets. The comparison results are shown in the bottom panel of Fig. 8. The left and right panels show evaluations of the original and new AOD, respectively.
15
Using the original aerosol model, the retrieved AODs agree very well with the linear regression as follows:
τMI [original LUT]=1.08τDRAGON-Asia−0.08, RMSE=0.18, r =0.87
Although the Pearson coefficient of 0.87 indicates a significant correlation, the regres-sion slope indicates that the retrieved AOD is overestimated by 8 % compared with the 20
AERONET value. Comparison with the validation group, however, shows a tendency to systematic underestimation, with a slope of 1.01 andy-offset of−0.05.
By applying the new aerosol model, the regression slope was improved to 1.00, although other measures remained similar:
τMI [new LUT]=1.00τDRAGON-Asia−0.07, RMSE=0.17, r =0.85
ACPD
15, 10773–10812, 2015Improvements in AOD retrieval from
geostationary measurements
M. Kim et al.
Title Page
Abstract Introduction
Conclusions References
Tables Figures
◭ ◮
◭ ◮
Back Close
Full Screen / Esc
Printer-friendly Version
Interactive Discussion
Discussion
P
a
per
|
Discussion
P
a
per
|
Discussion
P
a
per
|
Discussion
P
a
per
|
The change of aerosol model caused a slight decrease of percentage of the compari-son data within 30 % difference range from 79.15 to 77.30 %, and decreased the slope of the comparison with the validation group from 1.01 to 0.93 though the comparison still shows strong correlation between the retrieved and measured AOD.
In Sect. 3.3, the analysis of the retrieval sensitivity to the SSA assumption showed 5
that the underestimation of the SSA in the aerosol model results in the overestimation of AOD. Thus, the overestimation of the original AOD suggests that the radiative ab-sorptivity of the aerosol during MAM was slightly underestimated prior to the campaign. According to Fig. 6, overestimation of AOD by up to 7 % can result from a 1 % underesti-mation of SSA. The uncertainty can vary with measurement geometry, AOD, or surface 10
reflectance. Therefore, the 8 % decrease in AOD can be caused by a 1.1 % increase in SSA in the new aerosol model during MAM. The large RMSE and the underestimation for the validation group, however, are attributed to the spatial and temporal variation in AOPs, which cannot be standardized by the optimized aerosol model.
To show the retrieval accuracy for each campaign site, the Taylor diagram (Taylor, 15
2001) is shown in Fig. 9. This diagram summarizes how closely a set of retrievals
matches observations in terms of r, RMSE, and standard deviation. The polar angle
of the point from thexaxis indicates the correlation coefficient, and the radial distance represents the normalized standard deviation, which in this case describes the ratio of the standard deviation of the retrieved MI AOD to that of the AERONET (reference) 20
values. The distance between the symbol and the dashed arc, which represents the standard deviation of the AERONET value, shows the similarity of the amplitude of their variations; a radial distance of>1 indicates that the standard deviation of the MI AOD is greater than that of AERONET. On the other hand, the RMSE between the MI
and AERONET AODs is proportional to the distance to the point on thex axis
identi-25
ACPD
15, 10773–10812, 2015Improvements in AOD retrieval from
geostationary measurements
M. Kim et al.
Title Page
Abstract Introduction
Conclusions References
Tables Figures
◭ ◮
◭ ◮
Back Close
Full Screen / Esc
Printer-friendly Version
Interactive Discussion
Discussion
P
a
per
|
Discussion
P
a
per
|
Discussion
P
a
per
|
Discussion
P
a
per
|
number 12) and Matsue (site number 19) in Japan. In spite of the high correlation co-efficients of 0.85 and 0.78 at the sites, the high regression slopes of 1.58 and 1.35 suggest that the radiative absorptivity was underestimated in this region, and thus the AOD was significantly overestimated in the case of high-AOD conditions. The large negativey-intercepts of−0.12 and−0.25 could be caused by the underestimation of 5
AOD following an overestimation of BAOD in the case of low-AOD conditions.
The comparison statistics of the original and new AOD, plotted in the Taylor diagram, are also listed in Tables 4 and 5, respectively. The correlation coefficients obtained from the 39 DRAGON sites range from 0.66 to 0.95 when the original aerosol model was applied. The minimum and maximum values were observed in Nishiharima in Japan 10
(site number 25) and Anmyeon in Korea (site number 3), respectively, and the average correlation coefficient was 0.84. As excluded the Fukue_2 site which has low compari-son data of only 4, retrievals the regression slopes at 32 AERONET sites were higher than 1.0, and the values at 9 sites exceeded 1.2.
As well as the Kohriyama and the Matsue sites, the comparison results for all but four 15
sites show a negativey-intercept of between−0.02 and −0.25. As with the improved correlation seen in the scatter plot, the Taylor diagram and regression statistics listed in Table 5 also show an improvement in retrieval accuracy at each site. The distances between the data point and the “AERONET” value at each site were generally reduced, especially at Tsukuba (site number 32). At this site, the systematic overestimation was 20
significantly improved by applying the new aerosol model, resulting also in an improved correlation coefficient. The regression slope over all sites was decreased by about 0.08, while they-intercept was changed within a range between−0.03 to 0.06, in accordance with the increased SSA in the new aerosol model. Whereas most of the comparisons were improved by the decrease in the slope, some sites (11, 21, 25, 26, 28 and 36) 25
ACPD
15, 10773–10812, 2015Improvements in AOD retrieval from
geostationary measurements
M. Kim et al.
Title Page
Abstract Introduction
Conclusions References
Tables Figures
◭ ◮
◭ ◮
Back Close
Full Screen / Esc
Printer-friendly Version
Interactive Discussion
Discussion
P
a
per
|
Discussion
P
a
per
|
Discussion
P
a
per
|
Discussion
P
a
per
|
5 Summary
A single channel algorithm was used to retrieve AOD over East Asia by adopting a new aerosol model, derived from data from the mesoscale network measurement campaign deploying sun-sky radiometers, DRAGON-Asia 2012. The campaign was performed during MAM 2012 to improve our understanding of the AOPs over well-known aerosol 5
source regions where aerosol loading is affected by both desert emissions and indus-trial pollutants. In addition, the direct solar measurements of spectral AOD undertaken during the campaign were used to improve the satellite-based aerosol retrieval algo-rithm by providing a dataset for validation.
The accuracy of the single channel algorithm is strongly affected by the surface re-10
flectance estimation and assumptions about the aerosol model. To estimate the surface reflectance, a minimum reflectance method was applied, and the BAOD was used to correct for the persistent background aerosol levels over East Asia. The BAOD was ob-tained by using the MODIS standard AOD product from 2006 to 2012. With respect to aerosol model selection, however, the single channel algorithm was limited by a lack of 15
spectral information. For this reason, the aerosol model was integrated from a season-ally sorted inversion dataset taking into account the monsoon climate over the region, which was used to calculate a LUT. To overcome the limitations of the retrieval accu-racy related to the limitation in aerosol type selection, it was important to optimize the aerosol model. The AOPs were obtained from two AERONET inversion data groups to 20
understand the effects of assumptions in the aerosol model. The original AOPs were constructed from the inversion dataset provided by 13 AERONET sites over East Asia before 2011, while the new AOPs were modified using data from an increased number of measurement sites, as well as additional data from the original sites. The obtained
AOPs show that the denser deployment of measurement sites has a greater effect on
25
the AOPs than the extended periods of measurement. This increase in spatial
reso-lution resulted in an increase of SSA by∼1.1 % during MAM, which was expected to
ACPD
15, 10773–10812, 2015Improvements in AOD retrieval from
geostationary measurements
M. Kim et al.
Title Page
Abstract Introduction
Conclusions References
Tables Figures
◭ ◮
◭ ◮
Back Close
Full Screen / Esc
Printer-friendly Version
Interactive Discussion
Discussion
P
a
per
|
Discussion
P
a
per
|
Discussion
P
a
per
|
Discussion
P
a
per
|
change in SSA which was suggested in Lyapustin et al. (2011a). The previous study showed increases in SSA in eastern China from 2000 to 2010 by about 0.02 at 470 nm. According to the sensitivity test, the error in the retrieved AOD varied from−19 to 20 %, in proportion with the assumed SSA error of±3 % in the aerosol model, for a scenario with reference AOD value of 0.15 and the surface reflectance of 0.05. The uncertainty 5
in retrieved AOD due to the assumed SSA error was increased at greater values of
AOD, and ranged between−20 and 23 % when the reference AOD value was 1.20. In
short, the overestimation of SSA in the aerosol model results in the underestimation of AOD, and assumed errors in SSA have a greater effect at higher values of AOD. Con-sidering the relationship between surface reflectance and the uncertainty, the retrieval 10
error in real measurements could be larger than the suggested value when the surface reflectance is near the critical reflectance.
The qualitative comparison between AODs retrieved from MODIS and MI showed a reasonably strong correlation. The MI AOD showed the movement of the dust plume crossing from the Shandong Peninsula to the northern Korean Peninsula by taking ad-15
vantage of the geostationary measurement, whereas the MODIS AOD provided two AOD maps during a single day by using two satellite measurements. AODs retrieved with both the original and new aerosol model showed a good correlation when val-idated with sun-photometer data from the DRAGON-Asia campaign. The correlation coefficient and the RMSE were slightly changed from 0.87 to 0.85 and 0.18 to 0.17, 20
respectively, by applying the new aerosol model. Increased SSA values in the new aerosol model resolved problems with AOD being overestimated, and the regression slope was significantly improved from 1.08 to 1.00. A comparison for each campaign site also showed that the statistics of the correlation were generally improved. For some regions, however, changes in the aerosol model led to underestimation of the AOD. 25
ACPD
15, 10773–10812, 2015Improvements in AOD retrieval from
geostationary measurements
M. Kim et al.
Title Page
Abstract Introduction
Conclusions References
Tables Figures
◭ ◮
◭ ◮
Back Close
Full Screen / Esc
Printer-friendly Version
Interactive Discussion
Discussion
P
a
per
|
Discussion
P
a
per
|
Discussion
P
a
per
|
Discussion
P
a
per
|
the effects of changing the aerosol model were less significant, as the algorithm can select an optimized aerosol type at each measured pixel. The accuracy of the BAOD is another important issue when using the minimum reflectance method to retrieve AOD, because overestimation of the BAOD results in a systematic underestimation of the AOD. The dense measurements of the AERONET sun-photometer network can be 5
used to optimize the BAOD at higher resolution, though the network cannot cover the whole field of view of the satellite measurement. Furthermore, an improved correction for cloud masking is required to reduce noise in the retrieval.
Acknowledgements. We thank the principal investigators and their staff for establishing and maintaining the AERONET sites used in this investigation. This research was supported by
10
the GEMS program of the Ministry of Environment, Korea, and the Eco Innovation Program of KEITI (2012000160002). This research was partially supported by the Brain Korea 21 Plus (J. Kim and M. Kim).
References
Castanho, A. D. D. A., Martins, J. V., and Artaxo, P.: MODIS aerosol optical depth Retrievals
15
with high spatial resolution over an urban area using the critical reflectance, J. Geophys. Res.-Atmos., 113, D02201, doi:10.1029/2007jd008751, 2008.
Deroubaix, A., Martiny, N., Chiapello, I., and Marticorena, B.: Suitability of OMI aerosol in-dex to reflect mineral dust surface conditions: preliminary application for studying the link with meningitis epidemics in the sahel, Remote Sens. Environ., 133, 116–127,
20
doi:10.1016/j.rse.2013.02.009, 2013.
Diner, D. J., Abdou, W. A., Bruegge, C. J., Conel, J. E., Crean, K. A., Gaitley, B. J., Helm-linger, M. C., Kahn, R. A., Martonchik, J. V., Pilorz, S. H., and Holben, B. N.: MISR aerosol optical depth retrievals over southern Africa during the safari-2000 dry season campaign, Geophys. Res. Lett., 28, 3127–3130, doi:10.1029/2001gl013188, 2001.
25
ACPD
15, 10773–10812, 2015Improvements in AOD retrieval from
geostationary measurements
M. Kim et al.
Title Page
Abstract Introduction
Conclusions References
Tables Figures
◭ ◮
◭ ◮
Back Close
Full Screen / Esc
Printer-friendly Version
Interactive Discussion
Discussion
P
a
per
|
Discussion
P
a
per
|
Discussion
P
a
per
|
Discussion
P
a
per
|
Dubovik, O., Smirnov, A., Holben, B. N., King, M. D., Kaufman, Y. J., Eck, T. F., and Slutsker, I.: Accuracy assessments of aerosol optical properties retrieved from Aerosol Robotic Network (AERONET) Sun and sky radiance measurements, J. Geophys. Res.-Atmos., 105, 9791– 9806, doi:10.1029/2000jd900040, 2000.
Dubovik, O., Holben, B., Eck, T. F., Smirnov, A., Kaufman, Y. J., King, M. D., Tanre, D.,
5
and Slutsker, I.: Variability of absorption and optical properties of key aerosol types observed in worldwide locations, J. Atmos. Sci., 59, 590–608, doi:10.1175/1520-0469(2002)059<0590:VOAAOP>2.0.Co;2, 2002.
Eck, T. F., Holben, B. N., Reid, J. S., Dubovik, O., Smirnov, A., O’Neill, N. T., Slutsker, I., and Kinne, S.: Wavelength dependence of the optical depth of biomass
10
burning, urban, and desert dust aerosols, J. Geophys. Res.-Atmos., 104, 31333–31349, doi:10.1029/1999jd900923, 1999.
Fraser, R. S. and Kaufman, Y. J.: The relative importance of aerosol scattering and absorption in remote-sensing, IEEE T. Geosci. Remote, 23, 625–633, doi:10.1109/tgrs.1985.289380, 1985.
15
Higurashi, A. and Nakajima, T.: Development of a two-channel aerosol retrieval algorithm on a global scale using NOAA AVHRR, J. Atmos. Sci., 56, 924–941, doi:10.1175/1520-0469(1999)056<0924:DOATCA>2.0.CO;2, 1999.
Holben, B. N., Eck, T. F., Slutsker, I., Tanre, D., Buis, J. P., Setzer, A., Vermote, E., Reagan, J. A., Kaufman, Y. J., Nakajima, T., Lavenu, F., Jankowiak, I., and Smirnov, A.: Aeronet – a
feder-20
ated instrument network and data archive for aerosol characterization, Remote Sens. Envi-ron., 66, 1–16, doi:10.1016/S0034-4257(98)00031-5, 1998.
Holben, B. N., Tanre, D., Smirnov, A., Eck, T. F., Slutsker, I., Abuhassan, N., Newcomb, W. W., Schafer, J. S., Chatenet, B., Lavenu, F., Kaufman, Y. J., Castle, J. V., Setzer, A., Markham, B., Clark, D., Frouin, R., Halthore, R., Karneli, A., O’Neill, N. T., Pietras, C., Pinker, R. T., Voss, K.,
25
and Zibordi, G.: An emerging ground-based aerosol climatology: aerosol optical depth from AERONET, J. Geophys. Res.-Atmos., 106, 12067–12097, doi:10.1029/2001jd900014, 2001. Hsu, N. C., Tsay, S. C., King, M. D., and Herman, J. R.: Aerosol properties over bright-reflecting
source regions, IEEE T. Geosci. Remote, 42, 557–569, doi:10.1109/tgrs.2004.824067, 2004.
30
ACPD
15, 10773–10812, 2015Improvements in AOD retrieval from
geostationary measurements
M. Kim et al.
Title Page
Abstract Introduction
Conclusions References
Tables Figures
◭ ◮
◭ ◮
Back Close
Full Screen / Esc
Printer-friendly Version
Interactive Discussion
Discussion
P
a
per
|
Discussion
P
a
per
|
Discussion
P
a
per
|
Discussion
P
a
per
|
spectroradiometer, J. Geophys. Res.-Atmos., 102, 17051–17067, doi:10.1029/96jd03988, 1997.
Kim, J., Lee, J., Lee, H. C., Higurashi, A., Takemura, T., and Song, C. H.: Consistency of the aerosol type classification from satellite remote sensing during the atmospheric brown cloud-east Asia regional experiment campaign, J. Geophys. Res.-Atmos., 112, D22S33,
5
doi:10.1029/2006jd008201, 2007.
Kim, J., Yoon, J. M., Ahn, M. H., Sohn, B. J., and Lim, H. S.: Retrieving aerosol optical depth using visible and mid-IR channels from geostationary satellite MTSAT-1R, Int. J. Remote Sens., 29, 6181–6192, doi:10.1080/01431160802175553, 2008.
Kim, M., Kim, J., Wong, M. S., Yoon, J., Lee, J., Wu, D., Chan, P. W., Nichol, J. E., Chung,
C.-10
Y. C., and Ou, M.-L.: Improvement of aerosol optical depth retrieval over Hong Kong from a geostationary meteorological satellite using critical reflectance with background optical depth correction, Remote Sens. Environ., 142, 176–187, 2014.
Knapp, K. R., Vonder Haar, T. H., and Kaufman, Y. J.: Aerosol optical depth retrieval from goes-8: Uncertainty study and retrieval validation over South America, J. Geophys. Res.-Atmos.,
15
107, 4055, doi:10.1029/2001jd000505, 2002.
Knapp, K. R., Frouin, R., Kondragunta, S., and Prados, A.: Toward aerosol optical depth re-trievals over land from GOES visible radiances: determining surface reflectance, Int. J. Re-mote Sens., 26, 4097–4116, 2005.
Kotchenova, S. Y. and Vermote, E. F.: Validation of a vector version of the 6S radiative
trans-20
fer code for atmospheric correction of satellite data. Part ii. Homogeneous Lambertian and anisotropic surfaces, Appl. Optics, 46, 4455–4464, doi:10.1364/Ao.46.004455, 2007. Kotchenova, S. Y., Vermote, E. F., Matarrese, R., and Klemm, F. J.: Validation of a vector version
of the 6S radiative transfer code for atmospheric correction of satellite data. Part i: Path radiance, Appl. Optics, 45, 6762–6774, doi:10.1364/Ao.45.006762, 2006.
25
Lee, J., Kim, J., Song, C. H., Ryu, J. H., Ahn, Y. H., and Song, C. K.: Algorithm for retrieval of aerosol optical properties over the ocean from the geostationary ocean color imager, Remote Sens. Environ., 114, 1077–1088, doi:10.1016/j.rse.2009.12.021, 2010.
Lee, J., Kim, J., Yang, P., and Hsu, N. C.: Improvement of aerosol optical depth retrieval from MODIS spectral reflectance over the global ocean using new aerosol models archived from
30
ACPD
15, 10773–10812, 2015Improvements in AOD retrieval from
geostationary measurements
M. Kim et al.
Title Page
Abstract Introduction
Conclusions References
Tables Figures
◭ ◮
◭ ◮
Back Close
Full Screen / Esc
Printer-friendly Version
Interactive Discussion
Discussion
P
a
per
|
Discussion
P
a
per
|
Discussion
P
a
per
|
Discussion
P
a
per
|
Levy, R. C., Remer, L. A., Mattoo, S., Vermote, E. F., and Kaufman, Y. J.: Second-generation operational algorithm: retrieval of aerosol properties over land from inversion of moderate resolution imaging spectroradiometer spectral reflectance, J. Geophys. Res.-Atmos., 112, D13211, doi:10.1029/2006jd007811, 2007.
Levy, R. C., Remer, L. A., Kleidman, R. G., Mattoo, S., Ichoku, C., Kahn, R., and Eck, T. F.:
5
Global evaluation of the Collection 5 MODIS dark-target aerosol products over land, Atmos. Chem. Phys., 10, 10399–10420, doi:10.5194/acp-10-10399-2010, 2010.
Lyapustin, A., Smirnov, A., Holben, B., Chin, M., Streets, D. G., Lu, Z., Kahn, R., Slutsker, I., Laszlo, I., Kondragunta, S., Tanre, D., Dubovik, O., Goloub, P., Chen, H. B., Sinyuk, A., Wang, Y., and Korkin, S.: Reduction of aerosol absorption in Beijing since 2007 from MODIS
10
and AERONET, Geophys. Res. Lett., 38, L10803, doi:10.1029/2011gl047306, 2011a. Lyapustin, A., Wang, Y., Laszlo, I., Kahn, R., Korkin, S., Remer, L., Levy, R., and Reid, J. S.:
Multiangle implementation of atmospheric correction (MAIAC): 2. Aerosol algorithm, J. Geo-phys. Res.-Atmos., 116, D03211, doi:10.1029/2010jd014986, 2011b.
Mishchenko, M. I., Geogdzhayev, I. V., Cairns, B., Rossow, W. B., and Lacis, A. A.: Aerosol
15
retrievals over the ocean by use of channels 1 and 2 AVHRR data: sensitivity analysis and preliminary results, Appl. Optics, 38, 7325–7341, doi:10.1364/Ao.38.007325, 1999.
Pope, C. A. and Dockery, D. W.: Health effects of fine particulate air pollution: lines that connect, J. Air Waste Manage., 56, 709–742, 2006.
Remer, L. A., Kaufman, Y. J., Tanre, D., Mattoo, S., Chu, D. A., Martins, J. V., Li, R. R.,
20
Ichoku, C., Levy, R. C., Kleidman, R. G., Eck, T. F., Vermote, E., and Holben, B. N.: The MODIS aerosol algorithm, products, and validation, J. Atmos. Sci., 62, 947–973, doi:10.1175/Jas3385.1, 2005.
Smirnov, A., Holben, B. N., Eck, T. F., Dubovik, O., and Slutsker, I.: Cloud-screening and qual-ity control algorithms for the AERONET database, Remote Sens. Environ., 73, 337–349,
25
doi:10.1016/S0034-4257(00)00109-7, 2000.
Stocker, T. F., Qin, D., Plattner, G.-K., Tignor, M., Allen, S. K., Boschung, J., Nauels, A., Xia, Y., Bex, V., and Midgley, P. M.: Climate change 2013: The physical science basis, Intergovern-mental Panel on Climate Change, Working Group I Contribution to the IPCC Fifth Assess-ment Report (AR5), Cambridge. Univ. Press., New York, 2013.
30
ACPD
15, 10773–10812, 2015Improvements in AOD retrieval from
geostationary measurements
M. Kim et al.
Title Page
Abstract Introduction
Conclusions References
Tables Figures
◭ ◮
◭ ◮
Back Close
Full Screen / Esc
Printer-friendly Version
Interactive Discussion
Discussion
P
a
per
|
Discussion
P
a
per
|
Discussion
P
a
per
|
Discussion
P
a
per
|
Taylor, K. E.: Summarizing multiple aspects of model performance in a single diagram., J. Geophys. Res.-Atmos., 106, 7183–7192, doi:10.1029/2000jd900719, 2001.
Torres, O., Bhartia, P. K., Herman, J. R., Ahmad, Z., and Gleason, J.: Derivation of aerosol prop-erties from satellite measurements of backscattered ultraviolet radiation: theoretical basis, J. Geophys. Res.-Atmos., 103, 23321–23321, 1998.
5
Torres, O., Tanskanen, A., Veihelmann, B., Ahn, C., Braak, R., Bhartia, P. K., Veefkind, P., and Levelt, P.: Aerosols and surface UV products from ozone monitoring instrument observations: an overview, J. Geophys. Res.-Atmos., 112, D24S47, doi:10.1029/2007jd008809, 2007. Urm, Y. D. and Sohn, B. J.: Estimation of aerosol optical thickness over East Asia using GMS-5
visible channel measurements, J. Atmos., 15, 203–211, 2005.
10
Vermote, E. F., Tanre, D., Deuze, J. L., Herman, M., and Morcrette, J. J.: Second simulation of the satellite signal in the solar spectrum, 6S: an overview, IEEE T. Geosci. Remote, 35, 675–686, doi:10.1109/36.581987, 1997.
von Hoyningen-Huene, W., Freitag, M., and Burrows, J. B.: Retrieval of aerosol optical thickness over land surfaces from top-of-atmosphere radiance, J. Geophys. Res.-Atmos., 108, 4260,
15
doi:10.1029/2001jd002018, 2003.
Wang, J., Christopher, S. A., Brechtel, F., Kim, J., Schmid, B., Redemann, J., Russell, P. B., Quinn, P., and Holben, B. N.: Geostationary satellite retrievals of aerosol optical thickness during ACE-Asia, J. Geophys. Res.-Atmos., 108, 8657, doi:10.1029/2003jd003580, 2003. Wong, M. S., Lee, K. H., Nichol, J. E., and Li, Z. Q.: Retrieval of aerosol optical thickness using
20
MODIS 500×500 m2, a study in Hong Kong and the pearl river delta region, IEEE T. Geosci.
Remote, 48, 3318–3327, doi:10.1109/tgrs.2010.2045124, 2010.
Yang, P., Feng, Q., Hong, G., Kattawar, G. W., Wiscombe, W. J., Mishchenko, M. I., Dubovik, O., Laszlo, I., and Sokolik, I. N.: Modeling of the scattering and radiative properties of nonspher-ical dust-like aerosols, J. Aerosol Sci., 38, 995–1014, doi:10.1016/j.jaerosci.2007.07.001,
25
2007.
Yoon, J.-M.: Effects of atmospheric and surface properties on the retrieval of AOD from geo-stationary satellite, PhD Thesis, Department of Atmospheric Scinces, Yonsei Univ, Seoul, Republic of Korea, 2006.
Yoon, J. M., Kim, J., Lee, J. H., Cho, H. K., Sohn, B. J., and Ahn, M. A.: Retrieved of aerosol
30
ACPD
15, 10773–10812, 2015Improvements in AOD retrieval from
geostationary measurements
M. Kim et al.
Title Page
Abstract Introduction
Conclusions References
Tables Figures
◭ ◮
◭ ◮
Back Close
Full Screen / Esc
Printer-friendly Version
Interactive Discussion
Discussion
P
a
per
|
Discussion
P
a
per
|
Discussion
P
a
per
|
Discussion
P
a
per
|
Zhang, H., Lyapustin, A., Wang, Y., Kondragunta, S., Laszlo, I., Ciren, P., and Hoff, R. M.: A multi-angle aerosol optical depth retrieval algorithm for geostationary satellite data over the United States, Atmos. Chem. Phys., 11, 11977–11991, doi:10.5194/acp-11-11977-2011, 2011.
Zhang, J. L., Christopher, S. A., and Holben, B. N.: Intercomparison of smoke aerosol optical
5
ACPD
15, 10773–10812, 2015Improvements in AOD retrieval from
geostationary measurements
M. Kim et al.
Title Page
Abstract Introduction
Conclusions References
Tables Figures
◭ ◮
◭ ◮
Back Close
Full Screen / Esc
Printer-friendly Version
Interactive Discussion
Discussion
P
a
per
|
Discussion
P
a
per
|
Discussion
P
a
per
|
Discussion
P
a
per
|
Table 1.Summary of AERONET sites used in this study. Columns “Period” represent the re-trieval period of the daily inversion product (level 2.0), and the longitude (long.,◦E) and latitude
(lat.,◦N) show the location for each site. The number in front of the site name lists the sites
operated for the DRAGON-Asia campaign, where “D” is the initial of the campaign. The num-bers are linked to Table 4, Table 5, and Fig. 9. The color and type of character categorizes the inversion dataset into the “original”, “new”, and “excepted” groups. While the “original” group is compiled from the inversion datasets obtained before 2011 at sites in italic type, the “new” group consists of the total dataset excluding the “excepted” group shown in bold type.
Site Long. Lat. Period Site Long. Lat. Period
(1) Baengnyeong 124.63 37.97 2010–2013 (36) Osaka 135.59 34.65 2001–2013 (2) Chiba_University 140.1 35.63 2011–2012 (37) Seoul_SNU 126.95 37.46 2000–2013 (3) D_Anmyeon 126.33 36.54 DRAGON2012 (38) Shirahama 135.36 33.69 2000–2013 (4) D_Bokjeong 127.13 37.46 DRAGON2012 (39) Yonsei_University 126.93 37.56 2011–2013
(5) D_Fukue 128.68 32.75 DRAGON2012 Anmyon 126.33 36.54 1999–2007
(6) D_Fukue_2 128.82 32.67 DRAGON2012 Bac_Giang 106.23 21.29 2003–2009
(7) D_Fukuoka 130.48 33.52 DRAGON2012 Bach_Long_Vy 107.73 20.13 2010–2011
(8) D_GangneungWNU 128.87 37.77 DRAGON2012 Beijing 116.38 39.98 2001–2013
(9) D_Guwol 126.72 37.45 DRAGON2012 Chen-Kung_Univ 120.22 23 2002–2012
(10) D_Hankuk_UFS 127.27 37.34 DRAGON2012 Dongsha_Island 116.73 20.7 2004–2013
(11) D_Kobe 135.29 34.72 DRAGON2012 EPA-NCU 121.19 24.97 2006–2013 (12) D_Kohriyama 140.38 37.36 DRAGON2012 Hangzhou-ZFU 119.73 30.26 2007–2007 (13) D_Kongju_NU 127.14 36.47 DRAGON2012 Hefei 117.16 31.91 2005–2008 (14) D_Konkuk_Univ 127.08 37.54 DRAGON2012 Hong_Kong_Hok_Tsui 14.26 22.21 2007–2010
(15) D_Korea_Univ 127.03 37.58 DRAGON2012 Hong_Kong_PolyU 114.18 22.3 2005–2013
(16) D_Kunsan_NU 126.68 35.94 DRAGON2012 Inner_Mongolia 115.95 42.68 2001–2001 (17) D_Kyoto 135.78 35.03 DRAGON2012 Jingtai 104.1 37.33 2008–2008
(18) D_Kyungil_Univ 128.82 36.07 DRAGON2012 Lanzhou_City 103.85 36.05 2009–2010
(19) D_Matsue 133.01 35.48 DRAGON2012 Liangning 122.7 41.51 2005–2005
(20) D_Mokpo_NU 126.44 34.91 DRAGON2012 Luang_Namtha 101.42 20.93 2012–2014
(21) D_Mt_Ikoma 135.68 34.68 DRAGON2012 Lulin 120.87 23.47 2007–2014
(22) D_Mt_Rokko 135.23 34.76 DRAGON2012 Minqin 102.96 38.61 2010–2010
(23) D_NIER 126.64 37.57 DRAGON2012 NGHIA_DO 105.8 21.05 2010–2013 (24) D_Nara 135.83 34.69 DRAGON2012 PKU_PEK 116.18 39.59 2006–2008 (25) D_Nishiharima 134.34 35.03 DRAGON2012 SACOL 104.14 35.95 2006–2012 (26) D_Osaka-North 135.51 34.77 DRAGON2012 Shouxian 116.78 32.56 2008–2008 (27) D_Osaka-South 135.5 34.54 DRAGON2012 Taichung 120.49 24.11 2005–2005 (28) D_Pusan_NU 129.08 35.24 DRAGON2012 Taihu 120.22 31.42 2005–2012 (29) D_Sanggye 127.07 37.66 DRAGON2012 Taipei_CWB 121.5 25.03 2002–2013
(30) D_Sinjeong 126.86 37.52 DRAGON2012 Ussuriysk 132.16 43.7 2004–2013
(31) D_Soha 126.89 37.45 DRAGON2012 XiangHe 116.96 39.75 2001–2012 (32) D_Tsukuba 140.12 36.05 DRAGON2012 Xinglong 117.58 40.4 2006–2012
(33) Gosan_SNU 126.16 33.29 2001–2013 Yufa_PEK 116.18 39.31 2006–2006
(34) Gwangju_GIST 126.84 35.23 2004–2012 Zhangye 100.28 39.08 2008–2008


![Table 4. Summary statistics of the comparison between the MI AOD [550 nm] retrieved with the original LUT and AERONET AOD [550 nm]](https://thumb-eu.123doks.com/thumbv2/123dok_br/17165723.240966/30.918.158.547.113.619/table-summary-statistics-comparison-aod-retrieved-original-aeronet.webp)
![Table 5. Summary statistics of the comparison between the MI AOD [550 nm] retrieved with the updated LUT and AERONET AOD [550 nm]](https://thumb-eu.123doks.com/thumbv2/123dok_br/17165723.240966/31.918.157.546.113.619/table-summary-statistics-comparison-aod-retrieved-updated-aeronet.webp)