ACPD
12, 17703–17721, 2012Lifetime and production rate of
NOx F. Friederich et al.
Title Page
Abstract Introduction
Conclusions References
Tables Figures
◭ ◮
◭ ◮
Back Close
Full Screen / Esc
Printer-friendly Version
Interactive Discussion
Discussion
P
a
per
|
Dis
cussion
P
a
per
|
Discussion
P
a
per
|
Discussio
n
P
a
per
|
Atmos. Chem. Phys. Discuss., 12, 17703–17721, 2012 www.atmos-chem-phys-discuss.net/12/17703/2012/ doi:10.5194/acpd-12-17703-2012
© Author(s) 2012. CC Attribution 3.0 License.
Atmospheric Chemistry and Physics Discussions
This discussion paper is/has been under review for the journal Atmospheric Chemistry and Physics (ACP). Please refer to the corresponding final paper in ACP if available.
Lifetime and production rate of NO
x
in the
upper stratosphere and lower
mesosphere in the polar spring/summer
after the solar proton event in
October–November 2003
F. Friederich1, T. von Clarmann1, B. Funke2, H. Nieder1, J. Orphal1, M. Sinnhuber1, G. P. Stiller1, and J. M. Wissing3
1
Karlsruhe Institute of Technology, Institute for Meteorology and Climate Research, Karlsruhe, Germany
2
Instituto de Astrof´ısica de Andaluc´ıa, CSIC, Granada, Spain
3
FB Physik, University of Osnabr ¨uck, Osnabr ¨uck, Germany
Received: 22 May 2012 – Accepted: 26 June 2012 – Published: 18 July 2012
Correspondence to: F. Friederich ([email protected])
Published by Copernicus Publications on behalf of the European Geosciences Union.
ACPD
12, 17703–17721, 2012Lifetime and production rate of
NOx F. Friederich et al.
Title Page
Abstract Introduction
Conclusions References
Tables Figures
◭ ◮
◭ ◮
Back Close
Full Screen / Esc
Printer-friendly Version
Interactive Discussion
Discussion
P
a
per
|
Dis
cussion
P
a
per
|
Discussion
P
a
per
|
Discussio
n
P
a
per
|
Abstract
We present altitude dependent lifetimes of NOx, determined with MIPAS/ENVISAT, for
the southern polar region after the solar proton event in October–November 2003. Varying in latitude and decreasing in altitude they range from about two days at 64 km to about 20 days at 44 km. The lifetimes are controlled by transport, mixing and
photol-5
ysis. We infer dynamical lifetimes by comparison of the observed decay to photolytical lifetimes calculated with the SLIMCAT 3-D Model. Photochemical loss contributes to the observed NOxdepletion by 10 % at 44 km, increasing with altitude to 35 % at 62 km
at a latitude of –63◦S. At higher latitudes, the contribution of photochemical loss can be even more important.
10
In addition, we show the correlation of modeled ionization rates and observed NOx densities under consideration of the determined lifetimes of NOx, and calculate altitude
dependent effective production rates of NOx due to ionization. For that we compare
ionization rates of the AIMOS data base with the MIPAS measurements for the whole Austral polar summer 2003/04. We derive effective NOx-production rates to be applied
15
to the AIMOS ionization rates which range from about 0.2 NOx-molecules per ion pair at
44 km to 0.9 NOx-molecules per ion pair at 54 km at a latitude of –63◦S. At –73◦S, the
NOx-production rate ranges from about 0.2 NOx-molecules per ion pair at 44 km to 1.0
NOx-molecules per ion pair at 60 km. These effective production rates are considerably
lower than predicted by box model simulations which could hint at an overestimation of
20
the modeled ionization rates.
1 Introduction
During the maximum of the 11-yr solar magnetic activity cycle, solar flares and coronal mass ejections (CME) are most frequent. During a CME, solar plasma is ejected into space, driving a shock front that can effectively accelerate particles. Propagating along
25
the interplanetary field lines the energetic particles (protons, electrons and a few more
ACPD
12, 17703–17721, 2012Lifetime and production rate of
NOx F. Friederich et al.
Title Page
Abstract Introduction
Conclusions References
Tables Figures
◭ ◮
◭ ◮
Back Close
Full Screen / Esc
Printer-friendly Version
Interactive Discussion
Discussion
P
a
per
|
Dis
cussion
P
a
per
|
Discussion
P
a
per
|
Discussio
n
P
a
per
|
massive ions) may reach the Earth and precipitate – guided by the terrestrial magnetic field – in the polar cap regions where they cause ionization down to∼40 km altitude.
This so-called Solar Proton/Particle Event (SPE) may also be followed by a geomag-netic storm as soon as the CME hits the geomaggeomag-netic field, forcing precipitation of low energetic particles and ionization in the upper atmosphere. Focussing on 42–62 km
5
altitude we will concentrate mostly on the high-energetic particles from the SPE and their follow-ups: excitation, ionization, and dissociation of molecules. These particles have influence on the chemical composition, temperature, and dynamics of the Earth’s atmosphere (e.g. Crutzen et al., 1975; Jackman et al., 2001, 2007).
According to Porter et al. (1976) 1.25 N-atoms are produced by each ion pair,
parti-10
tioned in 0.55 N(4S) and 0.70 N(2D). N(4S) and N(2D) are also produced by
N++O2→O+2+N(4S,2D) (R1)
By the reactions
N(4S)+O2→NO+O (R2)
N(2D)+O2→NO+O (R3)
15
NO is produced. R3 is virtually immediate. Thus, models typically assume a production of NO and N(4S). NO is also produced directly by ionization, i.e. via:
NO++X−→NO+X (R4)
X− denotes negative ions. At sunset NO is converted into NO2below 70 km:
NO+O3→NO2+O2 (R5)
20
which reverts at sunrise to NO by:
NO2+hν→NO+O (R6)
NO can also be dissociated by photolysis:
ACPD
12, 17703–17721, 2012Lifetime and production rate of
NOx F. Friederich et al.
Title Page
Abstract Introduction
Conclusions References
Tables Figures
◭ ◮
◭ ◮
Back Close
Full Screen / Esc
Printer-friendly Version
Interactive Discussion
Discussion
P
a
per
|
Dis
cussion
P
a
per
|
Discussion
P
a
per
|
Discussio
n
P
a
per
|
The predominant process of decomposition of NOx(N, NO, NO2) is:
N(4S)+NO→N2+O, (R8)
which occurs in the stratosphere and lower mesosphere during the daytime because N(4S) is produced by photolysis, in competition to Reaction (R2).
The impact of the so-called Halloween SPE on NOx in October–November 2003
5
has been investigated in a few studies (Sepp ¨al ¨a et al., 2004, 2007; Jackman et al., 2005; L ´opez-Puertas et al., 2005; Baumgaertner et al., 2010; Funke et al., 2011). The lifetime of NOx is typically a few days at altitudes from 44 km to 64 km (Brasseur and Solomon, 2005). So the multitude of MIPAS/ENVISAT measurements per day allows to determine the lifetime of NOxin the middle atmosphere impacted by a SPE. We analyze
10
these lifetimes in a first step (Sect. 3.1). With these altitude and latitude dependent lifetimes available, the dependence of the NOx production on the ion production rate
is estimated (Sect. 3.2). Since the downward transport of upper atmospheric air into the upper stratosphere and lower mesosphere has a huge impact on NOx in the winter hemisphere, data of the Southern Hemisphere is analyzed (Siskind and Russell, 1996;
15
Funke et al., 2005b; Randall et al., 2007). We compare our results to different studies which have also estimated the ion production rate in Sect. 4.
Ionization rates are provided by the Atmospheric Ionization Module Osnabr ¨uck (AIMOS). Data of MIPAS are described in Sect. 2.1, AIMOS is described in Sect. 2.2. Data analysis is shown in Sect. 3.
20
2 Used data
In this section, we describe the data used for this study. Mixing ratios of NO and NO2
are retrieved from spectra of MIPAS (Sect. 2.1) and the 3-D model AIMOS is used to get ionization rates (Sect. 2.2).
ACPD
12, 17703–17721, 2012Lifetime and production rate of
NOx F. Friederich et al.
Title Page
Abstract Introduction
Conclusions References
Tables Figures
◭ ◮
◭ ◮
Back Close
Full Screen / Esc
Printer-friendly Version
Interactive Discussion
Discussion
P
a
per
|
Dis
cussion
P
a
per
|
Discussion
P
a
per
|
Discussio
n
P
a
per
|
2.1 MIPAS/ENVISAT
The Michelson Interferometer for Passive Atmospheric Sounding (MIPAS, Fischer et al., 2008) on the European Environment Satellite (ENVISAT) has recorded emis-sion limb spectra since 2002. ENVISAT has a sun-synchronous orbit with an inclination of 98◦ at an altitude of about 800 km (783 km since 2010). All latitudes up to ±90◦ 5
can be observed both at day and at night at about 10 a.m. and 10 p.m. local time, re-spectively. We use NOx-data of the nominal measurement mode (Funke et al., 2005a),
which covers altitudes from 6 km–68 km. MIPAS records limb emission spectra in the infrared wave range (4.1 µm–14.7 µm). The NO fundamental band at 5.3 µm and the NO2 fundamental ν3 band at 6.2 µm are used to determine the volume mixing ratio
10
(vmr) profiles of NO and NO2. Additional quantities available from the retrieval for each
geolocation are the temperatureT [K], the pressurep [hPa], volume mixing ratio and the averaging kernel (avk).
We used version V3O NO 14 and V3O NO2 13/14 which has substantially improved with respect to the retrieval setup described in Funke et al. (2005a) by (i) the use of
15
log(vmr) instead of vmr in the retrieval vector, (ii) a revised correction scheme for line of sight variations of the NOx partitioning close to the terminator, and (iii) joint-fitted vmr
horizontal gradients at constant longitudes and latitudes.
In the analysis, we average vmr and the number density n over time and latitude bands. We only take vmr and n into account, when the arithmetic mean of the avk
20
diagonal elements avd is greater than 0.03.
2.2 AIMOS
The Atmospheric Ionization Module Osnabr ¨uck, (AIMOS, Wissing and Kallenrode, 2009) is a 3-D model, which determines the atmospheric ionization caused by pro-tons, electrons, and alpha particles. It is based on flux measurements of GOES
(Geo-25
stationary Operational Environmental Satellite) and POES (Polar Operational Environ-mental Satellite) covering an energy range of 150 eV to 500 MeV for protons, 4 MeV to
ACPD
12, 17703–17721, 2012Lifetime and production rate of
NOx F. Friederich et al.
Title Page
Abstract Introduction
Conclusions References
Tables Figures
◭ ◮
◭ ◮
Back Close
Full Screen / Esc
Printer-friendly Version
Interactive Discussion
Discussion
P
a
per
|
Dis
cussion
P
a
per
|
Discussion
P
a
per
|
Discussio
n
P
a
per
|
500 MeV for alpha particles, and 150 eV to 2.5 MeV for electrons. In addition, the en-ergy range of the electrons is extrapolated to 5 MeV. AIMOS provides ionization rates from 2002 until 2010, which depend on altitude, latitude and longitude. The spatial res-olution is 3.6◦×3.6◦with 67 pressure levels, ranging from 105Pa to 1.7×10⁻⁵Pa. The
temporal resolution is two hours. The unit of the ionization rates is IPP cm−3
s−1
, IPP
5
denotes ion pair production.
3 Data analysis
This section presents the procedure of the data analysis used for our investigation. The determinations of the lifetimes and the dependence of NOx on the ion pair production
(IPP) are shown in Sects. 3.1 and 3.2, respectively.
10
3.1 Lifetime of NOx
The SPE in October–November 2003 induced a large increase of the NOx vmr in
po-lar latitudes above∼45 km which was observed, e.g. by MIPAS on ENVISAT (L
´opez-Puertas et al., 2005). The volume mixing ratio of NOx has its maximum on 30 October. Subsequently, there is a decrease lasting for four days. We average MIPAS data of
15
each retrieved altitude separately (42 km, 43 km, 44 km, 45 km, 46 km, 47 km, 48 km, 49 km, 50 km, 52 km, 54 km, 56 km, 58 km, 60 km, 62 km, and 64 km) and within latitude bins (±4◦) over a time-period of six hours to get a smoothed vmr gradient. Then we fit
an exponential function
vmr(t)=vmr(t0)·exp
−t−t0
τ
+const. (1)
20
to the data after the maximum of vmr. t0 denotes the time of the maximum of vmr.
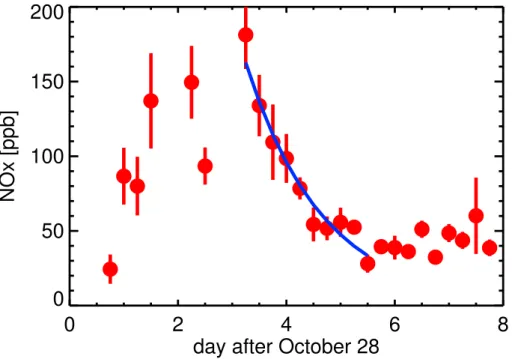
τ is the lifetime of NOx, which depends on latitude and altitude. Consequently, the fit has three degrees of freedom (vmr(t0),τ, const). Figure 1 shows 6 h-averaged MIPAS
ACPD
12, 17703–17721, 2012Lifetime and production rate of
NOx F. Friederich et al.
Title Page
Abstract Introduction
Conclusions References
Tables Figures
◭ ◮
◭ ◮
Back Close
Full Screen / Esc
Printer-friendly Version
Interactive Discussion
Discussion
P
a
per
|
Dis
cussion
P
a
per
|
Discussion
P
a
per
|
Discussio
n
P
a
per
|
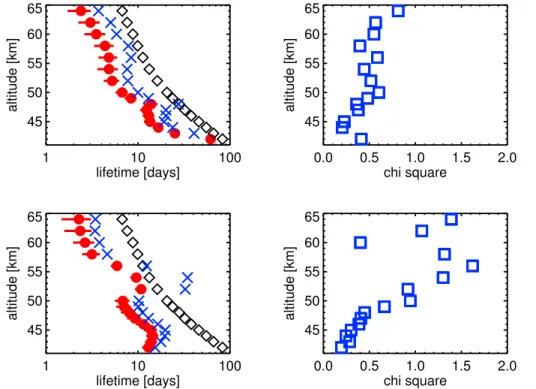
measurements with the standard error of the mean (error bars) at an altitude of 62 km and at a latitude of −73◦±4◦. The exponential fit to the data vmr(t) is computed by weighting each value with its inverse variance. τ and the 1σ-range of τ are shown in Fig. 2 (left) for all altitudes at latitudes of −63◦±4◦ (top) and −73◦±4◦ (bottom).
The corresponding reducedχ2values between measurement and fit are shown on the
5
right. They vary between 0 and 1.5.χ2 values lower than one show on the one hand that the assumption of an exponential decay is reasonable. On the other hand they are an evidence that the standard error of the mean is overestimated by using the familiar estimator function (Toohey et al., 2011). The higherχ2becomes the more likely the fit is outside the error bars of some values.
10
The lifetime as calculated from MIPAS data depends on the altitude- and latitude-dependent photolysis rate and on a dynamic part due to horizontal transport and mix-ing. Vertical advection is small in polar summer. Horizontal transport and mixing are responsible for a distribution of NOxtowards latitudes outside the polar cap. In our ide-alized assumption, the source of NOxis inside the polar caps due to the SPE and there
15
is no NOxenhancement outside the polar caps nor any important NOxproduction
dur-ing the three days after the SPE. So we can assume an exponential decay not only for the loss due to photolysis but also for dilution due to dynamics. The following relation applies to the combined lifetime:
1
τ =
1
τphot +
1
τdyn. (2)
20
The photolytic lifetimesτphot have been calculated by the SLIMCAT 3-D Model (Chip-perfield, 1999) for the corresponding time and geolocations of the observations. The lifetime τ, the photolytic lifetime τphot, and the dynamic lifetime τdyn are displayed in Fig. 2 (left) depending on the altitude at latitudes of−63◦±4◦(top) and−73◦±4◦
(bot-tom). The lifetimesτ,τphot, andτdyn decrease with increasing altitude. At a latitude of
25
−63◦±4◦ and at 44 km τ is 16.6±5.0 days and it decreases to the highest analyzed
altitude at 64 km where it is only 2.4±0.5 days. At a latitude of−73◦±4◦and at 44 km
ACPD
12, 17703–17721, 2012Lifetime and production rate of
NOx F. Friederich et al.
Title Page
Abstract Introduction
Conclusions References
Tables Figures
◭ ◮
◭ ◮
Back Close
Full Screen / Esc
Printer-friendly Version
Interactive Discussion
Discussion
P
a
per
|
Dis
cussion
P
a
per
|
Discussion
P
a
per
|
Discussio
n
P
a
per
|
τis 14.4±5.0 days and it decreases to the highest analyzed altitude at 64 km where it
is only 2.3±0.6 days. The errors specify the 1σ-range.
The photochemical loss becomes more important with increasing altitude. At a lati-tude of−63◦±4◦ and at an altitude of 44 km the photolysis rateJ=τphot1 is 10 % of
1 τ,
at 62 kmJ is already at 35 %. At a latitude of−73◦±4◦, photolysis is the main process 5
between the altitude range of 49 km and 54 km.
3.2 Dependence of NOxon ion pair production
With estimates of NOxlifetimes available we can now analyze the relation between the
number densitynof NOx and the ion production rate due to the particle precipitation.
nis calculated from the retrieved quantities T,p, and vmr. It is intended to reproduce
10
a dependence ofn on ion pair production. First we should mention, that polar winter descent of thermospheric air entails a limitation in analyzing data in the winter hemi-sphere. That air intrudes in the mesosphere and elevates the vmr of NOxabout some
orders of magnitude through the EEP Indirect Effect (Siskind and Russell, 1996; Funke et al., 2005b; Randall et al., 2007). Smaller enhancements due to the SPE impact
can-15
not be easily distinguished from the descending NOx-rich air masses. Therefore we do
not analyze the northern winter hemisphere.
Considering that, data of MIPAS measurements of southern polar latitudes of the Austral summer 2003/04 are used at altitudes from 44 km to 62 km. The number density is averaged every 6 h over 24 h. There should be a dependence of the enhancement
20
of the NOx-number density to the ion production rate, because of NOx-production due
to ionization. In addition, the temporal evolution of NOx is modulated by the lifetime
τ of a NOx-molecule. In the following, the production of NOx due to ionization will be
described using MIPAS data. The difference of the number density of NOx affected
by ion pair production (IPP) due to energetic partical precipitation n(IPP,t0) and the
25
backround number densityn(IPP=0,t0) without particle precipitation at the timet0is:
∆nMIPAS(t0)=n(IPP,t0)−n(IPP=0,t0). (3)
ACPD
12, 17703–17721, 2012Lifetime and production rate of
NOx F. Friederich et al.
Title Page
Abstract Introduction
Conclusions References
Tables Figures
◭ ◮
◭ ◮
Back Close
Full Screen / Esc
Printer-friendly Version
Interactive Discussion
Discussion
P
a
per
|
Dis
cussion
P
a
per
|
Discussion
P
a
per
|
Discussio
n
P
a
per
|
Consequently,∆nMIPAS(t0) denotes the enhancement ofndue to IPP.n(IPP,t0) can be determined by analyzing MIPAS data.n(IPP=0,t0) is determined by means of a poly-nomial function, fitted to the MIPAS data of the Austral summer 2003/04. Bothn(IPP,t0) andn(IPP=0,t0) are shown in Fig. 3 (left) as crosses (the color code is time depen-dent) and as a green graph, respectively, for a latitude of−73◦±4◦and at an altitude of 5
56 km.
The enhancement of the number density of NOx at the time t0 can also be deter-mined theoretically by assuming a production rate of 1.25 NOx
ion pair−1. The time
depen-dence of∆ntheorycan thus be determined as below:
∆ntheory(t0)=1.25·
t0
Z
−∞
IPP(t)·e−
t0−t
τ dt. (4)
10
This equation describes the NOx enhancement ∆ntheory at any timet0 as the
accu-mulated surviving part of NOx production. The AIMOS database (Sect. 2.2) provides IPP(t),τwas determined in Sect. 3.1. The integral is signified by
I(IPP,τ,t0)=
t0
Z
−∞
IPP(t)·e−
t0−t
τ dt. (5)
In Fig. 3 (right),∆nMIPAS(t0) is plotted overI(IPP,τ,t0) at a latitude of−73◦±4◦and at an 15
altitude of 56 km. It reveals, as expected, that∆nMIPAS(t0) increases with I(IPP,τ,t0). Up to the the valueI=5×10⁷d·cm1 3 it seems that there are two branches. The branch
at which the gradient is observable is caused by the SPE and the subsequent de-crease of n. The lower branch represents the other days, especially the day before the SPE (yellow crosses). At these days the ion pair production inreases,ndoes not,
20
however. This means that AIMOS shows enhanced ionization rates on 28 October, but MIPAS does not show enhanced NOxvolume mixing ratios. There is another noticeable
ACPD
12, 17703–17721, 2012Lifetime and production rate of
NOx F. Friederich et al.
Title Page
Abstract Introduction
Conclusions References
Tables Figures
◭ ◮
◭ ◮
Back Close
Full Screen / Esc
Printer-friendly Version
Interactive Discussion
Discussion
P
a
per
|
Dis
cussion
P
a
per
|
Discussion
P
a
per
|
Discussio
n
P
a
per
|
discrepancy regarding the NOx-enhancement after 20 November. Either the effective production rate of NOx is higher under the certain conditions of the 20 November or
there is a disagreement between the two data sets. The red curve represents the theo-retical trend with an effective NOx-production rate of 1.25. The green curve represents the relation described by Eq. (4) with a scalarx replacing the theoretical value of 1.25
5
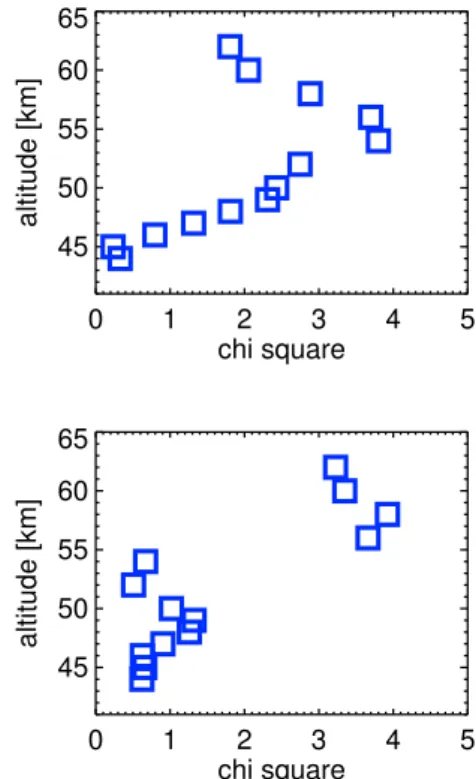
which has been fitted to the distribution.xis the empirically determined production rate of NOx per ion pair and is altitude dependent. These altitude dependent production rates are shown in Fig. 4 (left). The green error bars show the 1-σ uncertainties of the empirically determined NOx production rates per ion pair x. The altitude
depen-dentχ2 value of the fits is shown in the right-hand figures. Most of the χ2 values are
10
significantly larger than one and so they argue for a non-linear NOx-production. The NOx-production rate is significantly lower than 1.25 at all altitudes. This is obvious,
be-cause N(4S) not only produces NO (Reaction R2) but also destroys NO (Reaction R8). The black and red curves represent theoretical values of the effective NOx-production rate and are explained in Sect. 4.3.
15
4 Comparison with previous model studies
Hereafter, the results from Sect. 3.2 are compared with different model studies, cited in the title of each subsection.
4.1 Jackman et al. (2005)
Jackman et al. (2005) used the Goddard Space Flight Center (GSFC) 2-D atmospheric
20
model and measurements of the Halogen Occultation Experiment (HALOE) on the Up-per Atmosphere Research Satelitte (UARS) to study the Halloween SPE. The GSFC 2-D model accounts for the proton flux, measured by the Geostationary Operational En-vironmental Satellites (GOES) 11, but neither for the alpha particle flux nor for the elec-tron flux. The model uses the nitrogen-production of Porter et al. (1976) as described
25
ACPD
12, 17703–17721, 2012Lifetime and production rate of
NOx F. Friederich et al.
Title Page
Abstract Introduction
Conclusions References
Tables Figures
◭ ◮
◭ ◮
Back Close
Full Screen / Esc
Printer-friendly Version
Interactive Discussion
Discussion
P
a
per
|
Dis
cussion
P
a
per
|
Discussion
P
a
per
|
Discussio
n
P
a
per
|
above. To model the NOx-change, the authors examined the difference of a “perturbed” (with ionization rates of a SPE) and an “unperturbed” model run. To quantify the ob-served NOxchange, the authors examined the difference of the days after 30 October
and the “backround” from 12–15 October. The production of the GSFC 2-D model fits very well to the HALOE-measurement, but between 50 km and 60 km it seems to be
5
a little too high.
4.2 Baumgaertner et al. (2010)
As in the study before, Baumgaertner et al. (2010) only accounted for the proton flux, measured by GOES. In a first run, they start with a production rate of 0.55 N(4S) and 0.7 N(2D), resulting in the production of NO, per ion pair. Results of the ECHAM/MESSy
10
Atmospheric Chemistry (EMAC) model are compared with measurements of MIPAS. The mesospheric enhancement of NO2 is lower in the measurement (50 ppbv) than
in the simulation (60 ppbv). However, the difference can be explained by systematic errors and dynamical effects. In order to improve the simulated N2O abundance, which is seven times higher than the measured one, tests with alternative altitude dependent
15
N- and NO-production rates (each between 0 and 1.2) were performed. They present in Fig. 9 of Baumgaertner et al. (2010) the NO-production rates, which fitted best. Their NO-production rates are about three times higher at altitudes from 42 km to 50 km, 20 % higher at 54 km and significantly lower from 58 km to 66 km than the NOx-production
rates at a latitude of−63◦±4◦from Fig. 4 (top). 20
4.3 Funke et al. (2011)
In the High Energy Particle Precipitation in the Atmosphere (HEPPA) intercomparison the ability of numerous models to simulate atmospheric composition changes after the Halloween SPE was investigated (Funke et al., 2011). All involved models show a NOy increase between 1.5 hPa and 0.4 hPa (∼45 km–55 km), which is systematically higher 25
than the increase measured by MIPAS. The authors give two different reasons for that.
ACPD
12, 17703–17721, 2012Lifetime and production rate of
NOx F. Friederich et al.
Title Page
Abstract Introduction
Conclusions References
Tables Figures
◭ ◮
◭ ◮
Back Close
Full Screen / Esc
Printer-friendly Version
Interactive Discussion
Discussion
P
a
per
|
Dis
cussion
P
a
per
|
Discussion
P
a
per
|
Discussio
n
P
a
per
|
First, the ionization rates provided by AIMOS may be too high for these altitudes. At these altitudes, uncertainties of the measurements of the electrons with an energy range of 300 keV–2.5 MeV and the extension to 5 MeV based on these measurements are rather high. Also, models using a family approach for NOx tend to overestimate the net NOx production. Reaction (R2) strongly depends on temperature and the initial
5
NOy abundance. To demonstrate this, the authors show the production rate efficiency
of NOx (ratio of the net NOx increase and the integrated initial N production) for the Northern Hemisphere during 28 October–1 November determined by a box model. We used the same box model, to test the dependence of the effective production. But we used other initial values for the Southern Hemisphere namely temperature, NO, NO2,
10
O3, measured by MIPAS, the ionisation rates of AIMOS and the photolysis rates of SLIMCAT. In Fig. 4 (left) the black curve shows the result of this box model. The red curves show the estimated error range after varying the initial values (temperature:
±10 K and NO, NO2, O3:±10 %). The shape of the black curve is explained by two
effects. First, Reaction (R2) is strongly temperature dependent. It is less effective in
15
colder and therefore higher altitudes in the mesosphere. Additionally, the photolysis rate of NO increases with altitude. At –63◦ and –73◦S the e
ffective NOx-production rates of the box model are considerably higher from 44 km to 52 km. At higher altitude the error bars of the measured and modeled effective NOx-production rates overlap at
–63◦S. At –73◦S the modeled values are higher at 60 km and 62 km.
20
5 Conclusions
We showed a simple method to derive lifetimes of NOx after a solar proton event by
means of MIPAS measurements. The lifetime of NOx at that time at altitudes between 44 km and 64 km mainly depends on dynamic effects and less on photolysis, because in most cases the lifetime of NOx is significantly shorter than the sole photolytic lifetime.
25
Including the lifetime of NOx, we were able to present the dependence of the NOx -production on the ion pair -production.
ACPD
12, 17703–17721, 2012Lifetime and production rate of
NOx F. Friederich et al.
Title Page
Abstract Introduction
Conclusions References
Tables Figures
◭ ◮
◭ ◮
Back Close
Full Screen / Esc
Printer-friendly Version
Interactive Discussion
Discussion
P
a
per
|
Dis
cussion
P
a
per
|
Discussion
P
a
per
|
Discussio
n
P
a
per
|
The calculated NOx-production rates do not reproduce the theoretical value of 1.25 due to chemical and photochemical loss processes of NOx.
The measured production rates are outside the error bars and significant lower than in the box model of Funke et al. (2011) at altitudes between 44 km and 52 km. At the same altitudes, the models of the HEPPA intercomparison show a too high NOx
-5
production. One reason could be that the measurement of precipitating energetic elec-trons has significant errors and may result in too high ionization rates at these altitudes.
Acknowledgements. F. Friederich, H. Nieder, and M. Sinnhuber gratefully acknowledge funding by the Helmholtz society, grant VH-NG-624.
References 10
Baumgaertner, A. J. P., J ¨ockel, P., Riese, H., Stiller, G., and Funke, B.: Energetic particle pre-cipitation in ECHAM5/MESSy – Part 2: Solar proton events, Atmos. Chem. Phys., 10, 7285– 7302, doi:10.5194/acp-10-7285-2010, 2010. 17706, 17713
Brasseur, G. P. and Solomon, S.: Aeronomy of the Middle Atmosphere, 3rd edn., Springer, Dordrecht, The Netherlands, 2005. 17706
15
Chipperfield, M. P.: Multiannual simulations with a three-dimensional chemical transport model, J. Geophys. Res., 104, 1781–1805, 1999. 17709
Crutzen, P. J., Isaksen, I. S. A., and Reid, G. C.: Solar proton events – stratospheric sources of nitric oxide, Science, 189, 457–459, doi:10.1126/science.189.4201.457, 1975. 17705 Fischer, H., Birk, M., Blom, C., Carli, B., Carlotti, M., von Clarmann, T., Delbouille, L.,
Dud-20
hia, A., Ehhalt, D., Endemann, M., Flaud, J. M., Gessner, R., Kleinert, A., Koopman, R., Langen, J., L ´opez-Puertas, M., Mosner, P., Nett, H., Oelhaf, H., Perron, G., Remedios, J., Ridolfi, M., Stiller, G., and Zander, R.: MIPAS: an instrument for atmospheric and climate research, Atmos. Chem. Phys., 8, 2151–2188, doi:10.5194/acp-8-2151-2008, 2008. 17707 Funke, B., L ´opez-Puertas, M., von Clarmann, T., Stiller, G. P., Fischer, H., Glatthor, N.,
25
Grabowski, U., H ¨opfner, M., Kellmann, S., Kiefer, M., Linden, A., Mengistu Tsidu, G., Miliz, M., Steck, T., Stiller, G. P., Wang, D. Y.: Retrieval of stratospheric NOx from 5.3 and 6.2 µm nonlocal thermodynamic equilibrium emissions measured by Michelson
ACPD
12, 17703–17721, 2012Lifetime and production rate of
NOx F. Friederich et al.
Title Page
Abstract Introduction
Conclusions References
Tables Figures
◭ ◮
◭ ◮
Back Close
Full Screen / Esc
Printer-friendly Version
Interactive Discussion
Discussion
P
a
per
|
Dis
cussion
P
a
per
|
Discussion
P
a
per
|
Discussio
n
P
a
per
|
ter for Passive Atmospheric Sounding (MIPAS) on Envisat, J. Geophys. Res., 110, D09302, doi:10.1029/2004JD005225, 2005a. 17707
Funke, B., L ´opez-Puertas, M., Gil-L ´opez, S., von Clarmann, T., Stiller, G. P., Fischer, H., and Kellmann, S.: Downward transport of upper atmospheric NOxinto the polar stratosphere and lower mesosphere during the Antarctic 2003 and Arctic 2002/2003 winters, J. Geophys. Res.,
5
110, D24308, doi:10.1029/2005JD006463, 2005b. 17706, 17710
Funke, B., Baumgaertner, A., Calisto, M., Egorova, T., Jackman, C. H., Kieser, J., Krivolutsky, A., L ´opez-Puertas, M., Marsh, D. R., Reddmann, T., Rozanov, E., Salmi, S.-M., Sinnhuber, M., Stiller, G. P., Verronen, P. T., Versick, S., von Clarmann, T., Vyushkova, T. Y., Wieters, N., and Wissing, J. M.: Composition changes after the “Halloween” solar proton event: the High
En-10
ergy Particle Precipitation in the Atmosphere (HEPPA) model versus MIPAS data intercom-parison study, Atmos. Chem. Phys., 11, 9089–9139, doi:10.5194/acp-11-9089-2011, 2011. 17706, 17713, 17715
Jackman, C. H., McPeters, R. D., Labow, G. J., Fleming, E. L., Praderas, C. J., and Rus-sell, J. M.: Northern Hemisphere atmospheric effects due to the July 2000 solar proton event,
15
Geophys. Res. Lett., 28, 2883–2886, 2001. 17705
Jackman, C. H., DeLand, M. T., Labow, G. J., Fleming, E. L., Weisenstein, D. K., Ko, M. K. W., Sinnhuber, M., and Russell, J. M.: Neutral atmospheric influences of the solar proton events in October–November 2003, J. Geophys. Res., 110, A09S27, doi:10.1029/2004JA010888, 2005 17706, 17712
20
Jackman, C. H., Roble, R. H., and Fleming, E. L.: Mesospheric dynamical changes induced by solar proton events in October–November 2003, Geophys. Res. Lett., 34, L04812, doi:10.1029/2006GL028328, 2007. 17705
L ´opez-Puertas, M., Funke, B., Gil-L ´opez, S., von Clarmann, T., Stiller, G. P., H ¨opfner, M., Kell-mann, S., Fischer, H., and Jackson, C. H.: Observations of NOx-enhancements and ozone
25
depletion in the Northern and Southern Hemispheres after the October–November 2003 so-lar proton events, J. Geophys. Res., 110, A09S44, doi:10.1029/2005JA011051, 2005. 17706, 17708
Porter, H. S., Jackman, C. H., and Green, A. E. S.: Efficiencies for production of atomic nitrogen and oxygen by relativistic proton impact in air, J. Chem. Phys., 65, 154–167,
30
doi:10.1063/1.432812, 1976. 17705, 17712
Randall, C. A., Harvey, V. L., Singleton, C. S., Bailey, S. M., Bernath, P. F., Codrescu, M., Nakajima, H., and Russell III, J. M.: Energetic particle precipitation effects on the
ACPD
12, 17703–17721, 2012Lifetime and production rate of
NOx F. Friederich et al.
Title Page
Abstract Introduction
Conclusions References
Tables Figures
◭ ◮
◭ ◮
Back Close
Full Screen / Esc
Printer-friendly Version
Interactive Discussion
Discussion
P
a
per
|
Dis
cussion
P
a
per
|
Discussion
P
a
per
|
Discussio
n
P
a
per
|
Southern Hemisphere stratosphere in 1992–2005, J. Geophys. Res., 112, D08308, doi:10.1029/2006JD007969, 2007. 17706, 17710
Sepp ¨al ¨a, A., Verronen, P. T., Kyr ¨ol ¨a, E., Hassinen, S., Backman, L., Hauchecorne, A., Bertaux, J. L., and Fussen, D.: Solar proton events of October–November 2003: ozone de-pletion in the Northern Hemisphere polar winter as seen by GOMOS/Envisat, Geophys. Res.
5
Lett., 31, L19107, doi:10.1029/2004GL021042, 2004. 17706
Sepp ¨al ¨a, A., Cliverd, M. A., and Rodger, C. J.: NOx enhancements in the middle atmosphere during 2003–2004 polar winter: relative significance of solar proton events and the aurora as a source, J. Geophys. Res., 112, D23303, doi:10.1029/2006JD008326, 2007. 17706 Siskind, D. E. and Russell III, J. M.: Coupling between middle and upper
atmo-10
spheric NO: constraints from HALOE observations, Geophys. Res. Lett., 27, 329–332, doi:10.1029/1999GL010940, 1996. 17706, 17710
Toohey, M., von Clarmann, T., Hegglin, M., Tegtmeier, S., and the SPARC Data Initiative team: SPARC Data Initiative: climatology uncertainty assessment, World Climate Research Pro-gramme, Open Science Conference, Denver, 2011. 17709
15
Wissing, J. M. and Kallenrode, M.-B.: Atmospheric Ionization Module Osnabr ¨uck (AIMOS): a 3-D model to determine atmospheric ionization by energetic particles from different popu-lations, J. Geophys. Res., A06104, doi:10.1029/2008JA013884, 2009. 17707
ACPD
12, 17703–17721, 2012Lifetime and production rate of
NOx F. Friederich et al.
Title Page
Abstract Introduction
Conclusions References
Tables Figures
◭ ◮
◭ ◮
Back Close
Full Screen / Esc
Printer-friendly Version
Interactive Discussion
Discussion
P
a
per
|
Dis
cussion
P
a
per
|
Discussion
P
a
per
|
Discussio
n
P
a
per
|
0
2
4
6
8
day after October 28
0
50
100
150
200
NOx [ppb]
Fig. 1. MIPAS vmr measurements of NOx (red) at October–November 2003 and a fit of an exponential function (blue) at an altitude of 62 km and at a latitude of−73◦
±4◦. The error bars
show the error of the mean of the zonal averages.
ACPD
12, 17703–17721, 2012Lifetime and production rate of
NOx F. Friederich et al.
Title Page
Abstract Introduction
Conclusions References
Tables Figures
◭ ◮
◭ ◮
Back Close
Full Screen / Esc
Printer-friendly Version
Interactive Discussion
Discussion
P
a
per
|
Dis
cussion
P
a
per
|
Discussion
P
a
per
|
Discussio
n
P
a
per
|
1 10 100
lifetime [days] 45
50 55 60 65
altitude [km]
0.0 0.5 1.0 1.5 2.0
chi square 45
50 55 60 65
altitude [km]
1 10 100
lifetime [days] 45
50 55 60 65
altitude [km]
0.0 0.5 1.0 1.5 2.0
chi square 45
50 55 60 65
altitude [km]
Fig. 2.Left: altitude dependent lifetimes of NOx after the SPE at 30 October at latitudes of
−63◦±4◦ (top) and−73◦±4◦ (bottom). The lifetimesτas calculated from MIPAS measurements are displayed in red. The red error bars show the 1σ-range of the value. The photolytic lifetimes
τphottaken from SLIMCAT are displayed in black diamonds. The resulting dynamic lifetimesτdyn
are diplayed in blue crosses. Right: altitude dependentχ2 values between measurement and fit of the exponential function at the latitudes−63◦
±4◦ (top) and−73◦±4◦ (bottom) according
to the figures left.
ACPD
12, 17703–17721, 2012Lifetime and production rate of
NOx F. Friederich et al.
Title Page
Abstract Introduction
Conclusions References
Tables Figures
◭ ◮
◭ ◮
Back Close
Full Screen / Esc
Printer-friendly Version
Interactive Discussion
Discussion
P
a
per
|
Dis
cussion
P
a
per
|
Discussion
P
a
per
|
Discussio
n
P
a
per
|
-150 -100 -50 0 50 100
days, 0: 1 January 2004 0
1 2 3 4 5
n [10
8 cm -3 ]
28.10. 20.11. 1.2. 1.4.
106 107 108 109
I(IPP,τ,t0) [24h -1cm-3]
-1 0 1 2 3 4
∆
n(t
0
) [10
8 cm -3 ]
Fig. 3.Left: time curve of the number densitynof NOx at a geomagnetic latitude of−73◦±4◦ and at an altitude of 56 km in the Austral summer 2003/04. The color code shows the time dependence. The green curve is a fitted polynomial function and shows the backround number densityn(IPP=0). Right:∆nMIPAS(the difference of the number density and the correspondent
value of the fitted function at the plot left) is plotted in dependence ofI(IPP,τ,t0), specified in
Eq. (5), at a geomagnetic latitude of−73◦
±4◦and at an altitude of 56 km. The color code is the
same as in the figure left. The green curve is a linear fit. The red curve shows the theoretical function for a production rate of 1.25 N per ion pair. In both plots the standard error of the mean is shown by black error bars.
ACPD
12, 17703–17721, 2012Lifetime and production rate of
NOx F. Friederich et al.
Title Page
Abstract Introduction
Conclusions References
Tables Figures
◭ ◮
◭ ◮
Back Close
Full Screen / Esc
Printer-friendly Version
Interactive Discussion
Discussion
P
a
per
|
Dis
cussion
P
a
per
|
Discussion
P
a
per
|
Discussio
n
P
a
per
|
0.0 0.2 0.4 0.6 0.8 1.0 1.2 1.4 production rate 45
50 55 60 65
altitude [km]
0 1 2 3 4 5
chi square 45
50 55 60 65
altitude [km]
0.0 0.2 0.4 0.6 0.8 1.0 1.2 1.4 production rate 45
50 55 60 65
altitude [km]
0 1 2 3 4 5
chi square 45
50 55 60 65
altitude [km]
Fig. 4.Left: number of the produced NOx-molecules per ion pairxin dependence of the altitude at a geomagnetic latitude of−63◦
±4◦(top) and−73◦±4◦(bottom). The production rate per ion
pairxis the gradient of the fit shown as green line in Fig. 3 (right panel). The error bars show the 1-σrange of the production rate. The black curve shows the effective daytime NOx-production rate per ion pair, calculated with a box model. The red curves show the error range after varying the initial values of this box model as described in Sect. 4.3. Right: altitude-dependentχ2value of the fits related to the green line in Fig. 3 (right panel).