Interaction Network
Irene Sendin˜a–Nadal1,2*, Yanay Ofran3, Juan A. Almendral1,2, Javier M. Buldu´1,2, Inmaculada Leyva1,2, Daqing Li4, Shlomo Havlin4, Stefano Boccaletti5
1Complex Systems Group, Universidad Rey Juan Carlos, Madrid, Spain, 2Laboratory of Biological Networks, Centre for Biomedical Technology, Campus de Montegancedo, Madrid, Spain,3The Mina and Everard Goodman Faculty of Life Sciences, Bar-Ilan University, Ramat Gan, Israel,4Department of Physics, Minerva Center, Bar-Ilan University, Ramat Gan, Israel,5CNR- Istituto dei Sistemi Complessi, Sesto Fiorentino, Italy
Abstract
Protein interaction networks have become a tool to study biological processes, either for predicting molecular functions or for designing proper new drugs to regulate the main biological interactions. Furthermore, such networks are known to be organized in sub-networks of proteins contributing to the same cellular function. However, the protein function prediction is not accurate and each protein has traditionally been assigned to only one function by the network formalism. By considering the network of the physical interactions between proteins of the yeast together with a manual and single functional classification scheme, we introduce a method able to reveal important information on protein function, at both micro- and macro-scale. In particular, the inspection of the properties of oscillatory dynamics on top of the protein interaction network leads to the identification of misclassification problems in protein function assignments, as well as to unveil correct identification of protein functions. We also demonstrate that our approach can give a network representation of the meta-organization of biological processes by unraveling the interactions between different functional classes.
Citation:Sendin˜a–Nadal I, Ofran Y, Almendral JA, Buldu´ JM, Leyva I, et al. (2011) Unveiling Protein Functions through the Dynamics of the Interaction Network. PLoS ONE 6(3): e17679. doi:10.1371/journal.pone.0017679
Editor:Yamir Moreno, University of Zaragoza, Spain
ReceivedDecember 27, 2010;AcceptedFebruary 5, 2011;PublishedMarch 9, 2011
Copyright:ß2011 Sendin˜a-Nadal et al. This is an open-access article distributed under the terms of the Creative Commons Attribution License, which permits unrestricted use, distribution, and reproduction in any medium, provided the original author and source are credited.
Funding:Work partly supported by EU contract 043309 GABA, the Spanish Ministry of S&T under Project n. FIS2009-07072, and the Community of Madrid under the R&D Program of activities MODELICO-CM/S2009ESP-1691. No additional external funding received for this study. The funders had no role in study design, data collection and analysis, decision to publish, or preparation of the manuscript.
Competing Interests:The authors have declared that no competing interests exist.
* E-mail: [email protected]
Introduction
The rapid improvements in sequencing technologies are adding new sequences to the databases faster than the pace at which insights into their function could be gained. As a consequence, the vast majority of known genes and proteins have not been characterized experimentally, and their function is yet unknown [1]. Moreover, biological functions are not, in general, realized by individual proteins, but, rather, by networks of intricate interac-tions between numerous genes. The understanding of biological processes requires, therefore, a better knowledge of the functional organization of such networks. Indeed, the study of biological processes increasingly relies on the analysis of biological networks (BN), which has been used to tackle different levels of the functional organization of the cell. On the level of individual proteins, BN are often used to help to elucidate the molecular function of specific proteins [2,3]. On the systems level, they are studied to reveal modules and functional sub-networks [4,5].
An issue that has hardly been faced is that of the meta-organization of different functions in a single, integrated, network. Yooket al.[6] have concluded that most functional classes appear as segregated sub-networks of the full protein interaction network (PIN). Like most of the studies of BN, the results of Ref. [6] are based on parsing the static network, and do not allow the exploration of the meta-organization and the interactions of the sub-networks. We here, instead, give evidence that a dynamical approach to the analysis of BN based on their meta-organization
not only enhances the prediction of the function of individual proteins, but also can reveal information on the network macro-scale of interactions between different biological functions.
As for predicting the function of individual proteins, two main strategies have been followed so far. The first relies on the analysis of the protein itself: e.g. its similarity to already annotated proteins, its structure, or its biophysical features [1,7,8]. The second one is, instead, based on high-throughput technologies providing data that may highlight the context in which the protein acts such as its sub-cellular localization, interactions with other proteins, and the conditions under which it is expressed (or the genes that are co-expressed with it) [2,3]. High-throughput protein-protein interac-tions detection experiments allow nowadays a representation of the global cell functioning in terms of a network, with nodes representing proteins and edges representing the detected mutual interactions, with the goal of exploiting the properties of these networks for prediction purposes on the function of specific proteins. Notwithstanding the accomplishments of these analyses it is important to highlight that most high-throughput methods can suffer from high false positive and false negative rates [9] and, therefore, functional assignments that are based on these tools may lead to misclassifications.
individual protein’s function. And, in this latter framework, the current state of the art includes, again, two types of approaches. From one side, several direct annotation schemes have been devised [10–14], with the common inspiration of analyzing the local scale features of the PIN, i.e. either basing the function prediction on the information that can be directly extracted from the protein neighborhood, or statistically assessing a probability for a protein to be assigned to a given function, depending on the actual number of its neighbors that are (or are not) pertinent to the same function. From the other side, more recent module assisted techniques [15–17] have attempted to make use of the extra knowledge arising from the meso-scale of clustered structures of the PIN, with first identifying dense agglomerates in the network that are loosely connected to other areas of the graph, and then to use this topological information for predictions on the protein specific function.
The approach we lay out constitutes a third, novel, strategy. We provide evidence that an alternative source of information is, in fact, the one arising from the analysis of how the modular PIN structure actually organizes the synchronization dynamics of an ensemble of oscillators. In particular, we show how the combination of synchronization features emerging in the PIN structure with a rudimentary classification of proteins based on expert manual assignment, allows, indeed, to gather information on misclassification problems, as well as to offer a more accurate function assignment that is consistent with more recent (and better refined) manual annotation of these proteins’ function. Not less important is the ability of the approach we introduce to assess the coupling of different functional categories, to determine how closely associated they are, and which proteins participate in both of them.
Materials and Methods
Data
For our research we have used a typical and important network with rudimentary functional assignments derived from a Saccha-romyces cerevisiaePIN, as reported in [18]. The data set is based on the work by von Mering et al. [9] who scored the reliability of 80,000 reported protein-protein interactions in the yeast. These were based on high-throughput interaction detection methods, such as i) yeast two-hybrid systems [19,20], ii) protein complex purification techniques using mass spectrometry [21,22], iii)
correlated messenger RNA expression profiles [23,24],iv)genetic interaction data [25,26], andv)‘‘in silico’’ interaction predictions derived from gene context analysis. From this set, Buet al.[18] focused on 11,855 interactions (those featuring high and medium confidence levels) among 2,617 proteins. We here focus on the giant connected component of the PIN given in Bu et al. [18], consisting ofN~2,375proteins andL~11,693interactions.
As for the modular structure of the PIN, we initially refer to the partition in 13 functional categories given by the yeast protein catalog at the Munich Information Center for Protein Sequences (MIPS) [26]. Particularly, we use the data set in which each given protein is assigned to one of the functional categories (with proteins in multiple categories manually assigned by Buet al.[18] to only one).
In order to test the validity of our findings, we will use the classification provided by the Gene Ontology consortium (GO) [27]. While MIPS attempts to provide a simple hierarchy with intuitive category structure that allows for manual browsing, GO aims at representing a fine granular description of proteins that provides annotation with a wealth of detailed information. Thus, MIPS gives a very rough division into a couple of dozens of
categories and several hundreds of subcategories, whereas GO includes 29,983 different functional terms (as of March 2010). GO also provides a reduced version of its ontology (GOslim) that allows one to trace the detailed terms into more coarse-grained categories. In our analysis, we start with the single MIPS classification for each protein, and use the dynamical overlap method for identifying those proteins that are likely to be involved in more than one of the functional categories in our data (those ones forming the overlapping structures). As a validation, we refer to the classification of these proteins in GOslim, Namely, by manually mapping each GOslim term to one of the 13 MIPS categories, one is able to verify whether or not the assignment of the second function (provided by our method for each one of the proteins in the overlapping sets) is consistent with the functional annotation in GO.
Dynamical Overlap Formalism
The method is based on the inspection of how oscillators organize in a modular network of dynamical interactions [28], by forming synchronization interfaces and overlapping communities [29,30]. Here, we will consider a network of phase oscillators on top of the PIN. Thus, the transfer of function between neighboring proteins is performed through the synchronization of coupled oscillators. In order to explain how the method works, let us assume the PIN of the yeast is topologically divided into two main modules,M1 andM2, each one of them associated to a specific
protein function. Every node (protein) in the network is an oscillator whose frequencyviis set tov1(v2) whenever the nodei
belongs toM1 (M2), withv1wv2. The phase dynamics of this
network ofN coupled oscillators can be described by
_
w wi~viz
d Ki
XN
j~1
aijsin (wj{wi) ð1Þ
where dot denotes temporal derivative,wi(t)is the phase of thei-th oscillator,Kiis the number of interactions that thei-th protein has with the rest of proteins,dis some coupling strength, and(aij)are the elements of the adjacency matrix representing the PIN [28], with(aij)~1if there is an interaction between proteinsiandj, and
(aij~0)otherwise.
In the extreme case of fully separated modules the network dynamics would eventually (at large coupling strengthd) result in the clustersM1 and M2 oscillating synchronously at a constant,
different, frequency. If, however, there are just a few interactions between proteins of the two modules, the onset of asynchronization interface overlapping the two modules occurs, made of all those nodes displaying an instantaneous frequency that are actually oscillating in time around the mean value of the two frequencies characterizing the clusters [29]. The rest of nodes, out of the synchronization interface, oscillate at the frequency of the module they belong to. To quantify this behavior, we monitor the instantaneous frequency of each oscillator and we calculate the indicatorCi,
Ci:~sgn½min
t f _
w
wi(t){vvgmin
t fj _
w
wi(t){vvjg ð2Þ
which accounts for how close in time the frequency associated to proteiniis to the average frequencyvvof the two clusters,v1and
v2. By fixing a confidence threshold 0ve%v1{v2, those
belonging to the synchronization interface betweenM1and M2.
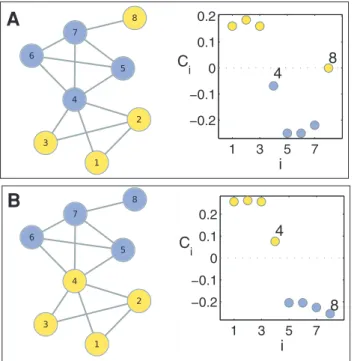
This behavior is graphically sketched in Fig. 1. There, a small graph composed of 8 nodes (Fig. 1A) clearly has two densely connected modules that do not coincide with the given functional classification denoted by the color of the nodes. Actually, node 8 does not have any link within its functional module, the yellow one, while node 4 is classified within the blue functional module but shares the same number of links with the other functional module. After solving Eq. (1) by assigningvi~v1to nodes 1–3
and 8 (functional module M1), and vi~v2 to nodes 4–7
(functional module M2), the corresponding Ci values extracted
from Eq. (2) indicate that nodes 1–3 really belong to moduleM1
(as Ciwe), nodes 5–7 belong to moduleM2(as Civ{e), while nodes 4 and 8, whose jCijve, are the ones candidates to be overlapping betweenM1andM2. To solve this uncertainty, nodes
4 and 8 are reassigned toM2(blue) andM1(yellow) respectively
(Fig. 1B) and we observe that whereasC8falls now within the area
of moduleM2, increasing the cohesion of the functional module,
node 4 still lies within the synchronization interface (jC4jve) overlapping between both modules.
For the real situation of a PIN with 13 different functional modules (M1,M2,. . .,Mn), this can be done by integratingn~13
times the network dynamics described by Eq.(1). In each trial, the k-th module (k~1,. . .,n) is assigned to the cluster frequencyv1,
whereas the rest of the PIN is given the second cluster frequency
v2, resulting in a series of Ci(Mk) values. This time all those
proteins initially assigned toMkwhoseCi(Mk)we, actually belong to module Mk, while ifCi(Mk)v{ebelong to another module
different fromMk. All those nodes whosejCi(Mk)jveare labeled as belonging to theSksynchronization interface between module k and the rest of the network. Then, a node is identified as an overlapping node between modulesMk andMl if, being a node from eitherMk orMl, is in bothSk andSl, that is
Skl:~(Mk|Ml)\(Sk\Sl):
Finally, the set of nodes of modulekoverlapping with modulel, withk=l, is
Rkl:~Mk\(Sk\Sl), ð3Þ
which has two implications: i) while Skl is symmetric in the indexes, Rkl is not, and ii) Skl~Rkl|Rlk and, since Rkl\Rlk~1,jSklj~jRkljzjRlkj.
Eventually, the degree of overlapping between two modules is then given by:
Okl:~ jSklj
jMkjzjMlj~
jRkljzjRlkj
jMkjzjMlj, ð4Þ
which, therefore, provides a measure of how many nodes out of the clusters k and l are forming the corresponding overlapping structure.
The main result of our method is, therefore, an indexCi(Mk)
accounted by Eq.(2), that, for each proteini, measures its degree of membership to module Mk (i.e. a protein function). A value Ci(Mk)v{e indicates that the protein exhibits a dynamical behavior different from that of the majority of proteins inMk, thus clearly belonging to other module. On the other hand,Ci(Mk)we occurs when the protein performs as the rest of proteins assigned to the same module Mk, and this confirms that it is certainly member of Mk. Finally, a value ofCi(Mk) close to zero is the signature of a protein whose module membership requires further analysis as it could be the case of a protein belonging to two or more functional modules. Therefore, we are introducing an index that allows to check the accuracy of the initial functional assignment as well as predicting a second (or more) function of a protein.
Results and Discussion
The application of the method given by Eq. (1) to the PIN and modular classification with N~2,375, v1~0:8, v2~0:2, and
d~0:3, as described in the Materials and Methods section leads to 13 different series forCi(Mk)(being k~1,. . .,13the functional module index andi~1,. . .,2,375the protein index). In order to proceed with the full analysis of this data, we have to consider all possible combinations of these series to check whether a protein belongs to the functional module initially assigned or whether it is involved in more than one functional module. This can be done efficiently, as shown in the Figure S1, but, to illustrate the principles underlying the method, we will just focus on a single pair of functions.
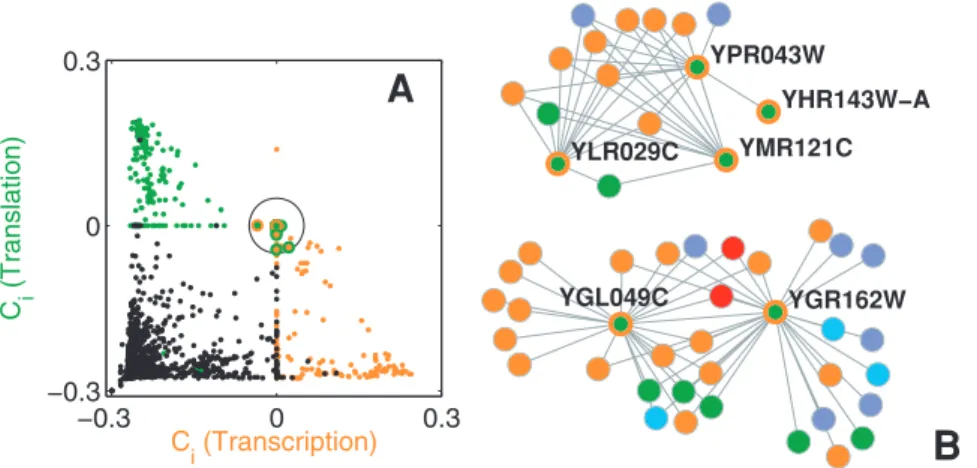
Figure 2A shows the values of the indexesCi(M4)andCi(M8),
being M4 and M8 the Cellular fate/organization and Genome maintenancefunctional modules. We plot proteins initially assigned toM4(M8) in blue (red), while the rest of proteins are plotted in
black. Notice that most of the black points are concentrated around ({0:3,{0:3), as the corresponding proteins neither belong to M4 nor M8. The majority of proteins in M4 (blue)
and M8 (red) are located close to (0:3,{0:3) and ({0:3,0:3), Figure 1. Graphical description of the dynamical overlap
method.(A) A two module small graph composed of 8 nodes colored according to their membership to the functional moduleM1(yellow) or
M2 (blue), and corresponding Ci values after solving Eq. (1) with vi~v1~0:8 forM1 and vi~v2~0:2 forM2. Nodes 4 and 8 have
Ci*0with this functional classification. (B) Same as in (A) but nodes 4 and 8 has been reassigned to modulesM2andM1respectively. Now,
node 8, behaves as a node truly fromM2while node 4 behaves as an
overlapping node betweenM1andM2asCiis again close to zero. All the network representations in this manuscript were produced with Cytoscape.
respectively. The blue points inside the ellipse correspond to proteins initially classified asM4that are not belonging toM8(as
Ci(M8)v0), but for the very same to M4 is under question (Ci(M4)*0). When examining the indexes for the rest of modules,
one finds out Ci(Ml)v0Vl=4. Therefore, we infer that these proteins do, indeed, belong to M4 although weakly. The same
arguments apply for the red points lying within the other ellipse: they are proteins weakly ascribed to M8. A completely different
situation is that of those points distributed around(0,0)(inside the circle, mostly of the points superimposed). They correspond to 15 proteins whose unique membership to M4 and M8 cannot be
asserted. When checking the rest ofCivalues, one finds that none of these proteins can be assigned to modules other thanM4and
M8, thus again they are weakly associated to both functionsM4
andM8(one of them being the initially assigned function, and the
other the predicted one). The novelty here is that there is a twofold assignation, which could be considered as the trace of multi-functional proteins.
Before claiming for multi-functionality, it is mandatory to check if such a multi-assignment holds when the initial modular structure changes. This is tantamount to reassign each one of these proteins to the predicted function and check whether the corresponding protein is still located around (0,0), otherwise the multi-functionality is simply an artifact. The newCi values for the 15 proteins (after reclassification) are shown in Fig. 2A as circles bordered with the color of the predicted function. The remarkable result is that the emerging dynamics behavior agrees with the new classification, as the 15 proteins are no longer overlapping and move now to the areas corresponding to the predicted function. If we take into account the number of connections a given protein is forming with elements belonging to any one of the other modules in the graph,Kout
i , the emerging dynamics is reflecting the fact that the original and predicted assignments correspond, respectively to Kout
i ~Ki andKiout~0, that is, the predicted classification makes
the functional module more cohesive (see Fig. S2B). For the sake of visualization, Fig. 2B shows the backbone of the original PIN made of the 15 proteins and all their neighboring proteins. While the original function assignment classified the proteins in modules in which they do not have physical interactions, the reclassification is able to unveil the participation of the proteins to the correct module. For example, according to GO, YHR172W is not involved in Cellular fate/organization but in Genome mainte-nance (see Table S1), which is in agreement with the classification pointed by our method.
Notice that, in the full analysis, the number of proteins featuring an overlapping behavior is 418 (see the full listL1in Table S1 and
Fig. S2) out of which 103 proteins have no functional annotation in GO and 200 had two or more different function annotations in GOslim. For these latter ones, a comparison with the functions assigned by GO reveals that in 87 cases the predicted function is in agreement with one of the GO assignments. The expected average number of matching of the proteins inL1for a random function
assignment is 25. The p-value for the significance of this result is 0.0001, and it can be established by performing 1,000 random reshuffles of function assignment, and verifying the average number of matches (which in this case was 25). The highest number of random matches was 50 (in 1/1,000 cases), well below the observed 87. As a result, one can claim an original misclassification and, consequently, the method can be used to cure errors in a given protein function classification.
With the guidance of the information obtained so far, we have reclassified all proteins of L1 to the corresponding predicted
functions, and extracted the subgraph of the original PIN for which each functional module corresponds to a connected component (i.e. we pruned out all those other proteins that were assigned a given function in the MIPS classification, but did not have any interaction with other elements of the same function). The result is a new interaction network made of 2,049 nodes and Figure 2. Identification of misclassified proteins.(A)Ci(M4)andCi(M8)values for all proteins in the PIN of the yeast. The color indicates the
functional module initially assigned to each protein (blue forM4, red forM8and black for the rest). The method identifies 15 proteins (within the
circle) with a twofold assignation (the initial and the predicted one). After re-assignation to the predicted function, the newCi values of the 15 proteins are depicted as circles bordered with the color of that function, and lie together with those other proteins of the same function, indicating an original misclassification. (B) Visualization of the network backbone, made of the 15 misclassified proteins and their neighbors. Same color code as for (A).
9,941 links, that we take for a new set of numerical trials, resulting in a second list L2 of 211 potentially multi-functional proteins
(reported in Table S2). The situation, is now radically different: at variance with the results of Fig. 2, Fig. 3 shows that the multi-functional nature of the 30 proteins inside the circle (the subset of L2 obtained when comparing M1 (Transcription) and M6
(Translation), is indeed genuine, as the final outcome does not depend on whether the proteins are classified according to the assigned or predicted functional modules (see Fig. S3A). This is further confirmed by the simultaneous reclassification of each one of the proteins of L2 into the predicted function, and by
monitoring the change in the out-degree, Kout
i , calculated with the predicted and the original classification (shown in Fig. S3B).
An independent test of the validity of that assignment is to assess the multi-functionality character of the proteins in L2 by
comparison with the more accurate GO classification scheme. One can count the number of different GO annotations for each
of the proteins inL2, and the corresponding distribution of multiple
assignments in the rest of the data. The difference between the two distributions (see Figure 4) is significant (p-valuev0:01, as for conventional t-test). Namely, the average number of different function assignments inL2is 6.7, with mode 4, while in the other
proteins one finds 4.9 and 3 respectively. Moreover, the standard deviation of the distribution of functions inL2is significantly greater
than that of the other proteins. This confirms that the proteins inL2
come from a population with higher multi-functionality with respect to the population of other proteins.
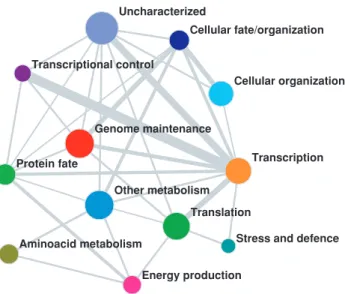
Finally, the method allows also to assess a coarse-grain representation of the PIN, showing the way each biological function is interacting with the others. In Figure 5, each specific cell function is represented by a node whose size is proportional to the total number of proteins participating in that function. The width of each link is proportional to the number of multi-functional proteins provided by our method (Equation (4)). The resulting network representation of the full cell functioning suggests numerous insights about the organization and control of biological functions. As one might expect, there is a strong link between Transcription, Translation and Transcriptional control. But these functions have almost no common proteins to functions like Genome maintenance, Cellular organization or Metabolism. Interestingly, the results show that there are no shared proteins between Amino-acid metabolism and Protein fate, suggesting that even though these two processes may seem related there are no known common mechanisms that control both functions.
We have then given evidence that a proper inspection on the meso-scale interactions of a generated network of dynamical systems can provide useful information on the micro- and macro-scale processes through which biological processes are organized in a cell. The method is not only able to predict and reassign the function of a given protein, but also to describe qualitatively the main functional interactions that lead to the global functioning of the organism. It is worth highlighting that the present application only focused on unveiling proteins with double functionality, while the method can be easily applied to gather information also on proteins bridging among more than two different biological functions (such an evidence will be reported elsewhere). The core of the presented results gives insights on how molecular functions are networking at different scales, as well as on how to design (or engineer) proper drugs, or mechanisms to control (or regulate) the Figure 3. Identification of multi-functional proteins.(A)Ci(M1)andCi(M6)values for the 2,049 proteins in the PIN of the yeast after curation.
The color indicates the functional module initially assigned to each protein (orange forM1, green forM6and black for the rest). The 30 proteins
located inside the circle remain there after re-assignation to the predicted function, and are depicted as circles bordered with the color of that function. (B) Visualization of the network backbone made of 6 (out of 30) of the multi-functional proteins in (A).
doi:10.1371/journal.pone.0017679.g003
Figure 4. Statistical assessment of protein multi-functionality. Probability density function of the number of different GO annotations (see Materials and Methods section) of the 211 overlapping proteins in L2(blue diamonds), as compared to the probability of other proteins in
the rest of the data (red squares). Continuous lines are shape-preserving interpolations.
biological interactions responsible for the functioning, or malfunc-tioning, of a cell.
Supporting Information
Figure S1 Identification of misclassified proteins.The
proposed tool is providing the behavior of each protein in the PIN through the indicator Ci(Mk), that crucially depends on its original functional classification. Each panel corresponds to the competition trial between module Mk at frequencyv1(in black
symbols) and the rest of modules Ml=k at frequency v2 (in
different symbols and colors). The size of each module is written between brackets. Nodes belonging to the corresponding synchro-nization interface (jCi(Mk)jv0:05, gray band) are marked in full face. Those nodes corresponding to overlapping proteins (those appearing in two synchronization interfaces,jCi(Mk)jv0:05and jCi(Ml)jv0:05) are encircled with the color of the corresponding overlapping function. Parameters used in Equation (1):N~2,375,
v1~0:8,v2~0:2andd~0:2(A),d~0:3(B).M1(Transcription),
M2(Other metabolism),M3(Uncharacterized),M4(Cellular fate/
organization), M5 (Protein fate), M6 (Translation), M7
(Amino-acid metabolism), M8 (Genome maintenance), M9 (Cellular
organization),M9(Energy production),M10(Stress and defence),
M11 (Transcriptional control),M12 (Transport and sensing), and
M13 (Transport and sensing).
(EPS)
Figure S2 Identification of misclassified proteins. (A)
Dynamical behavior of the 418 overlapping nodes. In blue when the modules are defined according to the original classification (MIPS). Given that the overlapping nodei[Rklis simultaneously inSkandSl, we represent with a circle itsCivalue inSkand with a square itsCivalue inSl. In red we represent the same values as before but when the modules are modified to take into account the function predicted by our method for the overlapping nodes. Same parameters as in Fig. S1B. (B) Topological behavior. D(Kout
i )=Ki:½(Kiout)predicted{(Kiout)original=Ki, change in the ratio
between out-degree (Kout
i , number of connections a given protein is forming with elements belonging to any one of the other modules in the graph, and the underscores predicted/original stay for the calculation ofKout
i in the corresponding annotation) and total degree (Ki, degree of the protein, independent on the specific classification of the protein) of the proteins inL1(green dots) and
the rest of the proteins (black dots) when reassigning the function given by MIPS to the predicted one. The results show that, while all non overlapping proteins (black points) are grouped around D(Kout
i )=Ki~0(i.e. they do not substantially change their in-out connections due to the change in the classification of the overlapping proteins), the members of L1 (green points) appear
grouped aroundD(Kout
i )=Ki~{1, thus reflecting the fact that the original and predicted assignments correspond, respectively to Kout
i ~Ki and Kiout~0. This indicates that in the original classification of the proteins inL1they did not have interactions
with other elements of the original functional module, whereas the predicted classification assigns them to the proper functional class. (EPS)
Figure S3 Identification of multi-functional proteins.
(A) Dynamical behavior of the new setL2of overlapping proteins.
In blue, Ci values of the set of overlapping proteins between modulesMkandMlwith the new cured classification (same as in Fig. 3). As in Fig. S2, we plot theCivalue of the overlapping node i[Rklwith circles when is inSk and with squares when inSl. In red we represent the same values as before but when the modules are modified to take into account the function predicted by our method for the overlapping nodes. (B) Topological properties of the cured PIN. Change in the ratio between out-degree (Kout
i ) and total degree (Ki) of the proteins inL2(green dots) and the rest of
the proteins (black dots) when reassigning the function given by MIPS to the predicted one. Parameters used in Eq. (1):N~2,049,
v1~0:8,v2~0:2andd~0:7.
(EPS)
Table S1 List L1 of proteins. Full list L1 with the 418
overlapping proteins resulting from the first iteration of the dynamical overlap method for the PIN of the yeast (see Materials and Methods and Fig. 2). For each protein, we provide the OLN (Ordered Locus Names), the MIPS classification, whether or not this function is annotated in GOslim, the predicted function and whether or not this predicted function is also provided by GOslim. The first 87 proteins correspond to cases in which the predicted function is in agreement with one of the GO assignments. (PS)
Table S2 List L2 of proteins. Full list L2 with the 211
overlapping proteins resulting from the second iteration of the dynamical overlap method for the curated PIN of the yeast (see Text and Fig. 3). The curation of the PIN consists in exchanging the annotated function by MIPS of the 418 proteins fromL1with
the function predicted by the overlap and removing those proteins that become isolated within the functional module. Again, for each protein, we provide the OLN (Ordered Locus Names), the MIPS classification and the predicted function.
(PS)
Table S3 Multifunctional distribution of proteins inL2.
Module index. {Number of proteins within the k-module. {Overlapping nodes belonging to Mk. }Number of proteins
belonging to thek-module overlapping with modulel. (PS)
Figure 5. Coarse grained representation of the PIN in terms of cell functioning and coordination.The size of nodes is proportional to the total number of proteins participating to the corresponding function, the width of the links is proportional to the size of the corresponding overlapping interface. The full picture of the structure of these overlaps is reported in the Table S3.
Acknowledgments
We wish to thank the EU project DAPHNet, ONR, DTRA, the Israel Science Foundation. The authors acknowledge CRESCO (Computational Research Center for Complex Systems, co-founded by ENEA, Italian National Agency for New Technologies, Energy and Sustainable Economic Development) for providing access to their computing facilities.
Author Contributions
Conceived and designed the experiments: SB SH. Performed the experiments: ISN. Analyzed the data: ISN YO JA. Contributed reagents/materials/analysis tools: JA JB IL DL. Wrote the paper: SB SH.
References
1. Punta M, Ofran Y (2008) The rough guide to in silico function prediction, or how to use sequence and structure information to predict protein function. PLoS Comput Biol 4: e1000160.
2. Sharan R, Ulitsky I, Shamir R (2007) Network-based prediction of protein function. Mol Syst Biol 3: 88.
3. Hu PZ, Bader G, Wigle DA, Emili A (2007) Computational prediction of cancer-gene function. Nat Rev Cancer 7: 23–34.
4. Alon U (2007) Network motifs: theory and experimental approaches. Nat Rev Genet 8: 450–461.
5. Stuart JM, Segal E, Koller D, Kim SK (2003) A gene-coexpression network for global discovery of conserved genetic modules. Science 302: 249–255. 6. Yook SH, Oltvai ZN, Barabasi AL (2004) Functional and topological
characterization of protein interaction networks. Proteomics 4: 928–942. 7. Lee D, Redfern O, Orengo C (2007) Predicting protein function from sequence
and structure. Nat Rev Mol Cell Bio 8: 995–1005.
8. Rost B, Liu J, Nair R, Wrzeszczynski KO, Ofran Y (2003) Automatic prediction of protein function. Cell Mol Life Sci 60: 2637–2650.
9. von Mering C, Krause R, Snel B, Cornell M, Oliver SG, et al. (2002) Comparative assessment of large-scale data sets of protein-protein interactions. Nature 417: 399–403.
10. Schwikowski B, Uetz P, Fields S (2000) A network of protein-protein interactions in yeast. Nat Biotechnol 18: 1257–1261.
11. Hishigaki H, Nakai K, Ono T, Tanigami A, Takagi T (2001) Assessment of prediction accuracy of protein function from protein-protein interaction data. Yeast 18: 523–531.
12. Deng M, Zhang K, Mehta S, Chen T, Sun F (2003) Prediction of protein function using proteinprotein interaction data. J Comput Biol 10: 947–960. 13. Letovsky S, Kasif S (2003) Predicting protein function from protein/protein
interaction data: a probabilistic approach. Bioinformatics 19: i197–i204, Suppl. 1. 14. Karaoz U, Murali TM, Letovsky S, Zheng Y, Ding C, et al. (2004) Whole-genome annotation by using evidence integration in functional-linkage networks. Proc Natl Acad Sci USA 101: 2888–2893.
15. Yeang CH, Mak HC, McCuine S, Workman C, Jaakkola T, et al. (2005) Validation and refinement of gene-regulatory pathways on a network of physical interactions. Genome Biol 6: R62.
16. Rual JF, Venkatesan K, Hao T, THirozane-Kishikawa, Dricot A, et al. (2005) Towards a proteomescale map of the human protein-protein interaction network. Nature 437: 1173–1178.
17. Kelley R, Ideker T (2005) Systematic interpretation of genetic interactions using protein networks. Nat Biotechnol 23: 561–566.
18. Bu D, Zhao Y, Cai L, Xue H, Zhu X, et al. (2003) Topological structure analysis of the proteinprotein interaction network in budding yeast. Nucleic Acids Res 31: 2443–2450.
19. Uetz P, Giot L, Cagney G, Mansfield TA, Knight RSJJR, et al. (2000) A comprehensive analysis of protein-protein interactions in saccharomyces cerevisiae. Nature 403: 623–627.
20. Ito T, Chiba T, Ozawa R, Yoshida M, Hattori M, et al. (2001) A comprehensive two-hybrid analysis to explore the yeast protein interactome. Proc Natl Acad Sci USA 98: 4569–4574.
21. Gavin AC, Bo¨sche M, Krause R, Grandi P, Marzioch M, et al. (2002) Functional organization of the yeast proteome by systematic analysis of protein complexes. Nature 415: 141–147.
22. Ho Y, Gruhler A, Heilbut A, Bader GD, Moore L, et al. (2002) Systematic identification of protein complexes in saccharomyces cerevisiae by mass spectrometry. Nature 415: 180–183.
23. Cho RJ, Campbell MJ, Winzeler EA, Steinmetz L, Conway A, et al. (1998) A genome-wide transcriptional analysis of the mitotic cell cycle. Mol Cell 2: 65–73. 24. Hughes TR, Marton MJ, Jones AR, Roberts CJ, Stoughton R, et al. (2000) Functional discovery via a compendium of expression profiles. Cell 102: 109–126.
25. Tong AH, Evangelista M, Parsons AB, Xu H, Bader GD, et al. (2001) Systematic genetic analysis with ordered arrays of yeast deletion mutants. Science 294: 2364–2368.
26. Mewes HW, Frishman D, Gruber C, Geier B, Haase D, et al. (2002) Mips: a database for genomes and protein sequences. Nucleic Acids Res 30: 31–34. 27. Ashburner M, Ball CA, Blake JA, Botstein D, Butler H, et al. (2000) Gene
ontology: tool for the unification of biology. Nature Genet 25: 25–29. 28. Boccaletti S, Latora V, Moreno Y, Chavez M, Hwang D (2006) Complex
networks: Structure and dynamics. Phys Rep 424: 175–308.
29. Li D, Leyva I, Almendral JA, Sendin˜a-Nadal I, Buldu´ JM, et al. (2008) Synchronization interfaces and overlapping communities in complex networks. Phys Rev Lett 101: 168701.