ISSN 1549-3636
© 2010 Science Publications
Corresponding Author: Hassan H. Khalil, Department of Computer Science and Information Technology, University Putra Malaysia, 43400, Serdang, Malaysia
Three Dimension Reconstruction of Coronary Artery
Tree Using Single-View Cineangiogram
1
Hassan H. Khalil,
1Rahmita O.K. Rahmat,
2D.M. Zamrin,
1
Ramlan Mahmod and
1Norwati Mustapha
1
Department of Computer Science and Information Technology,
University Putra Malaysia, 43400, Serdang, Malaysia
2
Department of Surgery, Heart and Lung Centre, National University of Malaysia,
Medical Centre, HUKM, 56000 Cheras, Kuala Lumpur, Malaysia
Abstract: Problem statement: Whereas most of the conventional techniques propose using multi-view cineangiograms to reconstruct 3D objects this article proposes to integrate a Three Dimension (3D) model of the coronary artery tree using a standard single-view cineangiogram. Splitting the cineangiograms into non-sequenced and different angle views is how the data is supplied in this method. Each single view can be used to reconstruct a robust 3D model of the coronary artery from that angle of view. Although the dynamic variations of blood vessels curvature have been difficult to study in Two Dimension (2D) angiograms, there is both experimental and clinical evidence showing that 3D coronary reconstruction is very useful for surgery planning and clinical study. Approach: The algorithm has three stages. The first stage is the vessel extraction and labeling for each view for the purpose of constructing the 3D model, while in the second stage, the vessels information (x, y and z) will be saved in a data file to be forwarded to the next stage. Finally, we input the x, y and z of a specific coronary artery tree to the OPENGL library included in the software, which we developed and called Fast 3D (F3D) and which is displayed in R3. Results: Experimental evaluation has been done to clinical raw data sets where the experimental results revealed that the proposed algorithm has a robust 3D output. Conclusion: Results showed that our proposed algorithm has high robustness for a variety of image resolutions and voxel anisotropy.
Key words: Angiograms, 3D coronary artery tree, 3D reconstruction, single-view cineangiogram, 3D
model of coronary artery
INTRODUCTION
The main function of performing coronary angiograms is to guide physicians in medical diagnosis and also the treatment of cardiac patients. Major advances in coronary angiography have been brought about by virtue of the medical imaging techniques, including biplane angiography and in some applications Digital Subtraction Angiography (DSA) (Baim, 2005). In this context, 3D angiograms are very often used to make integral diagnosis and prognosis of various vascular diseases. They offer comprehensive information on blood circulations of interest (Wong and Chung, 2008). These surgical and medical therapies become more sophisticated signifying the increasing importance of quantitative analysis of angiographic images in order to understand the configuration of the coronary arteries.
application has a long history (Sato et al., 1998). However, 3D extensions of the developed methods have still not been emphasized. Although a recent study concentrated on 3D extensions, the investigation and applied strategy in the R3 domain was not sufficient in terms of the filter design and experimental presentation of its usefulness (Sato et al., 1998).
Even though 2D images do not offer much information, we tried to solve this problem by using the intensity value. We propose here an automated algorithm to reconstruct the coronary artery vessels in 3D using a 2D single-view cineangiogram. Following a deep study and investigation, including the complications that physicians have to face through heart surgeries and the approaches used to solve them, we started working on our algorithm. Most of the conventional algorithms used multi-view cineangiograms to reconstruct 3D blood vessels while ours uses a single-view angiogram to integrate the 3D shape. Using the single-view, we will be saving data and time, which is an important factor in the medical field. The first step in our algorithm will be the vessels extraction where we highlight the vessels in the angiogram and ignore the rest. This is like detecting the topology of the coronary artery tree in a single-view cineangiogram. The second step is to extract the information we need from these 2D vessels and project them to the R3 for viewing purposes. This algorithm can be a great tool to help heart specialists screen a larger population of vessel abnormalities, have better surgery management and perform more scientific research and others. The algorithm works as follows:
1. Extract vessels out of the single-view angiogram (using the improved algorithm to do the extraction) 2. Save the information of the 2D extracted vessels
(x, y and z) in a data file
3. Project the data file from step (3) to F3D algorithm to construct a 3D shape of the coronary artery tree
MATERIALS AND METHODS
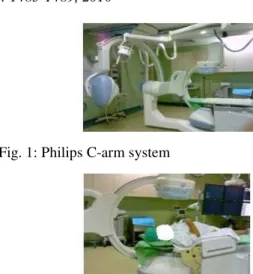
Materials and methods present the steps for constructing 3D coronary artery trees from 2D angiograms. All the angiograms used in this work were taken from one of the Malaysian hospitals (PPUKM). By multiple visits to the hospital and studying the C-arm system, we were able to gather more information concerning what the physicians need to accomplish in their job. Figure 1 shows a C-arm machine and Fig. 2 shows it with a patient in the process of stenoses diagnosing.
Fig. 1: Philips C-arm system
Fig. 2: Patient in the middle of the C-arm system
Vessel extraction: In this step we will briefly explain our improved vessel extraction process. Many vessel extraction algorithms were done in the past and each one of them has its own advantages and limitations. Hoover et al. (2000) proposed to extract the blood vessels of retina images and designed a robust algorithm for this purpose. We tried to implement their algorithm on our data but as we expected the results were not good. We had to improve it and change its functionality to fit with our data because angiograms and retina are different in the kind of information they provide. The improvement involved changing the thresholding way and value to extract blood vessels out of our angiograms with good topology and noise free. In their algorithm they used the output of a matched filter, Eq. 1, as the threshold value while in our algorithm we will use the Gaussian equation with variable variance to pick up the threshold value, as indicated in Eq. 2:
T=MFR(P) (1)
Where:
T = The threshold value of P pixel MFR = The matched filter
(x b) G(x) a * e
2 2 − − =
σ (2)
Where:
a, b > 0 = Constants
σ2 = The variance and its range is 1 ≤σ2≤ 2 x = An image’s pixel
Fig. 3: Extracted Vessels in gray scale values
Fig. 4: Flowchart of the 3D reconstruction algorithm
The extracted coronary artery vessels will be put into our 3D algorithm. Since angiograms are in gray scale format, by highlighting the vessels in the foreground and ignoring the background and setting it to zero value, the final output image will be with gray scale vessels, as indicated in Fig. 3. The information needed to construct the 3D shape will be extracted from the final image of gray scale vessels. A flowchart of the 3D reconstruction algorithm is shown in Fig. 4.
Data files: An explanation of how to extract and save information from the 2D images of the extracted vessels is presented here. The information required to be extracted from a 2D image include the x, y and z dimensions. Since, a 2D image does not offer adequate information, we had to study and analyze the objects of an image.
Fig. 5: z values of the extracted vessels
The analysis showed us that the intensity of the vessels can be used as the third dimension (z) to construct a 3D shape. The intensity of the vessels depends totally on the contrast dye that a cardiologist injects inside them through the process of stenosis detection. The injection process happens after the medical team sets the C-arm in a position that can show most of the vessels in a single-view. They keep rotating the C-arm through different angles and when the position is good they inject the dye and start capturing angiograms. The dye is injected at a constant rate and is distributed through the arteries equally. The far artery, which falls far from the x-ray camera, will be darker (z value is larger) and vice versa. That is why we can depend on the z value of each pixel to indicate its location in R3 depending on the pixel’s intensity value. The x and y indices of a pixel will be used to set the location as well.
The x and y values are the index rows and columns of the object (vessel) in an image. Equation 3 and Fig. 5 below show the use of the gray scale value as the z dimension and the range of intensity values. The x, y and z of each pixel of the extracted vessels will be saved in a data file, i.e., a data file for each single-view angiogram. To construct a 3D coronary artery tree out of any data file, we project it to our F3D program to reconstruct the 3D shape and show it in R3:
z(x, y)=g(x, y), 1≤g(x, y)≤256 (3)
RESULTS
The vision system is implemented using a Microsoft Windows Professional, 1.5 GHz computer with 3 GB memory. We have tested the modeling technique on a set of clinical angiograms.
Fig. 6: 3D output of a single-view angiogram
(a) (b)
(c) (d)
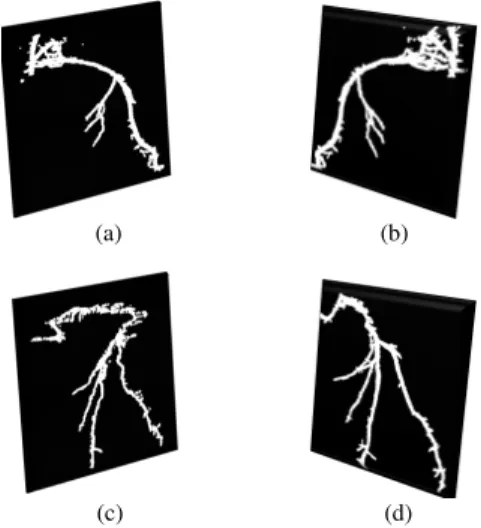
Fig. 7: Four 3D shapes of different angiograms from different angles
(a) (b)
(c) (d)
Fig. 8: Four 3D shapes of different angiograms from different angles
Each angiogram represents a single-view of a specific angle, which were set by a cardiologist to check the existence of any stenosis. The range of angiogram image size is 500 × 500. Figure 6 and 7 illustrate 2D angiograms and with the 3D that was constructed from them. Figure 6 shows an example of a 3D reconstruction of a coronary artery tree out of a 2D angiogram. The output screen is divided into two parts. The left one indicates a user help screen showing the keys to control the 3D output in terms of rotation, translation, zoom in-out and the rate of rotation speed. The right screen is to view the 3D shape. Figure 7 shows four angiograms that were taken from different angles from which the 3D shapes were reconstructed. The above coronary artery trees were projected without any enhancement process by the paint service, however, in Fig. 8 we show 3D outputs after omitting some tiny vessels while retaining the main ones.
DISCUSSION
The proposed algorithm in this study created a new and quicker method of 3D reconstruction from a single-view cineangiogram. The idea of this algorithm came from the need of the physicians and surgeons for stenosis diagnoses and surgery management using 3D shapes. The information for the extracted coronary artery tree vessels (x, y, z) is saved in a data file and is then projected to R3 to create a 3D shape with a clear view and full specifications.
We used VC++ and OPENGL library to build the executable files, which produced exceptional software, called Fast 3 Dimension (F3D,) to receive the 2D angiogram and convert it to a 3D object. The software was built using Delphi programming language. This language is powerful with OPENGL tools for 3D shape construction. The software contains a good interface that any user can use and the output is obtained in a few seconds. One of the limitations in the work is that the 3D output is shown as points in R3, which can cause minor disturbance in the output when we view it from the side. However, it is still very good using the front or back views. For this reason, we suggest future work, to improve the algorithm to connect these 3D points by lines and then show them to the user. The line connections will increase the output accuracy.
CONCLUSION
reconstruction from a single-view cineangiogram. Most of the previous algorithms depended on two or more views to reconstruct blood vessels in 3D and from different kinds of medical images. Our proposal is to use only a single-view of angiogram images. Also, for the first time, the gray scale value was proposed as the z dimension in our algorithm. The results show that the algorithm is robust, fast and efficient to reconstruct any coronary artery tree in 3D out of an angiogram image.
ACKNOWLEDGMENT
The study was granted under E-science (scfund-mosti) and under the title of: “A computer Assisted Diagnosis and Intervention of Coronary Arterial Stenosis” and with the number: 01-01- 04-SF0991.
REFERENCES
Baim, D.S., 2005. Grossman’s Cardiac Catheterization, Angiography and Intervention. 7th Edn., Lippincott Williams and Wilkins, Philadelphia, ISBN: 0781755670, pp: 992.
Canny, J., 1983. Finding edges and lines in images, MIT Artificial Intelligence Laboratory. http://www.eecs.berkeley.edu/~jfc/papers/old/AIT R-720.pdf
Hoover, A.D., V. Kouznetsova and M. Goldbaum, 2000. Locating blood vessels in retinal images by piecewise thresholdprobing of a matched filter response. IEEE Trans. Med. Imag., 19: 203-210. DOI: 10.1109/42.845178
Sato, Y., S. Nakajima, N. Shiraga, H. Atsumi and S. Yoshida et al., 1998. Three-dimensional multi-scale line filter for segmentation and visualization of curvilinear structures in medical images. Med. Image Anal., 2: 143-168. DOI: 10.1016/S1361-8415(98)80009-1
Wong, W. and A. Chung, 2008. Principal curves to extract vessels in 3D angiograms. Proceeding of the IEEE Computer Society Conference on Computer Vision and Pattern Recognition Workshops, June 23-28, IEEE Xplore Press,
Anchorage, AK., pp: 1-8. DOI: