Recapitulation of Functional
Microvessels for the Study of Endothelial
Shear Response, Nitric Oxide and [Ca
2+
]
i
Xiang Li1☯, Sulei Xu1☯, Pingnian He1
*, Yuxin Liu2*
1Department of Cellular and Molecular Physiology, Penn State University, School of Medicine, Hershey, Pennsylvania, United States of America,2Lane Department of Computer Science and Electrical Engineering, West Virginia University, Morgantown, West Virginia, United States of America
☯These authors contributed equally to this work.
*pinghe@hmc.psu.edu(PH);yuxin.liu@mail.wvu.edu(YL)
Abstract
Microfluidic technologies enablein vitrostudies to closely simulatein vivomicrovessel
envi-ronment with complexity. Such method overcomes certain constrains of the statically cul-tured endothelial monolayers and enables the cells grow under physiological range of shear flow with geometry similar to microvesselsin vivo. However, there are still existing
knowl-edge gaps and lack of convincing evidence to demonstrate and quantify key biological fea-tures of the microfluidic microvessels. In this paper, using advanced micromanufacturing and microfluidic technologies, we presented an engineered microvessel model that mim-icked the dimensions and network structures ofin vivomicrovessels with a long-term and
continuous perfusion capability, as well as high-resolution and real-time imaging capability. Through direct comparisons with studies conducted in intact microvessels, our results dem-onstrated that the cultured microvessels formed under perfused conditions recapitulated certain key features of the microvesselsin vivo. In particular, primary human umbilical vein
endothelial cells were successfully cultured the entire inner surfaces of the microchannel network with well-developed junctions indicated by VE-cadherin staining. The morphologi-cal and proliferative responses of endothelial cells to shear stresses were quantified under different flow conditions which was simulated with three-dimensional shear dependent nu-merical flow model. Furthermore, we successfully measured agonist-induced changes in in-tracellular Ca2+concentration and nitric oxide production at individual endothelial cell levels using fluorescence imaging. The results were comparable to those derived from individually perfused intact venules. Within vivovalidation of its functionalities, our microfluidic model
demonstrates a great potential for biological applications and bridges the gaps betweenin vitroandin vivomicrovascular research.
a11111
OPEN ACCESS
Citation:Li X, Xu S, He P, Liu Y (2015)In Vitro
Recapitulation of Functional Microvessels for the Study of Endothelial Shear Response, Nitric Oxide and [Ca2+]i. PLoS ONE 10(5): e0126797.
doi:10.1371/journal.pone.0126797
Academic Editor:Mária A. Deli, Hungarian Academy of Sciences, HUNGARY
Received:October 20, 2014
Accepted:April 7, 2015
Published:May 12, 2015
Copyright:© 2015 Li et al. This is an open access article distributed under the terms of theCreative Commons Attribution License, which permits unrestricted use, distribution, and reproduction in any medium, provided the original author and source are credited.
Data Availability Statement:All relevant data are within the paper.
Funding:This work was supported by the National Science Foundation (NSF-1227359) and by WV EPSCoR program (EPS-1003907) funded by the National Science Foundation (Liu, Y.); and by National Heart, Lung, and Blood Institute grants HL56237 and HL084338 (He, P.) and American Heart Association Great Rivers Affiliate 12PRE11470010 pre-doctoral fellowship (Xu, S.).
Introduction
The development of microfluidic devices has been embraced by engineers over two decades. However, the adaptation and application of microfluidics in mainstream biology is still lacking. According to the recent summary, the majority publications of microfluidics are still in engi-neering journals (85%) [1]. The improved performance of microfluidic devices have not been
well accepted by many biologists and applied to biological studies [1,2]. More experimental
ev-idence is needed to demonstrate that microfluidics has the advantage over the conventional transwell assays and macroscale culture dish/glass slide approaches for developing more physi-ologically relevantin vitromicrovessel model. In this paper we continue our previous efforts in
developingin vitrofunctional microvessels that could provide a platform for the study of
com-plex vascular phenomena [3].
Several groups have pioneered in the development of advanced microvessel models using
micromanufacturing and microfluidic techniques [4–8]. Each of those microvessel models
demonstrated unique features and biological applications, such as the use of either polymer or hydrogel to template the growth of vascular endothelial cells (ECs) [4], co-cultured ECs with other vascular cells [5], simulating the vascular geometry pattern and studying vascular geome-try associated endothelial leukocyte interactions [8], as well as investigating EC involved
angio-genesis and thrombosis [5–7]. However, there have been very limited reports for microvascular
function related changes in endothelial cell signaling in microfluidic based systems.
Nitric oxide (NO) is essential for controlling vascular tone and resistance in arterioles, and regulating vascular wall adhesiveness and permeability in venules [9–12]. Additionally, the
en-dothelial intracellular Ca2+concentration [Ca2+]ihas been recognized to play an important
role in microvessel permeability [11,13–18], angiogenesis [19] and morphogenesis [20].
Al-though a few studies previously reported the use of DAF-2 DA in microfluidic network, some
of them only showed DAF-2 loading [21,22], and others were lack of appropriate resolution
and data analysis [23]. Up-to-date, the agonist-induced dynamic changes in endothelial [Ca2+]i
and NO production have not been well demonstrated in previous microfluidic based studies, especially no quantitative measurements were conducted with temporal and spatial resolution.
In this paper, we presented anin vitroformation of a microvessel network and directly
com-pared the key features with the results derived from microvesselsin vivo. Continuous
micro-fluidic perfusion is able to control the mass transfer and flow shear stresses precisely. A confluent endothelial monolayer was formed and fully covered inside the entire microchannel network. The vascular endothelial adherens junctions were confirmed by VE-cadherin immu-nofluorescence staining. Cell morphology changes in response to different patterns of shear stress were evaluated by staining endothelial cell F-actin. Additionally, following our
estab-lished methods developed in individually perfused microvessel, endothelial [Ca2+]iand NO
production were quantitatively measured using a real-time and high-resolution imaging under
controlled and stimulated conditions. The main objectives of this study are to develop anin
vitrofunctional microvessel network, validate some of the key biological features of microvessel
endothelial cells, and provide a validatedin vitrotool for the future studies of human
endothe-lial cells under physiological and pathological conditions.
Materials and Methods
Design and fabrication
The microchannel network designed in this paper was a three-level branching microchannels.
As shown inFig 1A, the width of microchannels was 100μm, 126μm, and 159μm,
mold fabrication and polydimethylsiloxane (PDMS) soft lithography was used for the micro-fluidic microchannel network fabrication as shown in Fig1B–1G[24]. Briefly, a silicon wafer
was rinsed with acetone and methanol and baked on a hot plate (150°C) over 30 minutes for dehydration (Fig 1B). SU-8 photoresist (SU8-2050, Microchem, Westborough, MA USA) was
spun-coated over the pre-cleaned silicon wafer with a thickness of 100μm, and then the wafer
was baked on the hot plate at 65°C and 95°C, respectively (Fig 1C). The designed patterns were transferred from a film mask to a SU-8 thin film after the UV light exposure (OAI model 150,
San Antonio, TX USA) (Fig 1D), post baking, and the development as shown inFig 1E. After
the hard baking at 150°C, the developed patterns as the master mold were ready for PDMS soft
Fig 1. The schematic design and fabrication procedures for the microfluidic microchannel network.A. The schematic design shows the bifurcation angle and the widths of microchannels at differnet levels. B. A pre-cleaned silicon substrate. C. SU-8 photoresist was spun-coated onto the silicon wafer. D. The photoresist was exposed to UV light through the photomask. E. The developed microchannel network pattern was used as the master mold. F. PDMS mixing solution was cast onto the master mold and cured. G. The inlet and the outlet were punched and the microchannel device was bonded onto a glass substrate with a spun-coated thin PDMS layer.
lithography. PDMS (Slygard 184, Dow Chemical, Midland, MI USA) was mixed at a weight ratio of 10:1, and cast onto the master mold to replicate the microchannel patterns (Fig 1F). PDMS was cured and peeled off from the master mold after it was baked in an oven at 60°C for 3 hours. The inlet and the outlet, which were used for the cell loading, tubing connections, media and reagent perfusion, and waste collection, were punched with a puncher (1 mm, Mil-tex, Plainsboro, NJ USA). In a typical confocal microscopy system, an objective lens with high numerical apertures (NA) has a limited working distance in a range of a few hundred microns [25]. Therefore, to incorporate the microfluidic devices to our confocal system, the number 1 glass coverslip (thickness of 130–160μm, Fisher Scientific) spun-coated with a thin layer of
PDMS (thickness of 20μm) was used as the substrate for the device bonding (Fig 1G). A
per-manent bonding was created to seal the microchannels completely after oxygen plasma treat-ment (50 W, 100 mtorr) of PDMS for 30 seconds.
Viscosity measurement and numerical simulation
To estimate the shear stresses of the culture media under the experimental conditions, the vis-cosity of the cell culture medium containing 10% fetal bovine serum (FBS) was measured using a Wells-Brookfield cone/plate digital viscometer (LVTDCP, cone # CP-40, Stoughton, MA, USA) at 37°C, with shear rate at 90, 225, 450 sec-1, respectively. As shown inFig 2A, the media viscosity (5 repeated measurements) measured at the shear rate range showed some shear rate dependence, an indication of non-Newtonian behavior. Based on these measurements, the dy-namic viscosity (μ) as a function of shear rate (γ) was fitted by an equationμ= mγn-1, where an
exponent n is 0.789 and a flow consistency index (m) is 3.4282.
We then conducted numerical simulations using a three-dimensional, finite element model in the commercial software COMSOL Multiphysics (Version 4.0.0.982, COMSOL Inc., Bur-lington, MA, USA). Stationary incompressible Navier-Stokes equations were chosen as govern-ing equations for the fluids, and no-slip wall boundary condition was set along the internal surfaces of the microchannels. The implemented boundary conditions at the inlet and outlet were constant inlet velocity and zero external pressure, respectively. Culture medium was se-lected as the reference fluid during the simulation with a constant density (1020 kg/m3), and a power law dynamic viscosity model was applied based on the fitted equation derived from measured culture media viscosities (Fig 2A). PARallel sparse DIrect linear SOlver (PARDISO) was used to execute the iteration, and the model was considered converging when the estimat-ed error was less than 2.2e-11. The simulated wall shear stress distribution along the entire
net-work and the selected regions of channels were shown in Fig2Band2C, respectively.
Cell culture
Primary human umbilical vein endothelial cells (HUVECs) were purchased from Lonza. The cells were maintained in MCDB 131 culture medium (Gibco, Carlsbad, CA USA) supple-mented with 10% FBS, 1% L-glutamine, 0.1% Gentamicin, 0.05% bovine brain extract (9mg/ mL), 0.25% endothelial cell growth supplement (3mg/mL), and 0.1% heparin (25mg/mL) in tissue cultured flasks, which were pre-coated with 0.2% gelatin. The cell culture was performed
in a humidified atmosphere of 5% CO2at 37°C, and the cells between passage 2 and passage 5
were used for this study. When the cultured HUVECs reached confluent, the cells were har-vested and re-suspended in 8% Dextran (mol wt 70,000, Sigma, St. Louis, MO, USA) diluted with MCDB 131 culture medium. Dextran was used to increase the medium viscosity for better controlling cell seeding inside the microchannels.
Prior to cell loading, the device was treated with oxygen plasma for 3–5 minutes to reduce
with deionized water and sterilized under the UV light exposure for 8 hours in a laminar bio-safety hood. After UV sterilization, the device was rinsed with 1× phosphate buffered saline
(PBS), coated with fibronectin diluted in 1×PBS (100μg/mL, Gibco, Carlsbad, CA USA) along
the entire inner surfaces of PDMS channel walls, and incubated at 4°C inside a refrigerator for overnight. After this, the device was rinsed with 1×PBS again to remove the free fibronectin so-lution completely, and loaded with cell media. Finally, the device was incubated for 15 minutes at 37°C and was ready for cell loading.
To load the cells, a droplet (10μL) of HUVECs was placed at the inlet, and a slow flow was
created by either tilting the device, or placing a glass pasteur pipette (the inner diameter of the pipets is around 1.5 mm, VWR) at the outlet. Capillary action through the microchannels was gently introduced by the glass pipette and the cells slowly moved along the media into the channels. The key for a successful cell loading was to control the flow velocity very slowly,
oth-erwise, most of the cells cannot attach uniformly inside the microchannels. After 15–20
min-utes incubation in the incubator, the attached cells on the PDMS channel walls can be visually
Fig 2. Viscosity measurement of culture media and numerical simulation for the wall shear stress distribution of the microchannel network.A. Viscosity measurement of culture media perfusate. Filled triangles (▲) represent viscosity of the culture medium with 10% FBS; Open triangles (4) represent the viscosity of standard Newtonian calibration solution. Dotted and dashed lines are their trend lines, respectively. B1. COMSOL simulation shows the wall shear stress distribution through the entire network
under high flow rate condition. B2. The wall shear stress distribution of the selected region in B1. C1.
COMSOL simulation shows the wall shear stress distribution through the entire network under low flow rate condition. C2. The wall shear stress distribution of the selected region in C1.
confirmed under the microscope. An additional loading can be performed if necessary. After a satisfied cell seeding density was reached, the device was gently rinsed with the media to re-move the dextran solution. A complete attachment requires five to six hours. Long-term con-tinuous perfusion was set up by a syringe pump system (Harvard Apparatus, Holliston, MA,
USA) with a steady flow rate of 0.35μL/min. The perfusion can last up to two weeks, and can
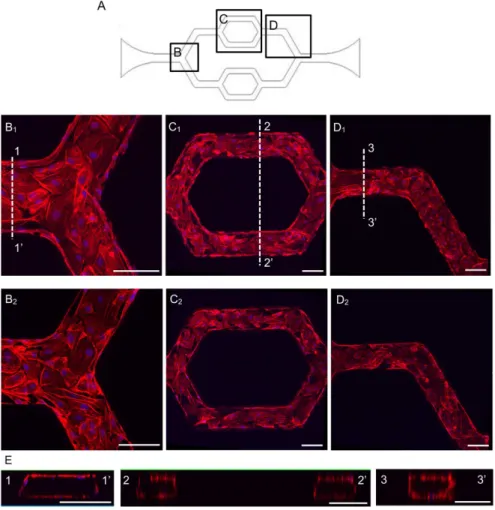
be adjusted to maintain different flow patterns if necessary [3]. The attached cells were grown under the perfusion along the entire inner surfaces of microchannels, which was illustrated by
F-actin staining.Fig 3shows the confocal images of endothelial cell F-actin at upper and lower
layers of endothelial cells within the channels, as well as the three-dimensional reconstructed cross sectional images at different channel regions. The studies of cell morphology, endothelial cell junction, endothelial [Ca2+]i, and NO responses to agonist were conducted on either the
lower or upper surfaces of the microchannels and no significant differences were observed be-tween upper and lower stack of images.
Fig 3. The representative confocal images show the HUVECs successfully cultured throughout the inner surfaces of the entire microchannel network.A. The schematic image of the network with selected regions as shown in B-D. B-D. HUVECs stained with F-actin and cell nuclei in each region, where B1, C1and
D1show the upper layer of endothelial cells at different location of the channel. B2, C2and D2show the lower
layer of the endothelial cells at different locations of the channel. E. The three-dimensional reconstructed cross-sectional images at each region. The locations of the cross-sections are indicated as 1–1’, 2–2’, and 3–3’in B1-D1, respectively. Each scale bar is 100μm.
Confocal fluorescence imaging of intracellular calcium concentration
([Ca
2+]
i)
Endothelial [Ca2+]iwas measured in Fluo-4 AM loaded endothelial cells on a Leica TCS SL
confocal microscope with a Leica ×25 objective (NA: 0.95). An argon laser (488 nm) at 50%
power was used for excitation, and the emission band was 510–530 nm. To minimize
photo-bleaching, fluo-4 images were collected using a 512 × 512 scan format at a z-step of 2μm.
Stacks of images were collected from the same group of HUVECs with 20 seconds intervals.
Each network device was first loaded with fluo-4 AM (5μM) for 40 minutes followed by
albu-min-Ringer perfusion to rinse the lumen fluo-4 AM before control images were collected. Quantitative analysis of endothelial [Ca2+]iat the individual endothelial cell level was
con-ducted using manually selected regions of interests (ROIs) along the microchannels. Each ROI covered the area of one individual endothelial cell, as indicated by the fluorescence outline. The changes in endothelial [Ca2+]iat the cellular levels were quantified by calculating the mean
fluorescence intensity (FI) of each stack of ROIs after the subtraction of the background auto fluorescence. The percent change in FI was expressed as FI/FI0100, where FI0was the initial
baseline FI of fluo-4. Details have been described previously [11].
Confocal fluorescence imaging of nitric oxide production
Endothelial NO levels were investigated at the cellular levels in the microvessel network using DAF-2 DA, a membrane-permeable fluorescent indicator for NO, and fluorescence imaging. Experiments were performed on a Nikon Diaphod 300 microscope equipped with a 12-bit
digi-tal CCD camera (ORCA; Hamamatsu) and a computer controlled shutter (Lambda 10–2;
Sut-ter Instrument; Novato, CA). A 75-W xenon lamp was used as the light source. The excitation wavelength for DAF-2 was selected by an interference filter (480/40 nm), and emission was separated by a dichroic mirror (505 nm) and a band-pass barrier (535/50 nM). All the images were acquired and analysed using Metafluor software (Universal Imaging).
Each network device was first perfused with albumin-Ringer solution containing DAF-2
DA (5μM) for 35~40 minutes before collecting DAF-2 images. DAF-2 DA was present in the
perfusate throughout the experimental duration [26]. All images were collected from a group of HUVECs located in the same focal plane using a Nikon Fluor lens (x20, NA: 0.75). Data analysis was conducted at the individual endothelial cell level using manually selected ROIs. Each ROI covered the area of one individual cell as indicated by the fluorescence outline. The PDMS auto fluorescence was subtracted from all of the measured fluorescence intensities (FIs). The basal NO production rate was calculated from the slope of the mean FI increase during albumin-Ringer perfusion after DAF-2 loading was reached the steady state. The changes in
FIDAFupon adenosine triphosphate (ATP) stimulation were expressed as the net changes in FI
(ΔFI). FI was expressed in arbitrary units (AU) and identical instrumental settings were used for all of the experiments. The rate of FIDAFchange was derived by first differential conversion
of cumulative FIDAFover time. Details have been described previously [12,26].
Immunofluorescent staining
perfused for 1 hour at the room temperature. DRAQ 5 (Biostatus, Shepshed Leicestershire, UK) was used for cell nuclei staining. Following the similar fixing, blocking, and permeabilizing procedures, F-actin was labeled by perfusing phalloidin-Alexa 633 (Sigma, St. Louis, MO, USA) for 10 minutes, followed by the DRAQ5 nuclei staining. Fluorescent images were ob-tained using Nikon Ti-E inverted microscope (Chiyoda, Tokyo, Japan) and a confocal laser-scanning microscope (Leica TCS SL). The objective lens used for Nikon Ti-E was Nikon Plan Fluor X10, NA 0.3 Ph1 DLL. The images were acquired at 1390 × 1040 pixel and the pixel size
is 0.645μm. The objective lens used for the confocal microscope (Leica TCS SL) was Leica
APO X25, NA 0.95 W CORR using 1024 × 1024 format and the pixel size is 0.58μm.
VE-cadherin staining in individual venules was performed following single vessel perfusion
procedure in the mesentery of Sprague-Dawley rats (2–3 mo old, 220 to 250 g; Hilltop
Labora-tory Animal, Scottdale, PA). Details have been described previously [14,27]. In brief, the rat was anesthetized with Pentobarbital sodium, given subcutaneously with initial dosage at 65 mg/kg body wt and an additional 3 mg/dose given as needed. A midline surgical incision (1.5 to 2 cm) was made in the abdominal wall and the mesentery was gently moved out of the ab-dominal cavity and spread over a coverslip for single vessel perfusion. The selected venule was then cannulated and perfused with BSA-Ringer perfusate first to remove the blood in the vessel lumen before fixation. The fixation and antibody staining procedures are identical to those de-scribed in cultured microvessels.
Cell morphology analysis in response to shear stress
To study the actin cytoskeleton and HUVECs morphology changes under shear stresses, differ-ent scenarios were performed to vary the culture and shear flow conditions. Detailed experi-mental conditions are listed inTable 1. Briefly, after initial seeding three different flow
conditions were set for the same patterned networks in different devices as shown inTable 1:
Low shear culture, low shear test (LSC-LST); Low shear culture (till the ECs reached conflu-ence), high shear test (LSC-HST); and high shear culture, high shear test (HSC-HST). The transition from low shear stress to high shear stress was gradually applied by programming a step function (10 steps of increase in 18 hours) using the syringe pump (Harvard Apparatus, Holliston, MA, USA).
Quantitative analysis of F-actin staining images was performed to examine HUVEC mor-phology changes (i.e. cell surface area) in responses to different levels of shear stresses. The sur-face area for each individual cell was acquired by performing area measurement function using NIS Elements software (Nikon, Chiyoda, Tokyo, Japan) with manually adjusting of ROIs. Each ROI covered the area of one individual cell. For statistical analysis, data was presented as the mean ± standard error (SE) and each individual experiment was performed at least three times (n3). The results were evaluated by the t test and single factor analysis of variance
(ANOVA).
Table 1. Summary of flow conditions applied to cultured microvessels.
Culture and test condition
Flow rate for culture/ test (μL/min)
Wall shear stress at the selected region (dyne/cm2)
LSC-LST Low shear culture-Low shear test
0.35/0.35 1.0
LSC-HST Low shear culture-High shear test
0.35/4.05 1.0, then 10
HSC-HST High shear culture-High shear test
4.05/4.05 10
Results
Characterization of endothelial adherens junctions in microvessels
developed in microchannel network
With the initial cell loading concentrations of 2 ~ 4 × 10⁶cells/mL, confluent monolayers
de-veloped within 3–4 days under a constant flow of culture media. The three-dimensional images
of F-actin staining are shown inFig 3. Under the same culture conditions, we examined the
junctional formation between ECs as an indication of endothelial barrier function. VE-cadherin, an important adhesion protein for the maintenance and control of the junctions be-tween endothelial cells, was illustrated with antibody staining. To make a direct comparison of VE-cadherin distribution between cultured ECs grown under static and continuous flow condi-tions, and EC junctions in intact microvessels, we also conducted VE-cadherin staining in
stati-cally cultured HUVECs and in intact venules of rat mesentery. Fig4B–4Dshows the confocal
images of VE-cadherin and nuclei staining at different regions of the microchannel. The confo-cal images illustrate that VE-cadherin was well developed throughout the entire network, dem-onstrating a continuous distribution between ECs with less lattice-like structure as that often appeared in statically cultured endothelial monolayers (Fig 4E). The smooth and continuous VE-cadherin pattern shown in the microfluidic microvessels is similar to that observed in in-tact microvessels (Fig 4F), suggesting that the continuous flow condition during cell growth provide a better environment for appropriate EC spreading, viability, proliferation, and forma-tion of juncforma-tions.
Endothelial cell responses to shear stress
Flow related shear stress has been shown to induce redistribution of F-actin in aortic vessel seg-ment [28], and changes in cell shape and cytoskeletal structure in cultured ECs [29]. To quanti-fy the shear stresses within the cultured microvessel network, the numerical simulation was
conducted as those shown in Fig2Band2C. The shear rate dependent non-Newtonian culture
medium simulation showed slightly larger variations of wall shear stress at the bifurcation and turning region of the microchannel networks comparing to the Newtonian flow. However, the wall shear stress within the selected straight regions in the devices (Fig 5A) were still uniformly
distributed and the magnitude of wall shear stress were 10 dyne/cm2under the flow rate
4.05μL/min, and 1.0 dyne/cm2under the flow rate 0.35μL/min within the selected regions in
the devices as shown inFig 2B2and2C2, which are in the range of the shear stress distribution
of venulesin vivo[30,31]. Based on these simulations, we evaluated the cytoskeletal
rearrange-ment of F-actin fibers and cell shape changes in response to three patterns of flow related shear stress within the microchannel networks: continuous low shear without a change (LSC-LST); low shear culture with high shear exposure (LSC-HST); and continuous high shear exposure (HSC-HST). The flow rate and correlated shear stress under each condition are listed in Table 1. Under the LSC-LST conditions, about 70% of the cells showed cobblestone pattern with dominated peripheral F-actin, and 30% of the HUVECs showed elongated cell shape with increased central stress fibers aligned along the flow direction. Under LSC-HST and HSC-HST conditions, about 50% of the cells were elongated with distinct stress fibers along the flow
di-rection. Fig5B–5Dshows representative images from each group andFig 5Eshows the
Measurements of endothelial calcium concentration ([Ca
2+]
i) in response
to ATP
Increases in endothelial [Ca2+]ihave been demonstrated to play important roles in regulation
of a variety of microvessel functions including endothelial barrier function, i.e. microvessel per-meability. In individually perfused microvessels, inflammatory mediator commonly induces transient increases in endothelial [Ca2+]ifollowed by transient increases in microvessel
perme-ability. To validate the biological functions of the microvessels developed under flow in our
model, we applied the method developed in individually perfused intact microvessels [11,17]
to the microvessels developed in the microchannel network and quantitatively measured the
changes in endothelial [Ca2+]iwhen the microvessel was exposed to ATP. Experiments were
Fig 4. The representative immunofluorescent staining confocal images demonstrate the VE-Cadherin distributions of cultured vascular network, a statically cultured endothelial monolayer, and an intact rat mesenteric venule.A. The schematic image of the network with selected regions as shown in B-D. B-C. VE-Cadherin and cell nuclei staining were shown at the first and third branching regions. D1-D2. VE-Cadherin
and cell nuclei staining were shown at the top and bottom surfaces of the second branching regions, respectively. E. VE-cadherin junction distribution of HUVECs cultured under static condition. F. VE-cadherin distribution of endothelial cells from an individually perfused intact rat venule.
conducted in four devices with fluo-4 loaded endothelial cells. When ATP (10μM) was
per-fused to each device, [Ca2+]iin all endothelial cells under the view reached a peak at 35 ± 10
sec-onds with the mean peak [Ca2+]iat 187 ± 22% of the control. Representative fluo-4 images and
the fluorescence quantification are shown inFig 6. The transient pattern is similar to what we
observed in individually perfused intact microvessels [17,18].
Fig 5. HUVECs’responses to different levels of shear stress: The morphology changes illustrated by F-actin staining.A. The schematic image of the network showing the selected region for shear stress test. B-D. Confocal images show F-actin redistribution under different perfusion conditions. E.
Comparison of the cell surface areas (upper Y axis) and cell density (number of cells per 0.5 mm2, lower Y axis) between static culture and the three testing
groups: LSC-LST (419 cells in 6 devices); LSC-HST (412 cells in 6 devices); and HSC-HST (235 cells in 3 devices). The percentage of aligned and non-aligned cells are noted on each of the bar. All data are reported as the means±SE of independent experiment.*: P<0.05;**: P<0.01;***: P<0.001.
Measurement of ATP-induced nitric oxide production
In intact venules, it has been demonstrated that inflammatory mediator-induced increases in
endothelial [Ca2+]iwas associated with increased NO production, and both increased
endothe-lial [Ca2+]iand NO production contribute to the increases in microvessel permeability [11,12].
With demonstrated ATP-induced increases in endothelial [Ca2+]i, we further measured NO
production in response to ATP in DAF-2 loaded endothelial cells lining the microchannels.
Each device was first perfused with albumin-Ringer solution containing DAF-2 DA (5μM)
for 35~40 minutes before collecting images. After the loading phase, the rate change of DAF-2
fluorescence (FIDAF) under control conditions was 0.15 ± 0.05 AU per min. When ATP
(10μM) was added to the perfusate, the rate change in FIDAFwas significantly increased. The
peak rate of FIDAFincrease was 1.18 ± 0.37 AU per min. The increased FIDAFreturned to the
control level after 10~15 minutes of ATP exposure. Data were derived from 3 devices with a total of 35 ROIs and 11 to 12 ROIs per vessel. NO donor, sodium nitroprusside (SNP), was added at the end of each experiment to verify the sufficiency of DAF-2 in the cells and the
spec-ificity of DAF-2 in response to NO.Fig 7shows the quantification of time-dependent changes
in FIDAFand correlated images from an individual experiment. The changes in slopes of the
FIDAFindicate the changes in NO production rates before and after ATP stimulation. The rate
of FIDAFincrease measured under control conditions is close to those observed in intact
Fig 6. ATP-induced endothelial cell [Ca2+]
iincrease in HUVECs cultured microchannel network.A.
Time course of ATP-induced changes in endothelial [Ca2+]
ifrom a representative experiment. B. Fluo-4
confocal images from one representative experiment before and after the start of ATP perfusion at 60 seconds and 160 seconds.
microvessels [9,26,32], indicating similar levels of basal NO production. Images inFig 7B
il-lustrate the ATP-induced cumulated increases in FIDAFat 10 minutes of ATP exposure.
Discussion
Our study presentedin vitroformation of a microvessel network using a microfluidic device
and characterized endothelial junctions, cellular responses to shear stresses, and quantitatively
measured the changes in endothelial [Ca2+]iand NO production before and after exposure to
ATP. The results demonstrated that this engineered microvessel network recapitulates the key aspects and fundamental functions ofin vivovenules, and reveals its promising utility for
bio-logical applications including studies with human samples.
With advanced microfabrication techniques, the flexibility to create patterns and scale sizes
provides users with arbitrary design options to mimic the geometries ofin vivo
microvascula-ture, which allows the functional studies involved in complex flow patterns found at vessel bi-furcations and in regions of high curvature that occurin vivo. This microfluidic microvessel
network on a thin glass substrate with a spin-coated PDMS thin film (average total thickness is 150–180μm) allows excellent light transmission and easy adaptation to both bright field and
fluorescence microscopy when using short working distance and large numerical aperture ob-jectives. Our study demonstrated that this device is capable for real-time and high-resolution imaging to detect changes in intracellular molecules and cell morphology using fluorescent markers, which is a necessary feature for biological studies. This modification is a further
prog-ress of applying our previous studies using endothelialized microvessel network [3,24].
Fig 7. ATP-induced NO production in HUVECs cultured microchannel network.A. Time dependent changes in FIDAF(left Y axis) from a representative
experiment before and after ATP (10μM) stimulation. The 1st differential conversion of cumulative FIDAF(df /dt, right Y axis) represents the NO production
rate (dash-dotted line). B. Representative DAF-2 fluorescence images. ATP induced significant increases in nitric oxide (NO)-DAF-2 fluorescence intensity (FI) relative to control (left). FIDAFwas further increased with the application of the NO donor sodium nitroprusside (SNP).
The main difference of using this microchannel network compared with traditional cell cul-ture is that the cells, instead of growing under static conditions at 2-dimensional flat surface, were growing in a three-dimensional channel with continuous flow, which made the cell
cul-ture environment closer to thein vivosituation. By conducting direct comparisons of cell
cul-ture under static conditions and under flow in a microchannel with intact microvessels, the
cultured microvessels showed junctional formation and cellular responses closer toin vivo
than traditional static EC monolayers. Our viscosity measurements showed non-Newtonian behavior of cultured media under the physiological shear range in venules. The numerical sim-ulation, with the implemented dynamic viscosity of the culture media, provided more accurate estimation of the wall shear stress distribution in the cultured microvessels. Based on the chan-nel dimensions and simulation, the applied shear stress was easily controlled within the range
of venous system (1 to 10 dyne/cm2) [30,31]. More importantly, our study characterized the
biological functions of these cultured microvessels under basal and stimulated conditions, and validated its utility for biological applications. Our results indicated that the endothelial cells grown under flow conditions formed better monolayers with well-developed junctions between
endothelial cells as that demonstrated by VE-cadherin staining. As shown inFig 3, the
HUVECs completely covered the entire inner surfaces of the channels including the corners and formed a completely enclosed network. Most importantly, the VE-cadherin staining showed a uniformly distributed band between endothelial cells within the network, which is similar to that observed in intact venules (Fig 4F) [14,27], and distinct from the intricate lat-tice-like structure commonly found in statically cultured endothelial monolayers (Fig 4E).
Previous studies of the endothelial F-actin rearrangement under shear stress are commonly
performed in flow chambers [33,34] and cone-and-plate viscometer [35–37]. The endothelial
cells usually reached confluence under static culture and then were exposed to higher shear stresses. In this study, we tested different shear flow conditions within the variations of mea-sured physiological range in venous system, including continues lower shear stresses
(LSC-LST), continues higher shear stresses (HSC-HST), and changing shear stress from low to high (LSC-HST), respectively. Under higher flow conditions, the decreased cell surface area and increased cell density indicated a role of shear in promoting EC proliferation. This phe-nomena has also been resported by other studies [38]. The advantages of long term perfused microfluidic model also include the ability to gently remove the cells that were not fully at-tached during the cell seeding, and to continuously remove the wastes out of the channels and prevent over-confluence of the cell growth. We also noticed that within the microvessel chan-nels, not all of the HUVECs aligned along the flow direction in each group. The Reynolds num-ber (Re) for the selected microfluidic channel region was around 0.014 at the low flow rate
(1 dyne/cm2) and 0.22 at the high flow rate (10 dyne/cm2) used during the media perfusion (Table 1). In fluid mechanics, Reynolds number is used to predict flow patterns. When Rey-nolds number is well below one, it indicates the fluid to be hydrodynamically stable with smooth and constant motion. Laminar flow occurs at low Reynolds numbers. Therefore, it was very unlikely existing of disturbed or secondary flow during the perfusion. Our results showed that the higher shear stress resulted in higher percentages of aligned cells. Based on the cell density counts, it is obvious that the cells within the channels have some variations of their growth stages, and therefore, showing different sensitivity to the shear stress or responding to the same shear stress at different rate. We would like to point out that, although effort and
progress have been made to reduce the gaps between ECsin vivoandin vitro, current methods
EC proliferation rate, and the variations of the cell growth stage within the microchannels may result in non-synchronized responses to mechanical stimuli.
The major technical improvement for biological applications reported in this study is the
quantitative measurements of agonist-induced dynamic changes in endothelial [Ca2+]iand
NO production at individual cell levels in a well-developed microvessel network. Studies in dividually perfused intact microvessels indicated that inflammatory mediator-induced in-creases in endothelial [Ca2+]iis essential for increases in microvessel permeability and that the
magnitude of the [Ca2+]idetermines the degree of permeability increases [15–18,40]. In
addi-tion, agonist-induced Ca2+/calmodulin-dependent endothelial nitric oxide synthase (eNOS)
activation and NO production have been shown to play important roles in the regulation of
microvessel permeability [10–12]. In this study, we directly applied the methods developed in
individually perfused intact microvessels [17,26] to this cultured microvessel network and
conducted parallel studies to those performed in the intact microvesselsin vivo. Currently the
uses of microfluidics to study intracellular calcium and NO responses have been reported by a few investigators. The calcium studies were either from suspended leukemic cells [41] or from non-confluent osteoblasts [42]. Though ATP-induced NO has been reported in bPAEC cul-tured microfluidic device, there was no characterization of the junctions of endothelial cells in which NO was measured and no temporal resolution of NO production was analyzed in those studies [23]. In our study, we choose ATP as the representative agonist to study
receptor-me-diated changes in endothelial [Ca2+]iand NO production. ATP can be released by red blood
cells, aggregated platelets, and injured tissue or under inflammatory conditions. The increased levels of ATP cause the release of endothelial-derived relaxing factor and trigger the synthesis of prostacyclin, and increase in microvessel permeability by increasing endothelial [Ca2+]i[18,
43,44]. The action of ATP is primarily via the purinergic P2yreceptor expressed on most
types of endothelial cells [45,46]. The calcium measurements using fluo-4 as indicator in the
microvessel network showed similar responses to what we found in intact microvessels [11, 18]. The observed time courses of the changes in endothelial [Ca2+]iwere also similar to those
found in intact microvessels [47]. The residence time for the ATP application in the microves-sel model was 1.3 sec with the slowest flow rate (0.35μl/mins), and should not affect the
measured responses.
As for NO measurements using DAF-2 DA, we need to recognize the specific manner of DAF-2 chemical conversion in the presence of NO and conduct data analysis accordingly [26, 48], which has not been presented in the previous reports. DAF-2 DA is membrane permeable and diffuses freely into the cells driven by concentration gradient and is then hydrolyzed by cytosolic esterase to form DAF-2. Intracellular DAF-2 is less membrane permeable due to its polarity, and is designed to be trapped inside the cells. Because the fluorescence chemical transformation of DAF-2 by NO is irreversible [48], the detected NO-sensitive fluorescence with DAF-2 represents a cumulative production of NO, not the dynamic changes of NO. The
slope of the FIDAFcurve represents the NO production rate and the plateau indicates the
ter-mination of NO production instead of the actual NO concentration in the cells. To present
the real-time course of NO production, df/dt, the NO production rate, was calculated based
on the differential conversion of that regression equation (shown inFig 7A). Using this
DAF-2 DA only loaded into ECs, not into pericytes, thus the DAF-2 fluorescence was only from ECs [11].
Conclusions
These results presented in this paper demonstratedin vitroformation of a microvessel network
that recapitulated key features of microvesselsin vivoand validated its utility for biological
ap-plications. The fabrication process of the microchannels was simple and straightforward to lower the barrier for biologists. The cell seeding and culture with constant perfusion method was user friendly to most researchers and easy to replicate. Cells in our model kept their
pheno-type, viability, proliferation with proper barrier functions. Comparing to other conventionalin
vitromodels, our model is more physiological realistic. In particular, HUVECs were
successful-ly grown to confluence throughout entire microchannels under well-controlled conditions. The flow conditions applied to the cultured microvessels were close to that at the similar type
of vasculaturein vivo. Immunofluorescent staining of VE-cadherin demonstrated the
forma-tion of vascular endothelial juncforma-tions, an indicaforma-tion of well-maintained endothelial restrictive barrier functions. HUVECs responded to different physiologically relevant flow shear stresses
and inflammatory stimuli. The endothelial [Ca2+]i, basal NO, and the changes in NO
produc-tion rate in response to ATP were real-time measured and quantified at individual cellular level in Fluo 4 and DAF-2 loaded microvessels, respectively. Most importantly, the agonist-induced
transient [Ca2+]iresponses and increased NO production were similar to those observed in
in-dividually perfused intact microvessels. The developed microvessel model has the potential to
bridge the gap between over-simplifiedin vitrotests and more expensive and labour-intensive
in vivoanimal models for the microvascular signalling and functional studies. It offers valuable
quantitative insights into how biophysical and biochemical properties influence vascular
biolo-gy and pathophysiolobiolo-gy, and serves as the complements forin vivoanimal studies. Because the
cultured endothelial cells can be from human tissues, a well characterized device will be suitable for studies of interactions between human blood components with microvessels formed by human endothelial cells under physiological and pathological conditions.
Acknowledgments
The microfabrication work was performed in Shared Research Facilities (Cleanroom facilities) and Microfluidic Integrative Cellular Research on Chip Laboratory (MICRoChip Lab) at West Virginia University. The main experiment and data analysis were done at West Virginia Uni-versity before the authors moved to Penn State Univeristy.
Author Contributions
Conceived and designed the experiments: XL SX PH YL. Performed the experiments: XL SX. Analyzed the data: XL SX. Contributed reagents/materials/analysis tools: XL SX. Wrote the paper: XL SX PH YL.
References
1. Sackmann EK, Fulton AL, Beebe DJ. The present and future role of microfluidics in biomedical re-search. Nature. 2014; 507(7491):181–9. doi:10.1038/nature13118PMID:24622198
2. Berthier E, Young EW, Beebe D. Engineers are from PDMS-land, Biologists are from Polystyrenia. Lab on a Chip. 2012; 12(7):1224–37. doi:10.1039/c2lc20982aPMID:22318426
4. Price GM, Wong KH, Truslow JG, Leung AD, Acharya C, Tien J. Effect of mechanical factors on the function of engineered human blood microvessels in microfluidic collagen gels. Biomaterials. 2010; 31 (24):6182–9. doi:10.1016/j.biomaterials.2010.04.041PMID:20537705
5. Zheng Y, Chen J, Craven M, Choi NW, Totorica S, Diaz-Santana A, et al. In vitro microvessels for the study of angiogenesis and thrombosis. Proceedings of the National Academy of Sciences of the United States of America. 2012; 109(24):9342–7. doi:10.1073/pnas.1201240109PMID:22645376
6. Tsai M, Kita A, Leach J, Rounsevell R, Huang JN, Moake J, et al. In vitro modeling of the microvascular occlusion and thrombosis that occur in hematologic diseases using microfluidic technology. The Jour-nal of clinical investigation. 2012; 122(1):408–18. doi:10.1172/JCI58753PMID:22156199
7. Bischel LL, Young EW, Mader BR, Beebe DJ. Tubeless microfluidic angiogenesis assay with three-dimensional endothelial-lined microvessels. Biomaterials. 2013; 34(5):1471–7. doi:10.1016/j. biomaterials.2012.11.005PMID:23191982
8. Lamberti G, Prabhakarpandian B, Garson C, Smith A, Pant K, Wang B, et al. Bioinspired Microfluidic Assay for In Vitro Modeling of Leukocyte–Endothelium Interactions. Analytical Chemistry. 2014; 86 (16):8344–51. doi:10.1021/ac5018716PMID:25135319
9. Xu S, Zhou X, Yuan D, Xu Y, He P. Caveolin-1 scaffolding domain promotes leukocyte adhesion by re-duced basal endothelial nitric oxide-mediated ICAM-1 phosphorylation in rat mesenteric venules. American Journal of Physiology-Heart and Circulatory Physiology. 2013; 305(10):H1484–H93. doi:10. 1152/ajpheart.00382.2013PMID:24043249
10. Zhou X, He P. Endothelial [Ca2+]i and caveolin-1 antagonistically regulate eNOS activity and microves-sel permeability in rat venules. Cardiovasc Res. 2010; 87(2):340–7. doi:10.1093/cvr/cvq006PMID:
20080986
11. Zhou X, He P. Temporal and spatial correlation of platelet-activating factor-induced increases in endo-thelial [Ca2+] i, nitric oxide, and gap formation in intact venules. American Journal of Physiology-Heart and Circulatory Physiology. 2011; 301(5):H1788–H97. doi:10.1152/ajpheart.00599.2011PMID:
21873500
12. Zhu L, He P. Platelet-activating factor increases endothelial [Ca2+] i and NO production in individually perfused intact microvessels. American Journal of Physiology-Heart and Circulatory Physiology. 2005; 288(6):H2869–H77. PMID:15665052
13. Zadeh MH, Glass CA, Magnussen A, Hancox JC, Bates DO. VEGF-Mediated Elevated Intracellular Calcium and Angiogenesis in Human Microvascular Endothelial Cells In Vitro are Inhibited by Dominant Negative TRPC6. Microcirculation. 2008; 15(7):605–14. doi:10.1080/10739680802220323PMID:
18800249
14. Yuan D, He P. Vascular remodeling alters adhesion protein and cytoskeleton reactions to inflammatory stimuli resulting in enhanced permeability increases in rat venules. Journal of Applied Physiology. 2012; 113(7):1110–20. doi:10.1152/japplphysiol.00102.2012PMID:22837164
15. He P, Curry FE. Depolarization modulates endothelial cell calcium influx and microvessel permeability. Am J Physiol. 1991; 261(4 Pt 2):H1246–54. PMID:1928406
16. He P, Curry FE. Endothelial cell hyperpolarization increases [Ca2+]i and venular microvessel perme-ability. J Appl Physiol (1985). 1994; 76(6):2288–97. PMID:7928849
17. He P, Pagakis SN, Curry FE. Measurement of cytoplasmic calcium in single microvessels with in-creased permeability. Am J Physiol. 1990; 258(5 Pt 2):H1366–74. PMID:2337172
18. He P, Zhang X, Curry FE. Ca2+ entry through conductive pathway modulates receptor-mediated in-crease in microvessel permeability. Am J Physiol. 1996; 271(6 Pt 2):H2377–87. PMID:8997296
19. Munaron L. Intracellular calcium, endothelial cells and angiogenesis. Recent patents on anti-cancer drug discovery. 2006; 1(1):105–19. PMID:18221030
20. Lee M-J, Thangada S, Claffey KP, Ancellin N, Liu CH, Kluk M, et al. Vascular endothelial cell adherens junction assembly and morphogenesis induced by sphingosine-1-phosphate. Cell. 1999; 99
(3):301–12. PMID:10555146
21. Tsai M, Kita A, Leach J, Rounsevell R, Huang JN, Moake J, et al. In vitro modeling of the microvascular occlusion and thrombosis that occur in hematologic diseases using microfluidic technology. The Jour-nal of clinical investigation. 2012; 122(1):408–18. doi:10.1172/JCI58753PMID:22156199
22. Kim S, Lee H, Chung M, Jeon NL. Engineering of functional, perfusable 3D microvascular networks on a chip. Lab Chip. 2013; 13(8):1489–500. doi:10.1039/c3lc41320aPMID:23440068
24. Huang Z, Li X, Martins-Green M, Liu Y. Microfabrication of cylindrical microfluidic channel networks for microvascular research. Biomedical microdevices. 2012; 14(5):873–83. doi: 10.1007/s10544-012-9667-2PMID:22729782
25. Keller HE. Objective Lenses for Confocal Microscopy. In: Pawley JB, editor. Handbook Of Biological Confocal Microscopy: Springer US; 2006. p. 145–61.
26. Zhou X, He P. Improved measurements of intracellular nitric oxide in intact microvessels using 4, 5-diaminofluorescein diacetate. American Journal of Physiology-Heart and Circulatory Physiology. 2011; 301(1):H108–H14. doi:10.1152/ajpheart.00195.2011PMID:21536843
27. Yuan D, Xu S, He P. Enhanced permeability responses to inflammation in streptozotocin-induced dia-betic rat venules: Rho-mediated alterations of actin cytoskeleton and VE-cadherin. Am J Physiol Heart Circ Physiol. 2014; 307(1):H44–53. doi:10.1152/ajpheart.00929.2013PMID:24778164
28. Langille BL, Graham JJ, Kim D, Gotlieb AI. Dynamics of shear-induced redistribution of F-actin in endo-thelial cells in vivo. Arterioscler Thromb. 1991; 11(6):1814–20. PMID:1931883
29. Sato M, Ohashi T. Biorheological views of endothelial cell responses to mechanical stimuli. Biorheol-ogy. 2005; 42(6):421–41. PMID:16369082
30. Zakrzewicz A, Secomb TW, Pries AR. Angioadaptation: Keeping the Vascular System in Shape. Physi-ology. 2002; 17(5):197–201.
31. Lipowsky HH, Kovalcheck S, Zweifach BW. The distribution of blood rheological parameters in the mi-crovasculature of cat mesentery. Circulation Research. 1978; 43(5):738–49. PMID:709740
32. Zhou X, Yuan D, Wang M, He P. H2O2-induced endothelial NO production contributes to vascular cell apoptosis and increased permeability in rat venules. American Journal of Physiology-Heart and Circu-latory Physiology. 2013; 304(1):H82–H93. doi:10.1152/ajpheart.00300.2012PMID:23086988
33. Ukropec JA, Hollinger MK, Woolkalis MJ. Regulation of VE-cadherin linkage to the cytoskeleton in en-dothelial cells exposed to fluid shear stress. Experimental cell research. 2002; 273(2):240–7. PMID:
11822879
34. Tzima E, Irani-Tehrani M, Kiosses WB, Dejana E, Schultz DA, Engelhardt B, et al. A mechanosensory complex that mediates the endothelial cell response to fluid shear stress. Nature. 2005; 437
(7057):426–31. PMID:16163360
35. Nagel T, Resnick N, Atkinson WJ, Dewey CF Jr, Gimbrone MA Jr. Shear stress selectively upregulates intercellular adhesion molecule-1 expression in cultured human vascular endothelial cells. Journal of Clinical Investigation. 1994; 94(2):885. PMID:7518844
36. Morawietz H, Talanow R, Szibor M, Rueckschloss U, Schubert A, Bartling B, et al. Regulation of the endothelin system by shear stress in human endothelial cells. The Journal of physiology. 2000; 525 (3):761–70. PMID:10856127
37. Feugier P, Black R, Hunt J, How T. Attachment, morphology and adherence of human endothelial cells to vascular prosthesis materials under the action of shear stress. Biomaterials. 2005; 26(13):1457–66. PMID:15522747
38. Ando J, Nomura H, Kamiya A. The effect of fluid shear stress on the migration and proliferation of cul-tured endothelial cells. Microvascular research. 1987; 33(1):62–70. PMID:3561268
39. Hobson B, Denekamp J. Endothelial proliferation in tumours and normal tissues: continuous labelling studies. British journal of cancer. 1984; 49(4):405–13. PMID:6201181
40. Curry FE. Modulation of venular microvessel permeability by calcium influx into endothelial cells. FASEB J. 1992; 6(7):2456–66. PMID:1563597
41. Xu T, Yue W, Li CW, Yao X, Yang M. Microfluidics study of intracellular calcium response to mechanical stimulation on single suspension cells. Lab Chip. 2013; 13(6):1060–9. doi:10.1039/c3lc40880aPMID:
23403699
42. Kou S, Pan L, van Noort D, Meng G, Wu X, Sun H, et al. A multishear microfluidic device for quantitative analysis of calcium dynamics in osteoblasts. Biochem Biophys Res Commun. 2011; 408(2):350–5. doi:
10.1016/j.bbrc.2011.04.044PMID:21514277
43. Sprague RS, Olearczyk JJ, Spence DM, Stephenson AH, Sprung RW, Lonigro AJ. Extracellular ATP signaling in the rabbit lung: erythrocytes as determinants of vascular resistance. Am J Physiol Heart Circ Physiol. 2003; 285(2):H693–700. PMID:12689860
44. Mannix RJ, Moatter T, Kelley KA, Gerritsen ME. Cellular signaling responses mediated by a novel nu-cleotide receptor in rabbit microvessel endothelium. Am J Physiol. 1993; 265(2 Pt 2):H675–80. PMID:
8396350
46. Carter TD, Hallam TJ, Cusack NJ, Pearson JD. Regulation of P2y-purinoceptor-mediated prostacyclin release from human endothelial cells by cytoplasmic calcium concentration. Br J Pharmacol. 1988; 95 (4):1181–90. PMID:3064854
47. He P, Curry FE. Differential actions of cAMP on endothelial [Ca2+]i and permeability in microvessels exposed to ATP. American Journal of Physiology—Heart and Circulatory Physiology. 1993; 265(3): H1019–H23.


![Fig 6. ATP-induced endothelial cell [Ca 2+ ] i increase in HUVECs cultured microchannel network](https://thumb-eu.123doks.com/thumbv2/123dok_br/17045365.233900/12.918.297.858.108.593/fig-induced-endothelial-increase-huvecs-cultured-microchannel-network.webp)

