J of Evolution of Med and Dent Sci/ eISSN- 2278-4802, pISSN- 2278-4748/ Vol. 3/ Issue 25/June 23, 2014 Page 7044
THE STUDY OF BACTERIAL POPULATION IN AIR SAMPLES OF A TERTIARY
CARE HOSPITAL
Partha Sarathi Chakrabarty1, Prasanta Kumar Maiti2, Rupali Dey3, Goutam Barik4, Tapajyoti Mukherjee5, Surangana Saha6, Ansuman Jana7, Kalidas Rit8
HOW TO CITE THIS ARTICLE:
Partha Sarathi Chakrabarty, Prasanta Kumar Maiti, Rupali Dey, Goutam Barik, Tapajyoti Mukherjee, Surangana Saha, Ansuman Jana, Kalidas Rit. The Study of Bacterial Population in Air Samples of a Tertiary Care Hospital. Journal of Evolution of Medical and Dental Sciences 2014; Vol. 3, Issue 25, June 23; Page: 7044-7052,
DOI: 10.14260/jemds/2014/2857
ABSTRACT: CONTEXT: The bacterial load in different air samples from environment of most hospitals remained undetermined. Any direct correlation between such bacterial load and the nosocomial infection are also lacking. Only higher bacterial load in air of a particular hospital environment may indicate higher risk of airborne cross infections. AIMS: The study is to determine the bacterial presence per unit volume of air, and the factors influencing the bioload. SETTINGS AND DESIGN: The air samples were collected from different locations of our tertiary care hospital, during Jul 2011 to June 2012 with information like room space per patient, number of daily average visitors, system of air circulation and house-keeping quality. METHODS: A specific volume of air was impacted on a plastic strips containing nutrient agar by air sampler La200, Hi-Media. Following incubation for 24 hour bacterial colonies were counted and organisms were identified up to genus level. RESULTS: Mostly Gram positive cocci followed by Gram positive and a few Gram negative bacilli were detected. The highest bacterial load was found in general outdoor premises (2456 CFU/cm), followed by some extremely crowded general wards (573 CFU/cm). The lowest count of such was found in nursery area (94 CFU/cm), where special emphasis was given on cleanliness,
room ventilation and visitor’s restriction. Similarly variations in bacterial loads were also noted in
different times in a day and in different seasons in a year. The bioload in all tested samples were within permissible limits. CONCLUSIONS: By appropriate measures the aerobic bacterial load in hospital environment can be restricted within optimal level.
KEYWORDS: Hospital environment, Air sampler, Bacterial load.
INTRODUCTION: The enclosed atmosphere of hospital building and its human occupants constitute an ecological unit .[1] Pollution of air can be caused by the bacteria,[2, 3, 4] which is the sole concern of this study. Exposure to bio aerosols may be especially hazardous in clinics and hospitals where they may be a major factor in increasing morbidity from respiratory diseases. Bacterial load in the air of such environment may be an indicator of risk for air borne infection and the measures that can reduce the bacterial load may also reduce the risk of such infection
J of Evolution of Med and Dent Sci/ eISSN- 2278-4802, pISSN- 2278-4748/ Vol. 3/ Issue 25/June 23, 2014 Page 7045 types of data; Primary, Secondary and Experimental data were collected for analysis. Primary data were collected through structured and unstructured communication. Unstructured communication was interview with the persons like Doctors, Nurses, Sweepers, other service providers and Patients. The structured communication was the questionnaires regarding parameters like Design of room, the height, the surface area of floor, walls, doors and windows, air ventilation system (through doors or windows, exhaust fans or air conditions), the zone type (e.g., sterile, semi sterile, clean and unclean nature of residents (patients or trafficking persons like doctors, nurses, visitors), the way of cleaning (dry Sweeping, wet mopping with/without disinfectant, or vacuum cleaning with periodic sterilization of the complexes). Secondary data are facts and figures collected from the documents and hospital records.
Experimental data collection was the vital part of this work. For this purpose air samples were collected by using the air sampler model no LA200 Hi Media.[5] The instrument consists of a container designed to accommodate a Petri strip containing nutrient agar or any other desired medium. A battery controlled propeller sucks a known volume of air per minute through the open mouth and throws the air containing microorganisms to impinge on the Petri strip agar by centrifugal force of impaction.
PARAMETERS OF STUDY: Air Sampling System, HI Media. No LA002,[5] which is an air sampler system without remote control. Particle capture mechanism is the centrifugal impaction. Maximum sample volume is 2520 lit. Time to sample 1000 lit. (1cubic meter is .5 min. ≈ 8 lit/min . Air sampler system is used for monitoring the microbial quality of critical environment. (As per ISO 14689, USP/NF 28/23 chapter 116, 2005). This unit is power packed with batteries (Ni-Cd). Sterile plastic air sampler strips were filled with appropriate sterile molten agar medium and after solidification; the strips were used for air sampling.
METHODS: The air under examination is sucked by the impeller in a tornado like spirally, conical form and the particles contained in it are centrifugally impacted against the inward facing peripheral agar medium strip as the spirally returning air escapes around the outer surface of the tornado.
The impeller speed of 4000 rpm is so adjusted that 280 liters of air is sampled every minute. The air sampler theoretically precipitates particles having cut off size of 1.2 to 2.1 micron. Practically the cut off size of all air borne microbiological contaminant carrying particles are less than 2.5 micron. The higher the sample air volume, the more accurate will be the number of measured colony forming unit.[6]
J of Evolution of Med and Dent Sci/ eISSN- 2278-4802, pISSN- 2278-4748/ Vol. 3/ Issue 25/June 23, 2014 Page 7046 The colonies of common non fastidious organisms present in air grew on petri strips. They were examined with the aid of a magnifying glass under bright light. The colony numbers, Colony morphology, Gram staining characteristics and biochemical reactions were detected.
The level of bacterial contamination of air is usually expressed as bacteria containing particles per cubic meter (bcp/cm) or the Bioload (B), which can be calculated from the given formula, [7]
B=1000N/RT bcp /cm
Where N is the number of colonies counted on the sample plate T is the duration of test in minute,
R is the air sampling rate in liters/minute
The particles counted are those carrying bacteria capable of growth on nutrient agar during aerobic incubation for 24-48 hrs at 37°C.
After counting the total number of bacterial colonies, they are grouped according to the morphological features, like size, shape, surface, margin and translucency, pigment production, diffusibility of pigment, and consistency as per standard procedure [7]
With the help of Gram stain a watershed division was made as Gram positive bacilli, Gram negative bacilli, Gram positive cocci and rarely Gram variable cocci.
RESULTS: The average CFU/cm is observed around 453 obtained from all types of samples collected in this hospital. About the average composition, it was found to have Gram Positive Bacilli (44%), Gram Positive Cocci (53%)and Gram Negative Bacilli (3%). [Figure-1]
The average composition of total Number of colony forming units recovered from all test air samples from various sites of this hospital, shown in pie chart. Gram +ve bacilli (GPB), Gram +ve cocci (GPC), Gram -ve bacilli (GNB).Colony forming units per cubic meter (CFU/cm).
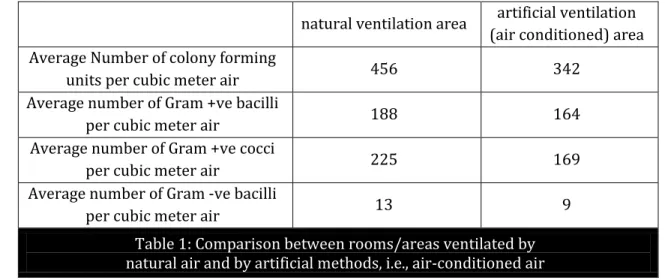
There was significant difference in every segment, like average number of colony forming units per cubic meter air, average number of Gram positive bacilli (GPB) per cubic meter air, average number of Gram positive cocci (GPC) per cubic meter air and average number of Gram negative bacilli (GNB) per cubic meter air. In every aspect the naturally ventilated area possess larger number of bacteria. [Table-1]
J of Evolution of Med and Dent Sci/ eISSN- 2278-4802, pISSN- 2278-4748/ Vol. 3/ Issue 25/June 23, 2014 Page 7047 natural ventilation area artificial ventilation
(air conditioned) area Average Number of colony forming
units per cubic meter air 456 342
Average number of Gram +ve bacilli
per cubic meter air 188 164
Average number of Gram +ve cocci
per cubic meter air 225 169
Average number of Gram -ve bacilli
per cubic meter air 13 9
Table 1: Comparison between rooms/areas ventilated by natural air and by artificial methods, i.e., air-conditioned air
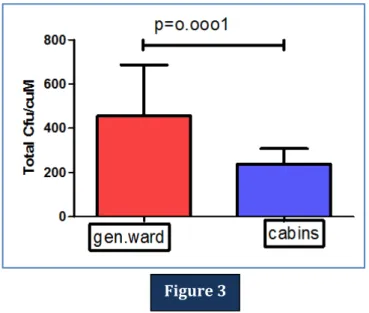
In comparison to cabins, general wards had much higher number of bacterial colony forming units in every components, like, GPC, GNB, GPB per cubic meter air volume. [Figure-2] The results are analyzed as per standard methods of biostatistics (using Student T test, Graf pad prism version 4.02 for Windows with a P-value <0.05). This was also statistically significant. [Figure-3].
Comparison of colony forming units per cubic meter air (CFU/cm) and its components, ie, GPB, GPC and GNB between general wards and cabins.
J of Evolution of Med and Dent Sci/ eISSN- 2278-4802, pISSN- 2278-4748/ Vol. 3/ Issue 25/June 23, 2014 Page 7048 The difference between the total colony count of general ward and cabin was statistically highly significant (p value = 0.0001).
There was a slight rise in bacterial colony counts during summer and rainy seasons and fall of its count during winter in naturally ventilated rooms. New casualty block (female) was one such room, which had a very rapid turn-over of patients; was easily accessible for patients, relatives and examiner, due to minimum prohibition of their movements in comparison to other restricted wards. [Table-2] No such seasonal changes were noticed in air conditioned rooms/wards with strict movement restriction.
wards date temp humidity Total
CFU/cm
GPB CFU/cm
GPC CFU/cm
GNB CFU/cm
NCB (f) 3/8/11 30.80 C 78% 407 191 231 06
10/10/11 28.60 C 72% 306 142 156 08
8/12/11 26.20 C 67% 344 171 167 06
25/1/12 2420 C 60% 301 138 160 03
5/3/12 30.80 C 65% 365 185 176 04
15/5/12 350 C 72% 431 202 223 06
12/6/12 34.50 C 71% 443 204 234 05
7/7/12 350 C 72% 423 205 209 09
3/8/12 30.30 C 77 % 409 189 211 09
Table 2: Comparison of air borne bacterial colony count in different seasons, in different temperature and in different humidity in a naturally ventilated
J of Evolution of Med and Dent Sci/ eISSN- 2278-4802, pISSN- 2278-4748/ Vol. 3/ Issue 25/June 23, 2014 Page 7049 The special OTs which did not possess any extra methods for air purification like UV rays, HEPA filters etc obviously had no significant difference in bacterial colony count with general OTs.
The data from neonatal intensive care unit, which was the most clean and equipped ward, showed not only a very low value of bioload (below 161 CFU/cm), but a significant reduction in CFU count after UV irradiation. (below 35 CFU/cm). [Figure-4]
Comparison of bacterial colony forming units and its components per cubic meter before and after ultra-violet ray treatment in Neonatal Intensive Care Unit.
The enormous bacterial colony count at ticket counter and OPD complex (TC/OPD) in emergency building ground floor corresponds well with the suffocating crowd gathered during the working hours. Though these are not the usual places for staying of patients, but such areas are used for prolonged waiting of patients and their attendants. [Figure-5]
The average bacterial population and its components (CFU/cm) inside hospital buildings. Cardiothoracic block [CT block], Emergency block [Emrg.block], Ticket counter/OPD [TC/OPD].
Figure 4
J of Evolution of Med and Dent Sci/ eISSN- 2278-4802, pISSN- 2278-4748/ Vol. 3/ Issue 25/June 23, 2014 Page 7050 Among the four rooms randomly chosen in Microbiology department, only room no 9 was naturally ventilated, showing more colony count than the others. Room no 11 was almost a store room without a regular human traffic. Air samples from room no8 were collected in late hours, in absence of any laboratory worker whereas in UCM (Microbiology) lab the air samples were collected during busy hours. [Figure-6]
Air-bacterial composition (CFU/cm) and its components in some randomly chosen rooms in Microbiology department
Both in naturally ventilated wards and artificially ventilated (air conditioned) wards, common bacteria like Bacillus subtilis, Staphylococcus aureus, Staphylococcus epidermidis, Micrococcus and a few unidentified bacteria were found in each point. Other types of bacteriae, like Klebsiella species, Pseudomonas aeruginosa, Stenotropomonas maltophila, Acinetobacter baumannii Diphtheroidswere also present in most of naturally ventilated wards and in a few artificially ventilated wards.
CONCLUSION: As per air bacteriology standard, naturally ventilated rooms should have contamination levels between 150/cubic meter and 4000/cubic meter. The higher levels are observed due to overcrowding, much bodily activities or other dust-raising movements. Usually <1% and commonly 0.01—0.1% of the air-borne bacteria are pathogenic. It is also recommended that for conventional operation theatres the bioload should not exceed 35 in an empty O.T. and 180 during an operation [8]
The quantitative study of different hospital units showed that, OPD complex and ticket counter followed by general wards recorded the highest airborne bacterial population, while the least air borne bacterial population was recorded in Laminar airflow with UV ray room in NICU, followed by OTs, ICU, ITU.
The high bacterial counts found in general medicine and general surgical wards compared to sophisticated cabins could be due to the subsidized rate of public wards so as to accommodate more patients, compared to the private wards, where high fees are charged and are not within the reach of poor people in the society [6].
J of Evolution of Med and Dent Sci/ eISSN- 2278-4802, pISSN- 2278-4748/ Vol. 3/ Issue 25/June 23, 2014 Page 7051 There are more visits of patients as well as visitors in the general wards as compared to OTs and ICUs, which is also one of the factors for high microbial loads in general wards. Personal belongings, foods, fruits are recognized as source of hospital contaminations.[3, 4, 6, ]
Microbial loads of indoor air were highly influenced by the number of occupants, their activity and ventilation. Shedding of microorganism from the skin surface and the respiratory tract of the occupants increases the microbial loads.
Air conditioned rooms like OTs; ICUs rarely showed any seasonal variation of bacterial loads as the temperature and humidity are maintained at a constant level throughout the year.
Control of humidity and temperature are so well maintained in burn unit, that it recorded very low count of colony forming units in spite of such highly infectious patients. Consequently, the clinical outcome is very good in this ward.
All the work was done to standardize air borne bacterial population in this tertiary care hospital with the aim for better patient care. However there are certain limitations in this type of study. Out of the vast number of bacterial colonies, only the morphologically similar colonies are grouped and processed for identification and that is up to the genus level only. Sufficient facilities for bacterial DNA extraction, PCR/ rtPCR, bacterial speciation was not available for these huge bacterial loads.
Based on the sources and the influencing factors for indoor bioaerosols, corresponding remedial actions could be taken to control related contamination. Potentially effective strategies include; limiting entrance of outdoor aerosols; keeping the relative humidity level below high levels (<60%) [9]; installing appropriate filtration devices to air ventilation system and reducing /removing contaminant sources (i.e., indoor organic waste) [9].
REFERENCES:
1. Riley RL. The ecology of indoor atmosphere airborne infection in Hospital. J. Chronic Disease. 1972; 25: 421-423.
2. Stetzenbach LD. Airborne bacteria. In: Borriello SP, Murray PR, Funke G, editors. Topley
&Wilson’s Microbiology & Microbial infections. th ed. London. Hodder Arnold; 2007 p.185-190.
3. Jaffal, AA, Nsanze, H, Bener, A, Ameen, AS, Banat, Ibrahim and Eimogheth, AA (1997). Hospital airborne microbial pollution in a desert country. Environment International, 23(2): 167-172.Available from: http: //dx.doi.org/10.1016/S0160-4120(97)00003-2.
4. Awosika SA, Olajubu FA, Amusa NA.Microbiological assessment of indoor air of a teaching hospital in Nigeria. Asian Pac J Trop Biomed. 2012 June; 2(6): 465–468.Available from: http: //www.ncbi.nlm.nih.gov/pmc/articles/PMC3609330/pdf/apjtb-02-06-465.pdf.
5. HIMEDIA manual for instruction of Air Sampling Systems La 002; 2005.
6. Bhatia L, Vishwakarma R. Hospital Indoor Airborne Microflora in Private and Government Owned Hospitals in Sagar City, India. World J Med S.2010; 5(3): 65-70.
7. Senior BW. Examination of water, milk, food and air.in: ColleeJ. G.; Fraser A. G; Marmion B. P.; Simmons A Mackie & McCartney Practical medical microbiology (14th ed). Elsevier India Reprinted 2007; Churchill Livingstone page 908-910.
J of Evolution of Med and Dent Sci/ eISSN- 2278-4802, pISSN- 2278-4748/ Vol. 3/ Issue 25/June 23, 2014 Page 7052 9. India. Guidelines on Airborne Infection Control in Healthcare and Other Settings: In the context
of tuberculosis and other airborne infections Directorate General of Health Services. Ministry of Health & Family Welfare Nirman Bhawan, New Delhi – 110 011; October 2009.
AUTHORS:
1. Partha Sarathi Chakrabarty 2. Prasanta Kumar Maiti 3. Rupali Dey
4. Goutam Barik 5. Tapajyoti Mukherjee 6. Surangana Saha 7. Ansuman Jana 8. Kalidas Rit
PARTICULARS OF CONTRIBUTORS:
1. Demonstrator, Department of Microbiology, IPGME & R, Kolkata.
2. Professor and HOD, Department of Microbiology, IPGME & R, Kolkata. 3. Assistant Professor, Department of
Microbiology, IPGME & R, Kolkata. 4. Assistant Professor, Department of
Microbiology, IPGME & R, Kolkata.
5. Demonstrator, Department of Microbiology, IPGME & R, Kolkata.
6. Demonstrator,Department of Microbiology, IPGME & R, Kolkata.
7. Demonstrator, Department of Microbiology, IPGME & R, Kolkata.
8. Assistant Professor, Department of Microbiology, IPGME & R, Kolkata.
NAME ADDRESS EMAIL ID OF THE CORRESPONDING AUTHOR:
Dr. Partha Sarathi Chakrabarty, 8/A, Bhabananda Road, Kolkata-26.
Email: [email protected]