Original Article
Artigo Original
Luana Araujo Cruz Rosa1 Marcia Rumi Suzuki1 Rosanna Giaffredo Angrisani2 Marisa Frassom Azevedo1
Descritores
Eletroisiologia Audição Potenciais evocados auditivos Recém-nascido Keywords
Electrophysiology Hearing Evoked potentials, auditory Infant, newborn.
Correspondence address:
Luana Araujo Cruz Rosa
Rua Carlos Vilallva, 151, apto 71, Vila Guarani, São Paulo (SP), Brazil, CEP: 04307-000.
E-mail: [email protected]
Received: 04/18/2013
Accepted: 02/06/2014
Study carried out at the Ambulatory of Auditory Electrophysiology, Universidade Federal de São Paulo – UNIFESP – São Paulo (SP), Brazil.
(1) Universidade Federal de São Paulo – UNIFESP – São Paulo (SP), Brazil.
(2) Department of Physical Therapy, Speech-Language Pathology and Audiology, and Occupational Therapy, School of Medicine, Universidade de São Paulo – USP – São Paulo (SP), Brazil.
Conlict of interests: nothing to declare.
Auditory Brainstem Response:
reference-values for age
Potencial Evocado Auditivo de Tronco Encefálico:
valores de referência em relação à idade
AbstRACt
Purpose: To study the absolute latencies of waves I , III and V and interpeak I-III , III-V and I-V of Auditory brainstem responses obtained in preterm newborns in relation to post-conceptual age, term newborns and six months of age infants, establishing reference values for each age group. Methods: Retrospective study realized through the analysis of tests performed on 80 infants divided into four groups, being the group one composed per newborns assessed between 35 and 36 weeks post-conceptual age; group two by newborns assessed between 37 and 38 weeks; group three with newborns reviewed between 39 to 40 weeks; and group four with infants evaluated with six months. Results: The wave I absolute latency in the group one was 1.81 ms, decreasing to 1.79 ms in groups two and three, and to 1.70 ms in group four. The wave III latency in group one was 4.74 ms, decreasing to 4.62 ms in group two, to 4.56 ms in the group three and to 4.37 ms in the group four. The wave V latency in group one was 7.14 ms, in the group two it was 7.05 ms, in the group three 6.90 ms; and in the group four it was 6.50 ms. Interpeak latencies were also decreased in all groups. Conclusion: The latencies studied decreased with the increasing age and were similar values with the international literature.
REsUMO
INtRODUCtION
The auditory brainstem response (ABR) is a simple, objec-tive and noninvasive method used to assess the cochlear nerve and auditory pathways of the brainstem.
The ABR is deined as a set of electrical responses gener-ated at various anatomical sites through an external auditory stimulus (auditory or electrical stimulation). This acoustic stimulation generates responses through sequential and syn-chronized activation of the nerve ibers along the auditory path-way(1). The ABR is widely used because it assesses the
matura-tion of the auditory pathway, and, since it was discovered, in 1970(2), obtaining these potentials has assisted us, along with
otoacoustic emissions, in the topographic diagnosis of a series of auditory alterations.
The ABR is considered a short latency potential because it generates a series of seven waves that arise during the irst 10 ms after the introduction of the sound stimulus. Each ABR wave is generated by the activation of a subcortical compo-nent of the auditory pathway. These waves are generated by sequential activation of the auditory pathway structures and can be picked up by surface electrodes placed on the front or on the vertex and on the lobes of the patient under assessment.
The waves that constitute this potential show an emer-gence time from the beginning of stimulation, which is known as absolute latency. The time difference between the onset of each wave is called range or interpeak latency. Thus, the inter-pretation of ABR is made by analyzing the absolute latencies, the interpeak intervals, the morphology and amplitude of the generated waves, and the reproducibility of the tracing(1,3,4).
Each service should set its own normal values , since the absolute latencies of the waves depend on factors such as, for example, the stimulus parameter, the equipment used and the population characteristics such as age and gender. With the implementation of newborn hearing screening (NHS), children at increasingly younger ages are sent for audiological diagnosis. This way, it becomes important to deine normal parameters, using more objective and accurate assessments to establish the diagnosis of peripheral and central hearing disorders as early as possible. Because of the importance of evaluation methods in the diagnosis of hearing disor-ders in children and the increased demand for early identi-ication of hearing disorders in newborns and infants a few months old, it is essential to obtain normative data. These data can reveal patterns of response in this population and help to differentiate them from real alterations, assisting in the interpretation of results and increasing the accuracy of audiological diagnosis(6).
The NHS programs have been developed and carried out in several places for decades due to the development and improve-ment of electrophysiological measures that can be used to screen and diagnose early hearing loss in infants(7).
The objective of this research was to study the absolute latencies of waves I, III and V and the interpeak intervals I-III, III-V and IV of the ABR obtained in preterm newborns (NB) in relation to post-conceptual age and in full-term newborns and
infants of six months of age, establishing reference values for each age group, since several authors believe that the maturation process of the central auditory pathways greatly inluences the responses of the brainstem, causing latencies from ABR waves to become shorter in accordance with the age increase(8-12).
MEtHODs
The study was a retrospective one and was conducted through the analysis of the tracings of all electrophysiological tests (ABR) performed in NBs and infants from August of 2008 to August of 2010 diagnosed as able to hear at the Ambulatory of Electrophysiology of a public service in the city of São Paulo. The research was initiated only after approval by the Research Ethics Committee under the report number 0794/10.
The sample consisted of 80 patients, who were divided into four groups according to age group, as follows:
• Group 1: 20 preterm NBs, with gestational age of less than
37 weeks, evaluated between 35 and 36 weeks of post-con-ceptual age;
• Group 2: 20 full-term NBs, with gestational age superior
to 37 weeks, evaluated between 37 and 38 weeks;
• Group 3: 20 full-term NBs, with gestational age superior
to 37 weeks, evaluated between 39 to 40 weeks;
• Group 4: 20 full-term infants, with gestational age superior
to 37 weeks, evaluated at six months of age.
The gestational age is expressed in weeks, calculated from the irst day of the last menstrual period or through the New Ballard score(13), performed between four and six hours after
birth. The post-conceptual age was considered from the mater-nal gestatiomater-nal age plus the lifetime the child had at the time of the evaluation.
Each group consisted of ten female infants and ten male ones, in order to keep the similarity in the sample.
The inclusion criteria were: transient evoked otoacoustic emissions (TOAE) and cochlear-blink relex (CPR) present at the moment of the newborn hearing screening with unchanged ABR — normal electrophysiological threshold. Values equal or less than 30 dB were considered the limit of electrophysi-ological normal values.
The exclusion criteria were: ABR with alterations caused by conductive hearing loss, cochlear hearing loss or retro-cochlear dysfunction. The conductive alterations were identiied when the absolute latencies of waves I, III and V were increased for the age group, with interpeaks within the criteria of normality. The cochlear loss was considered when electrophysiological thresholds were above 30 dBnHL with absolute latencies and interpeaks of the waves I, III and V within the normal range. Retrococlear alterations were considered, such as those that presented alteration of the absolute latencies of waves I, III and/or V as well as the interpeaks.
The analyzed tests were performed using the Smart EP equipment, of Intelligent Hearing Systems, in an acoustically treated room and electrically protected by the same team of audiologists. The stimulus introduced was the rarefaction polar-ity click and presentation speed of 27.7 clicks per second and recording window of 12 ms. For the analysis of the tracing gen-erated, a total of 1.024 to 2.048 clicks was presented twice so that reproducibility between tracings could be observed. We used ER 3A insert earphones, and the recording of responses was made using surface electrodes, ixed with adhesive tape and positioned according to the international 10-20 system, (Cz – front and A1 and A2 – right and left lobes), adapting the impedance below 3 kΩ. The skin of the infants was cleaned with abrasive paste and, for better contact of the electrodes, electrolyte paste was applied to the electrodes. All examina-tions were performed with the child in natural sleep.
REsULts
In the present study, there was a decrease in the abso-lute latencies and the interpeaks with the increase of age. The Table 1 shows the mean values of latency and inter-peaks in the group of preterm NBs assessed between 35 and 36 weeks (group 1).
The latencies obtained from NBs evaluated between 37 and 38 weeks (group 2) are shown in Table 2 and were lower than those obtained in group 1.
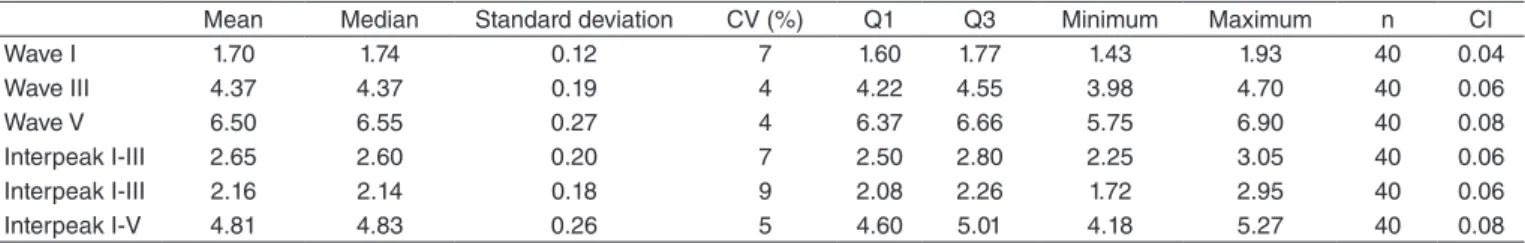
The NBs assessed between 39 and 40 weeks (group 3) also showed higher values than the ones obtained in the evaluation of infants of six months of age (group 4), as it can observed in Tables 3 and 4.
Evolutionary shifts in these values in all age groups studied can be more easily visualized in Graphs 1 and 2.
Tabela 4. Mean values of the latencies of waves I, III e V and interpeaks I-III, III-V e I-V in group 4 (6 months of age)
Mean Median Standard deviation CV (%) Q1 Q3 Minimum Maximum n CI
Wave I 1.70 1.74 0.12 7 1.60 1.77 1.43 1.93 40 0.04
Wave III 4.37 4.37 0.19 4 4.22 4.55 3.98 4.70 40 0.06
Wave V 6.50 6.55 0.27 4 6.37 6.66 5.75 6.90 40 0.08
Interpeak I-III 2.65 2.60 0.20 7 2.50 2.80 2.25 3.05 40 0.06
Interpeak I-III 2.16 2.14 0.18 9 2.08 2.26 1.72 2.95 40 0.06
Interpeak I-V 4.81 4.83 0.26 5 4.60 5.01 4.18 5.27 40 0.08
Caption: CV = coefficient of variation; Q1 and Q3 = first and third quartiles; n = sample size; CI = confidence interval
Table 1. Mean values of the latencies of waves I, III and V and interpeaks I-III, III-V and the I-V in group 1 (35–36 weeks)
Mean Median Standard deviation CV (%) Q1 Q3 Minimum Maximum n CI
Wave I 1.81 1.82 0.09 5 1.75 1.89 1.65 2.08 40 0.03
Wave III 4.74 4.75 0.20 4 4.59 4.86 4.35 5.13 40 0.06
Wave V 7.14 7.24 0.34 5 7.01 7.39 6.25 7.70 40 0.10
Interpeak I-III 2.89 2.92 0.25 9 2.74 3.07 2.02 3.30 40 0.08
Interpeak I-III 2.41 2.47 0.28 12 2.30 2.56 1.55 2.80 40 0.09
Interpeak I-V 5.33 5.39 0.31 6 5.17 5.52 4.45 5.95 40 0.10
Caption: CV = coefficient of variation; Q1 and Q3 = first and third quartiles; n = sample size; CI = confidence interval
Tabela 2. Mean values of the latencies of waves I, III e V and interpeaks I-III, III-V e I-V in group 2 (37–38 weeks)
Mean Median Standard deviation CV (%) Q1 Q3 Minimum Maximum n CI
Wave I 1.79 1.76 0.09 5 1.75 1.82 1.65 2.13 40 0.03
Wave III 4.62 4.62 0.20 4 4.54 4.72 4.10 5.10 40 0.06
Wave V 7.05 7.11 0.28 4 6.80 7.25 6.55 7.80 40 0.09
Interpeak I-III 2.83 2.81 0.20 7 2.72 2.92 2.45 3.32 40 0.06
Interpeak I-III 2.42 2.39 0.22 9 2.27 2.56 2.00 3.20 40 0.07
Interpeak I-V 5.23 5.23 0.24 5 5.03 5.41 4.80 5.70 40 0.07
Caption: CV = coefficient of variation; Q1 and Q3 = first and third quartiles; n = sample size; CI = confidence interval
Tabela 3. Mean values of the latencies of waves I, III e V and interpeaks I-III, III-V e I-V in group 3 (39–40 weeks)
Mean Median Standard deviation CV (%) Q1 Q3 Minimum Maximum n CI
Wave I 1.79 1.80 0.09 5 1.73 1.83 1.60 2.00 40 0.03
Wave III 4.56 4.57 0.22 5 4.42 4.71 4.17 5.00 40 0.07
Wave V 6.90 6.96 0.33 5 6.65 7.13 6.10 7.42 40 0.10
Interpeak I-III 2.77 2.80 0.21 8 2.64 2.87 2.25 3.18 40 0.07
Interpeak I-III 2.42 2.30 0.61 25 2.15 2.51 1.83 5.88 40 0.19
Interpeak I-V 5.08 5.14 0.31 6 4.87 5.32 4.45 5.63 40 0.10
of full-term NBs may be inappropriate. Knowing the differ-ences in the acquisition of ABR in preterm and full-term infants, adjustments to clinical standards are necessary so that the par-ticularities and the development and maturation of the central auditory system are taken into account in each age group(11,14).
The maturation of the auditory system inluences the ABR responses in infants. To avoid misinterpretation of results, one should consider the gestational age when analyzing the ABR in this population(6).
So, the auditory electrophysiological responses obtained through the ABR change according to age, particularly during the irst 12 to 18 months of life, and these responses, both in full-term and preterm infants vary greatly from those obtained in adults.
The results generated in this study were expected, given that preterm NBs always have maturational delay in the cen-tral auditory nervous system. In addition, NBs who stay in the neonatal ICUs are at high risk for experiencing perinatal com-plications and abnormalities in the maturation process of the central auditory pathways(15).
These data are similar to those obtained in international studies. A comparative summary of the results of this research in relation to the studies found in the specialized literature is presented in Chart 1. As shown, the values obtained are similar to what is described in the literature(11). The wave I values in
this study were lower than those reported in another study(16).
Several authors(8,9,11,14,15,17-19) have also found in their research,
using similar parameters to those of this study, that the values of the absolute latencies of waves I, III and V, as well as the interpeak intervals I-III, III-V and I-V, decrease according to increasing age in preterm and full-term infants, especially the waves III and V. This decrease occurs until the myelination process is completed and the maturation of the auditory path-ways in the brainstem happens, which takes place around 18 to 24 months, when the mean values of the absolute latencies get closer to those obtained in adults(4). Such differences could
be attributed to the use of different equipment and / or differ-ent parameters of analysis and acquisition.
In the tracings of electrophysiological responses obtained in infants, the waves I, III and V are clearly visible, particularly with prolonged absolute latencies of waves III and V.
The interpeak intervals analyzed were the ones formed between the peaks of waves I and III, III and V, and I and V. The literature describes the interpeak interval as the one between the peaks of the waves, and it is also considered an important parameter in the clinical interpretation of ABR.
The standard deviations obtained in this study, both for the absolute latency values and for the interpeaks, are similar to those found in the literature(11,14). It was considered standard deviation
of ±0.2 ms for the interpeaks I-III and III-V and ±0.4 ms for the interpeaks I-V(14). Other authors(19) havealso found a standard
deviation for the interpeak interval I-V greater than 0.4 ms in full-term infants, agreeing with the indings of this research.
In a population of infants, the absolute latency of wave I may appear slightly prolonged, but not as much as the wave V, comparing to the results discovered in adults(4,6,14,16). These
ind-ings may also explain the increase in the I-V interpeak interval, that appears around 5 ms in neonates(14,16).
Graph 1. Evolution of the absolute latencies of waves I, III and V in all groups
Wave I Wave III Wave V
Group 1 Group 2 Group 3 Group 4
Graph 2. Evolution of the interpeaks I-III, III-V and I-V in all groups Interpeak I-III Interpeak III-V Interpeak I-V
Group 1 Group 2 Group 3 Group 4
DIsCUssION
Many parameters can be analyzed to determine whether the ABR responses are within normal limits. Some of these aspects are directly linked to speciic parameters used and veriied dur-ing the acquisition of the tracdur-ing and the interpretation of results. These parameters are characterized by the analysis of the abso-lute latency of the wave, the interpeak intervals latencies, the changes occurring in the absolute latencies due to the intensity reduction and the morphology and reproducibility of tracings.
The analysis of the absolute latencies of waves is consid-ered the most reliable parameter and provides important data on the clinical interpretation of the test as normal or altered, since these values are fairly consistent, more precisely with dif-ferences of only 0.1 ms in normal individuals(14). Thus, these
were the parameters used in this study to consider the tracings within normal limits and, thereby, to investigate the absolute latency of waves I, III and V of the ABR, as well as the inter-peak intervals I-III, III-V and I-V in preterm NBs, considering the post-conceptual age, full-term NBs and infants at six months of age and, inally, compare them to the values described in the specialized literature.
The results of this study can be used in clinical practice by professionals who use the same equipment and parameters deined in this research. We believe that the establishment of the reference values obtained in this study can contribute to the early audiological diagnosis.
CONCLUsION
There was a decrease in the absolute latencies of the waves I, III and V, as wells as in interpeaks I-III, III-V and IV, in accor-dance with the increase of age. With this study, we observed that the higher the age at which infants are evaluated, the shorter the absolute and interpeak latencies become.
*RGA was responsible for data collection and tabulation; LACR collaborated with data collection and tabulation; MRS supervised data collection; LACR monitored data collection and helped in the analysis; LACR and MFA were responsible for the project and study outline and overall supervision for the stages of implementation and preparation of the manuscript.
REFERENCEs
1. Jeger J, Hall J. Effects of age and sex on Aiditory Braisnten Response. Arch Otolaryngol. 1980;106(7):387-91.
2. Jewett DL, Romano MN, Williston JS. Human auditory evoked potentials: possible brain stem components detected on the scalp. Science. 1970;167(3924):1517-8.
3. Stockard JE, Stockard JJ, Westmoreland BF, Corits JL. Brainstem auditory-evoked response. Normal variation as a function of stimulus and subjects characteristics. Arch Neurol. 1979;36:823-31.
4. Hall JW. Handbook of auditory evoked responses. Boston: Allyn and Bacon; 1992.
5. Anias CR, Lima MAMT, Kós AOA. Avaliação da influência da idade no potencial evocado auditivo de tronco encefálico. Rev Bras Otorrinolaringol. 2004;70(1):84-9.
6. Casali RL, Santos MFC. Potencial Evocado Auditivo de Tronco Encefálico: padrão de respostas de lactentes termos e prematuros. Braz J Otorhinolaryngol. 2010;76(6):729-38.
7. Marcoux AM. Maturation of auditory function related to hearing threshold estimations using the auditory brainstem response during infancy. Int J Pediatr Otorhinolaryngol. 2011;75(2):163-70.
8. Yin R, Wilkinson AR, Chen C, Brosi DM, Jiang ZD. No close correlation between brainstem auditory function and peripheral auditory threshold in preterm infants at term age. Clin Neurophysiol. 2008;119(4):791-5. 9. Sleifer P, da Costa SS, Cóser PL, Goldani MZ, Dornelles C, Weiss K.
Auditory brainstem response in premature and full-term children. Int J Pediatr Otorhinolaryngol. 2007;71 (9):1449-56.
10. Eldredge L, Salamy A. Functional auditory development in preterm and full term infants. Early Hum Dev. 1996;45(3):215-28.
11. Gorga MP, Reiland JK, Beauchaine KA, Worthington DW, Jesteadt W. Auditory brainstem responses from graduates of an intensive care nursery: normal patterns of response. J Speech Hear Res. 1987;30(3):311-8.
12. Jacobson JT. The Auditory Brainstem Response. San Diego: College Hill Press; 1985.
13. Ballard JL, Khoury JC, Wedig K, Wang L, Eilers-Walsman BL, Lipp R. New Ballard Score, expanded to include extremely premature infants. J Pediatr. 1991;119(3):417-23.
14. Hood LJ. Clinical application of the auditory brainstem response. San Diego: Singoular; 1998. p.12-28.
15. Coenraad S, Hoeve LJ, Goedegebure A. Incidence and clinical value of prolonged I-V interval in NICU infants after failing neonatal hearing screening. Eur Arch Otorhinolaryngol. 2011;268(4):501-5.
16. Cox C, Hack M, Metz D. Brainstemevocked response audiometry: normative data from the preterm infant. Audiology. 1981;20(1):53-64 17. Morgan DE, Zimmerman MC, Dubno JR. Auditory brainstem evoked
response characteristics in full-term newborn infant. Ann Otol Rhinol Laryngol. 1987;96:142-51.
18. Kılıç I, Karahan H, Kurt T, Ergin H, Sahiner T. Brainstem evoked response audiometry and risk factors in premature infants. Marmara Med J. 2007;20(1):21-8.
19. Amorim RB, Agostinho-Pesse RS, Alvarenga KF. The maturational process of the auditory system in the irst year of life characterized by brainstem auditory evoked potentials. J Appl Oral Sci. 2009;17:57-62. Chart 1. Comparative summary of the results of this study in relation to the studies found in the specialized literature
Author Year Wave I
(standard deviation)
Wave III (standard deviation)
Wave V (standard deviation)
I-III (standard deviation)
III-V (standard deviation)
I-V (standard deviation) Characterization of group 1: newborns of 35-36 weeks of post-conceptual age
Present study 2012 1.81 (0.09) 4.74 (0.20) 7.14 (0.34) 2.89 (0.25) 2.41 (0.28) 5.33 (0.31)
Gorga et al.(11) 1987 1.78 (0.26) (ND) 7.01 (0.37) 2.84 (0.26) 2.39 (0.25) 5.24 (0.35)
Cox et al.(16) 1981 2.13 (0.69) 4.47 (0.71) 7.19 (0.48) 2.34 (ND) 2.72 (ND) 5.06 (0.56)
Characterization of group 2: newborns of 37-38 weeks of post-conceptual age
Present study 2012 1.79 (0.09) 4.62 (0.2) 7.05 (0.28) 2.83 (0.2) 2.42 (0.22) 5.23 (0.24) Gorga et al.(11) 1987 1.74 (0.20) (ND) 6.939 (0.419) 2.803 (0.307) 2.345 (0.260) 5.17 (0.40)
Cox et al.(16) 1981 2.02 (0.53) 4.61 (0.47) 7.01 (ND) 2.59 (ND) 2.40 (ND) 4.99 (0.48)
Characterization of group 3: newborns of 39-40 weeks
Present study 2012 1.79 (0.09) 4.56 (0.22) 6.90 (0.33) 2.77 (0.21) 2.42 (0.61) 5.08 (0.31) Gorga et al.(11) 1987 1.71 (0.23) (ND) 6.81 (0.38) 2.70 (0.26) 2.379 (0.246) 5.09 (0.35)
Cox et al.(16) 1981 1.79 (0.59) 4.26 (0.62) 6.72 (0.40) 2.47 (ND) 2.46 (ND) 4.93 (0.59)
Characterization of Group 4: infants with six months of age