STANDARDIZATION OF THE AUDITORY
BRAINSTEM RESPONSE IN NEWBORNS
Normatização do potencial evocado auditivo
de tronco encefálico em recém-nascidos
Tamier Viviane Souza Costa(1), Fernanda Soares Aurélio(2),
Virgínia Braz da Silva(3), Liliane Barbosa Rodrigues(4)
(1) São Lucas University, Porto Velho – RO, Brazil. (2) São Lucas University, Porto Velho – RO, Brazil. (3) São Lucas University, Porto Velho – RO, Brazil. (4) São Lucas University, Porto Velho – RO, Brazil. Conlict of interest: non-existent
diagnose and the accurate intervention, in ways to
optimize the development of speech and language of this child.
The American Academy of Pediatrics3, the
Joint Committee on Infant Hearing (JCIH)4 and the Multiprofessional Committee of Hearing Health
(COMUSA)5 preconize that every newborn must be
evaluated by electrophysiological measures.
The electrophysiological exams are the most
used to assess the auditory integrity because it does not depend on patient’s cognitive response to the sonorous stimulus, that is, its application is objective6. On the NHS programs the Evoked
Otoacoustic Emissions (OAE) and the Auditory Brainstem Response (ABR) are used. In case the
NHS fails the newborn should be submitted to the diagnostic stage in which one of the procedures is
the ABR diagnostic.
The ABR is an exam that aims to obtain the register of the electric activity occurring in the
auditory system to the brainstem, besides to be used to research the electrophysiological threshold
INTRODUCTION
The integrity of the auditory system, anatomic
and physiologically, is considered a prerequisite to
normal acquisition and development of speech and language. Therefore, a child must be capable to
pay attention, detect, distinguish and locate sounds. The auditory system also actuates on memory and
integration of hearing experiences. Everything to child achieves detection and comprehension of
speech1. Thus, the hearing impaired child, if not
early diagnosed, will have these abilities damaged2.
The Newborn Hearing Screening (NHS) is the main instrument for hearing impairment detection
in newborns2 and should be developed in the irsts
moments of the newborn’s life enabling the early
ABSTRACT
Purpose: to regulate the indings of ABR equipment of the institution Audiology Clinic of St. Luke School, in newborns. Methods: this is a cross-sectional study, exploratory non-experimental attended
forty newborns without risk indicators for hearing loss, which passed the newborn hearing screening, divided according to age in weeks (G1, G2, G3 and G4). For data collection was used the equipment Smart EP-Intelligent Hearing Systems with click stimuli. Results: the mean values of absolute
latencies of waves I, III and V in accordance with age are, respectively: G1=1,62ms, 4,39ms, 6,8ms; G2=1,62ms, 4,4ms, 6,79ms; G3=1,56ms, 4,39ms, 6,74ms; G4=1,54ms, 4,2ms, 6,53ms. In the same order, the mean values of the interpeak latencies I-III, III-V and I-V were: 2,77ms, 2,42ms e 5,19ms; 2,78ms, 2,39ms e 5,17ms; 2,83ms, 2,35ms e 5,18ms; 2,66ms, 2,33ms e 4,99ms. Conclusion: the
absolute latencies decreased with increasing age having mean of the 1,58ms for wave I, 4,34ms for wave III and 6,71ms for wave V. Similarly, the mean interpeak I-III, III-V and I-V were lower in G4 medium and obtained in the irst months of 2,76ms, 2,37ms and 5,13ms.
collection. It was adopted a 12% level of error and conidence level of 90%, achieving to a sample number of 40 newborns. The number of newborns
was divided into groups according to the age in
weeks.
The inclusion criteria to compose the sample
were: newborns that were on the irst month, that do not presented risks indicators according to JCIH4,
passed on ABR using Otoacoustic emissions and presented good reproducibility in the ABR tracing.
From the 40 newborns that participated on study, 20 were boys and 20 were girls. They were divided
into four groups of 10 newborns, being ive girls and ive boys in each group, named according to age, as to: G1 (1st week of life), G2 (2nd week of life), G3 (3rd
week of life) and G4 (4th week of life).
The approach on newborns’ parents and responsible was established during the ABR. At
this moment, it was explained the aim and method
-ology of the study, as well as it was developed an anamnesis focusing on investigate the risks indicators for hearing. The parents that agreed on the offspring’s participation were conducted to the
clinic in which was developed data collection.
All parents that attended to development of the exam were again elucidated about the aim of the
study and the procedures to be developed. Those
who agreed on the offspring’s participation assigned
a Consent Form.
The newborns were submitted to the ABR in the
same week that they were submitted to the NHS.
The parents were instructed to carry the result
of the NHS and in case of they did not accomplish,
it was developed a retest using the Transient Otoacoustic Emissions and only participated those
that obtained presence of it.
The exams were developed in room electrically
treated with the equipment Smart EP – Intelligent
Hearing Systems, version 2.40, attached to a
computer.
The participants remained on mother’s arms, in natural sleep. First the area was cleaned, using
gauze and alcohol. After cleaning, it was ixed three
disposable electrodes, which were: active electrode
(positive), located on high front; reference electrode
(negative), located on ipsilateral mastoid and neutral electrode, located on contralateral mastoid,
because it was an equipment of one canal. The
electrodes were connected to the equipment and
the impedance was checked. It remained inferior and evaluates the maturation of the central auditory
pathway in newborns7.
The maturation of the auditory pathway is
complete around 188,9 or 242 months of age, and this
becomes a variable to analysis of results obtained on ABR, since it has direct inluence over values of absolute and interpeaks latencies. Therefore,
it is necessary to obtain normative data, consid-ering, besides age, other variables as: gender, the equipment used and the stimulus given10.
Standard patterns are also less studied under
weak intensities (30 dB HL), being necessary a
standardization under these intensities. Thus, with the normative data will be possible an early diagnose and posterior intervention, that is essential in the
irsts moths of age, since the hearing impairment can restrict severely the capacity of oral language development and further deicit on the global devel
-opment and life quality2.
There are studies have already been published that bring normative data to ABR, although, it is
necessary to take into account if the patterns of
stimulus given and the subject tested are the same
as in the study used as reference. Due to many studies do not specify details about the patterns, the data to be used in the interpretation of the ABR outcomes should be obtained from the normative
study on the laboratory11, which justiies the impor
-tance of this research, revealing accurate data to an
early diagnose.
So, the present study aimed to standard the
outcomes in newborns of the ABR equipment using the click stimulus under 80 and 30 dB HL at the
Speech-language Pathology and Audiology Clinic
of São Lucas University – FSL.
METHODS
It is a cross sectional study, exploratory, non-experimental. First it was sent a presentation
letter and authorization application to the
coordi-nation of the Speech-Language Pathology and Audiology Clinic at the institution where the exams
were developed. Also were sent presentation letters
This study was approved by the Committee of Ethics on Research with Human Beings of São
Lucas University under no 590 /11.
The data were set out in an Excel sheet and
submitted to the statistic tests Pared T-Student,
ANOVA and Tukey Multiple Comparison Test., adopting signiicance level of 5%.
To the analysis of the values of absolute latencies under 80 dB HL and 30 dB HL it was considered the
ears individually, so the sample was composed by 80 ears.
RESULTS
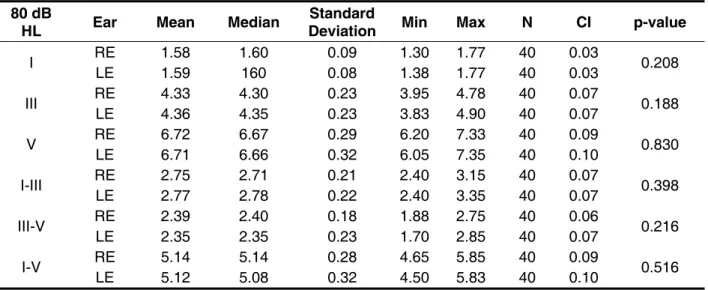
It was not found statistically signiicant difference when comparing the values of absolute latencies on waves I, III and V and of interpeak intervals under 80 dB HL (Table 1) as well as the absolute latencies III and V under 30 dB HL (p= 0.822 and p=0.419,
respectively).
Under 80 dB HL intensity can be veriied difference statistically signiicant in values of
absolute latencies on waves I, III and V among the
different groups (Table 2). per second, registering a minimum number of 1000
stimuli.
First, the exam was developed under intensity of dB HL and after obtaining the tracing on waves I, III and V, they were identiied and reported. Further, it was developed the research under intensity of 30 dB HL and reported waves that appeared (usually
waves III and V). Such procedure was developed in both ears.
It was analyzed the values of absolute latencies on waves I, II and V and the interpeaks intervals I-III, III-V and I-V under 80 dB HL as well as the values of absolute latencies on waves III (when occur) and V under 30 dB HL in right and left ear and the interarual difference.
The average values of the absolute latencies on waves I, III and V under intensity of 80 dB HL and the
absolute latencies on waves III and V under intensity
30 dB HL were calculated and it was made the evaluation of these values between the ears, among the different groups and inside groups according to gender. The average values of interpeak intervals
also were calculated and compared according to the ear, as well as among the groups and inside the groups according to gender.
Table 1 – Evaluation of the absolute latencies and interpeaks values according to the tested ear under intensity of 80 dB Hearing Level
*signiicant value (p<0.05) – Test T-Student paired
Caption: dB HL = decibels hearing levels; Min = minor value; Max = maximum value; N = sample number; CI = conidence interval; RE = right ear; LE = left ear
80 dB
HL Ear Mean Median Deviation Standard Min Max N CI p-value
I RE LE 1.58 1.59 1.60 160 0.09 0.08 1.30 1.38 1.77 1.77 40 40 0.03 0.03 0.208
III RE LE 4.33 4.36 4.30 4.35 0.23 0.23 3.95 3.83 4.90 4.78 40 40 0.07 0.07 0.188
V RE LE 6.72 6.71 6.67 6.66 0.29 0.32 6.20 6.05 7.35 7.33 40 40 0.10 0.09 0.830
I-III RE LE 2.75 2.77 2.71 2.78 0.21 0.22 2.40 2.40 3.35 3.15 40 40 0.07 0.07 0.398
III-V RE LE 2.39 2.35 2.40 2.35 0.18 0.23 1.88 1.70 2.85 2.75 40 40 0.07 0.06 0.216
80 dB
HL Group Mean Median Deviation Standard Min Max N CI p-value
I
G1 1.62 1.60 0.10 1.38 1.77 20 0.05
0.01*
G2 1.62 1.63 0.05 1.50 1.75 20 0.02
G3 1.56 1.57 0.08 1.38 1.68 20 0.03
G4 1.54 1.55 0.08 1.30 1.68 20 0.03
III
G1 4.39 4.29 0.27 4.03 4.90 20 0.12
0.01*
G2 4.40 4.39 0.21 4.03 4.88 20 0.09
G3 4.39 4.40 0.12 4.03 4.58 20 0.05
G4 4.20 4.17 0.23 3.83 4.80 20 0.10
V
G1 6.80 6.75 0.31 6.33 7.22 20 0.13
0.02*
G2 6.79 6.83 0.22 6.33 7.10 20 0.10
G3 6.74 6.66 0.31 6.15 7.35 20 0.14
G4 6.53 6.50 0.31 6.05 7.33 20 0.14
I-III
G1 2.77 2.70 0.25 2.43 3.35 20 0.11
0.08
G2 2.78 2.75 0.21 2.43 3.23 20 0.09
G3 2.83 2.84 0.14 2.58 3.10 20 0.06
G4 2.66 2.64 0.22 2.40 3.20 20 0.10
III-V
G1 2.42 2.40 0.16 2.10 2.75 20 0.07
0.57
G2 2.39 2.39 0.17 2.13 2.65 20 0.07
G3 2.35 2.35 0.29 1.70 2.85 20 0.13
G4 2.33 2.37 0.18 1.88 2.70 20 0.08
I-V
G1 5.19 5.19 0.27 4.75 5.67 20 0.12
0.11
G2 5.17 5.20 0.22 4.73 5.48 20 0.10
G3 5.18 5.08 0.35 4.55 5.85 20 0.15
G4 4.99 4.98 0.30 4.50 5.73 20 0.13
Table 2 – Absolute and interpeak latencies values under intensity 80 dB HL, according to the group
*signiicant value (p<0.05) – Test ANOVA
Caption: dB HL = decibels hearing level; Min = minor value; Max = maximum value; N = sample number; CI = conidence interval; G1 = 1st week newborn, G2 = 2nd week newborn; G3 = 3rd week newborn; G4 = 4th week newborn
Confronting the groups outcomes in pairs using the Tukey Multiple Comparison Test, it was veriied difference statistically signiicant between values of absolute latencies on waves I and V, under 80 dB HL of G4 when compared to the same values of G1 (p=0.025) and G2 (p=0.020), being the values in G4 inferior to those observed in these groups. However, the absolute latency on wave III, obtained in G4, presented difference when compared to values reported on other groups: G1 (p=0.040),
G2 (p=0.025) e G3 (p=0.039), again being veriied inferior values in G4. Regarding interpeak latencies I-III, III-V and I-V there were no difference statisti
-cally signiicant when comparing the outcomes of the four groups.
0.13 ms; 0.16 ms and 0.09 ms. It was conclude no
difference statistically signiicant for those averages.
On the results obtained according to gender, it
was found values signiicantly inferior in the feminine gender for absolute latencies on waves I and III in G2 and for the absolute latency on wave V in G4
(Table 4).
It was observed difference statistically signiicant between outcomes of G2 and G4 (p= 0.049), in which G4 presented absolute latency value signii
-cantly inferior, when comparing the groups in pairs, using the Tukey Multiple Comparison Test.
The results to the averages of intraural difference in G1, G2, G3 and G4 were, respectively, 0.14 ms;
30 dB HL Mean Median Deviation Standard Min Max N CI p-value
III
G1 5.96 5.99 0.33 5.40 6.55 18 0.15
0.424
G2 5.96 5.88 0.39 5.28 6.55 19 0.17
G3 5.90 5.88 0.21 5.58 6.22 17 0.10
G4 5.80 5.78 0.36 5.22 6.55 19 0.16
V
G1 8.08 8.13 0.32 7.58 8.68 20 0.14
0.036*
G2 8.10 8.02 0.41 7.42 8.78 20 0.18
G3 8.04 7.94 0.32 7.67 8.63 20 0.14
G4 7.80 7.83 0.37 7.15 8.65 20 0.16
Table 3 – Absolute latency values under intensity 30 dB HL, according to the group
*signiicant value (p<0.05) – Test ANOVA
80 dB
HL Group Gender Mean Median Standard Deviation Min Max N CI p-value
I
G1 Fem. 1.60 1.63 0.12 1.38 1.75 10 0.07 0.645
Masc. 1.63 1.60 0.09 1.50 1.77 10 0.06
G2 Fem. 1.59 1.60 0.05 1.50 1.65 10 0.03 0.017*
Masc. 1.65 1.65 0.05 1.57 1.75 10 0.03
G3 Fem. 1.54 1.56 0.05 1.45 1.60 10 0.03 0.271
Masc. 1.58 1.60 0.10 1.38 1.68 10 0.06
G4 Fem. 1.54 1.55 0.10 1.30 1.68 10 0.06 0.788
Masc. 1.55 1.55 0.06 1.43 1.63 10 0.04
III
G1 Fem. 4.30 4.25 0.26 4.03 4.78 10 0.16 0.184
Masc. 4.47 4.44 0.27 4.13 4.90 10 0.17
G2 Fem. 4.25 4.27 0.14 4.03 4.45 10 0.08 0.001*
Masc. 4.54 4.53 0.18 4.35 4.88 10 0.11
G3 Fem. 4.38 4.39 0.15 4.03 4.58 10 0.09 0.856
Masc. 4.39 4.43 0.08 4.25 4.47 10 0.05
G4 Fem. 4.12 4.14 0.10 3.95 4.25 10 0.06 0.127
Masc. 4.28 4.24 0.30 3.83 4.80 10 0.18
V
G1 Fem. 6.80 6.67 0.32 6.35 7.22 10 0.20 0.894
Masc. 6.81 6.83 0.30 6.33 7.22 10 0.19
G2 Fem. 6.69 6.79 0.21 6.33 6.92 10 0.13 0.062
Masc. 6.88 6.94 0.20 6.53 7.10 10 0.12
G3 Fem. 6.78 6.64 0.31 6.53 7.35 10 0.19 0.558
Masc. 6.70 6.70 0.32 6.15 7.20 10 0.20
G4 Fem. 6.39 6.40 0.24 6.05 6.75 10 0.15 0.035*
Masc. 6.68 6.56 0.32 6.40 7.33 10 0.20
Table 4 – Evaluation of the absolute latencies as to the gender under intensity 80 dB HL
*signiicant value (p<0.05) – Test ANOVA
Caption: dB HL = decibels hearing level; Min = minor value; Max = maximum value; N = sample number; CI = conidence interval; G1 = 1st week newborn, G2 = 2nd week newborn; G3 = 3rd week newborn; G4 = 4th week newborn; Fem. = feminine; Masc. = masculine.
Under the same intensity, still regarding results
obtained according to gender, it was found values signiicantly inferior in the feminine gender for
80 dB
HL Group Gender Mean Median Standard Deviation Min Max N CI p-value
I-III
G1 Fem. 2.71 2.65 0.24 2.43 3.13 10 0.15 0.252
Masc. 2.84 2.80 0.26 2.52 3.35 10 0.16
G2 Fem. 2.67 2.63 0.14 2.43 2.90 10 0.09 0.008*
Masc. 2.90 2.89 0.20 2.63 3.23 10 0.12
G3 Fem. 2.84 2.85 0.14 2.58 3.10 10 0.09 0.702
Masc. 2.82 2.83 0.14 2.60 3.03 10 0.09
G4 Fem. 2.59 2.61 0.15 2.40 2.80 10 0.09 0.131
Masc. 2.73 2.66 0.26 2.40 3.20 10 0.16
III-V
G1 Fem. 2.49 2.49 0.19 2.22 2.75 10 0.12 0.043*
Masc. 2.35 2.36 0.10 2.10 2.45 10 0.06
G2 Fem. 2.44 2.45 0.18 2.15 2.65 10 0.11 0.159
Masc. 2.33 2.34 0.14 2.13 2.55 10 0.09
G3 Fem. 2.40 2.35 0.25 2.15 2.82 10 0.15 0.499
Masc. 2.31 2.38 0.34 1.70 2.85 10 0.21
G4 Fem. 2.27 2.24 0.22 1.88 2.70 10 0.13 0.101
Masc. 2.40 2.41 0.11 2.23 2.58 10 0.07
I-V
G1 Fem. 5.20 5.22 0.27 4.75 5.52 10 0.17 0.918
Masc. 5.19 5.16 0.29 4.75 5.67 10 0.18
G2 Fem. 5.11 5.19 0.21 4.73 5.32 10 0.13 0.214
Masc. 5.23 5.33 0.23 4.78 5.48 10 0.14
G3 Fem. 5.24 5.13 0.32 4.93 5.85 10 0.20 0.467
Masc. 5.12 5.04 0.38 4.55 5.83 10 0.24
G4 Fem. 4.85 4.94 0.24 4.50 5.20 10 0.15 0.034*
Masc. 5.13 5.01 0.30 4.85 5.73 10 0.18
Table 5 – Evaluation of the interpeak latencies as to the gender under intensity 80 dB HL
*signiicant value (p<0.05) – Test ANOVA
Caption: dB HL = decibels hearing level; Min = minor value; Max = maximum value; N = sample number; CI = conidence interval; G1 = 1st week newborn, G2 = 2nd week newborn; G3 = 3rd week newborn; G4 = 4th week newborn; Fem. = feminine; Masc. = masculine.
Opposite to the previous results, the interpeak latency III-V in G1 presented value inferior in the
masculine gender.
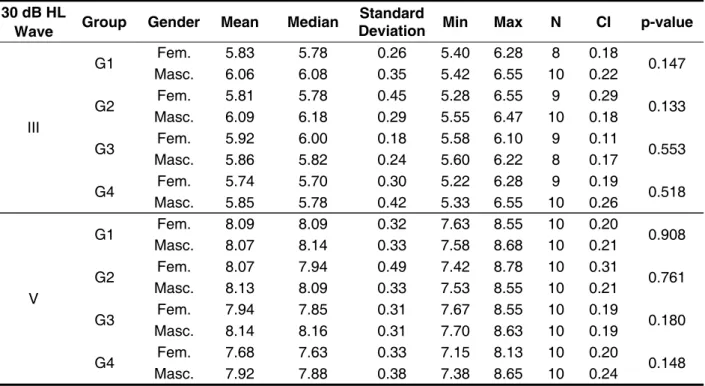
Still regarding the indings according to the gender, however, under intensity 30 dB HL, it was proved there is no difference statistically signiicant
and the same age population, obtained values
of absolute latencies on waves I, III and V of 1.84
ms; 4.62 ms and 6.85 ms, respectively, have being
found to interpeaks latencies the values 2.78 ms;
2.21 and 5.00. The absolute latencies values on
waves I and III (1.58 ms and 4.34 ms) found in this study had shown to be inferior to the proposed on the above mentioned. However, the value of absolute latency on wave V (6.71 ms), as well as the interpeak latencies (2.72 ms; 2.37 ms and 5.13
ms) had shown to be similar to the previous study.
Moreover, the resulted of this research showed there is no difference between values of absolute and interpeaks latencies between right and left
ear, what corroborates with other studies11,16,17, for
individuals with normal peripheral auditory system should present similar responses between ears, since the anatomic structures investigated by ABR belong to brainstem. Thus, they are used by both ear when there is sonorous stimulation9,11.
DISCUSSION
This study allowed to conirm what was reported
in literature9,12,13, that is, with increasing age the
values of the absolute latencies of waves I, III and V
reduces, due to the responses to ABR in newborns
suffer inluence of the maturational process of the
auditory system9.
The development and maturation of the peripheral portion of this system, which comprehend the external and mean ear, cochlea and eighth
cranial nerve, where generates wave I, is complete around 24th gestational week and presents itself
totally formed at birth14. Such process was evident
in this study and is veriied by the absolute latency of wave I, which reached the value similar to the adults yet on the irst month of life. This maturation implies on the increasing of interpeak latency I-III and I-V and further shortening of it through aging, this was veriied on this study and corroborates with . Therefore it is extremely important to
30 dB HL
Wave Group Gender Mean Median Standard Deviation Min Max N CI p-value
III
G1 Fem. 5.83 5.78 0.26 5.40 6.28 8 0.18 0.147
Masc. 6.06 6.08 0.35 5.42 6.55 10 0.22
G2 Fem. 5.81 5.78 0.45 5.28 6.55 9 0.29 0.133
Masc. 6.09 6.18 0.29 5.55 6.47 10 0.18
G3 Fem. 5.92 6.00 0.18 5.58 6.10 9 0.11 0.553
Masc. 5.86 5.82 0.24 5.60 6.22 8 0.17
G4 Fem. 5.74 5.70 0.30 5.22 6.28 9 0.19 0.518
Masc. 5.85 5.78 0.42 5.33 6.55 10 0.26
V
G1 Fem. 8.09 8.09 0.32 7.63 8.55 10 0.20 0.908
Masc. 8.07 8.14 0.33 7.58 8.68 10 0.21
G2 Fem. 8.07 7.94 0.49 7.42 8.78 10 0.31 0.761
Masc. 8.13 8.09 0.33 7.53 8.55 10 0.21
G3 Fem. 7.94 7.85 0.31 7.67 8.55 10 0.19 0.180
Masc. 8.14 8.16 0.31 7.70 8.63 10 0.19
G4 Fem. 7.68 7.63 0.33 7.15 8.13 10 0.20 0.148
Masc. 7.92 7.88 0.38 7.38 8.65 10 0.24
Table 6 – Evaluation of the absolute latencies as to the gender under intensity of 30 dB HL
*signiicant value (p<0.05) – Test ANOVA
CONCLUSION
The present study obtained normative data in newborns to the equipment Smart EP - Intelligent
Hearing Systems, version 2.40, which will be used in the electrophysiology laboratory of the
Speech-Language Pathology and Audiology clinic at São Lucas University.
It can be conclude that the absolute latencies reduced with increasing age, having in newborns average 1.58 ms to wave I; 4.34 ms to wave III and
6.71 ms to wave V, under intensity 80 dB HL. In the same way, the average of interpeaks I-III, III-V, I-V was inferior in G4 and the average in the irst month was 2.76 ms, 2.37 ms and 5.13 ms,
respectively.
As to the value of intraural difference, for the used equipment, it was found average 0.13 ms. To absolute latency on wave V under 30 dB HL the
average was 8ms.
study, it was observed that the averages found in the four groups are inferior to the values referred,
supporting the literature18,19.
Regarding to the gender, this study found absolute latencies on waves I,III and V inferior in feminine gender, under intensity 80 dB HL. This
data supports other studies consulted11, 20-22, and it
is justiied by the anatomic and diameter differences of the hearing nerve between genders8, 23 or due to
the fact of the cochlear responses to be faster in
women24.
This study disagrees to previous research25 that
did not ind statistically signiicant difference for
absolute latencies on waves I, III and V between
genders under 80 dB HL.
The result of the absolute latency on wave V, under 30 dB HL, yet according to gender, conirms
the study25 developed with infants, under intensity
20 dB HL, which also did not observed differences
between genders.
REFERENCES
1. Azevedo MF. Programa de Prevenção e
Identiicação Precoce dos Distúrbios da Audição.
Em: Schochat E. Processamento Auditivo.São
Paulo, Lovise, 1996. 75-105.
2. Sousa LCA, Piza MRT, Alavarenga KF, Coser PL.
Potencial Evocado Auditivo de Tronco Encefálico
(PEATE). Em: Sousa LCA, Piza MRT, Alvarenga KF,
Coser PL. Eletroisiologia da audição e emissões
otoacústicas: princípios e aplicações clínicas. São
Paulo: Tecmedd, 2008.
3. American Academy of Pediatrics. Task force on newborn and infant hearing. Pediatrics. 1999;103(2):527-9.
4. Joint Committee on Infant Hearing, Year 2007 Position Statement: Principles and Guidelines for Early Hearing Detection and Intervention Programs. J Pediatrics. 2007;120(4):898-921.
5. Comitê multiproissional em saúde auditiva: COMUSA/Multiprofessional committee on auditory
RESUMO
Objetivo: normatizar os achados do equipamento de PEATE da Clínica de Fonoaudiologia da insti -tuição de origem, em recém-nascidos. Métodos: trata-se de um estudo transversal, exploratório não
experimental do qual participaram quarenta recém-nascidos, sem indicadores de risco para a dei -ciência auditiva, que passaram na triagem auditiva neonatal, divididos de acordo com a idade, em
semanas (G1, G2, G3 e G4). Para a coleta de dados foi utilizado o equipamento Smart EP-Intelligent Hearing Systems com estímulo clique. Resultados: a média dos valores das latências absolutas das
ondas I, III e V de acordo com a idade são, respectivamente: G1=1,62ms, 4,39ms, 6,8ms; G2=1,62ms, 4,4ms, 6,79ms; G3=1,56ms, 4,39ms, 6,74ms; G4=1,54ms, 4,2ms, 6,53ms. Na mesma ordem, a média dos valores das latências interpico I-III, III-V e I-V foram: 2,77ms, 2,42ms e 5,19ms; 2,78ms, 2,39ms e 5,17ms; 2,83ms, 2,35ms e 5,18ms; 2,66ms, 2,33ms e 4,99ms. Conclusão: as latências absolutas
diminuíram com o aumento da idade tendo média de 1,58ms para a onda I, 4,34ms para a onda III e 6,71ms para a onda V. Da mesma forma, as médias dos interpicos I-III, III-V e I-V foram menores no G4 e obteve-se médias, no primeiro mês, de 2,76ms, 2,37ms e 5,13ms.
DESCRITORES: Audição; Eletroisiologia; Recém-Nascido; Potenciais Evocados Auditivos de Tronco
15. Cavalcante J. Registro dos Potenciais Evocados
Auditivos de Tronco Encefálico por estímulos click e
tone burst em recém-nascidos a termo e pré-termo [dissertação]. Ribeirão Preto (SP): Faculdade de Medicina de Ribeirão Preto da Universidade de São Paulo, 2010.
16. Pinto FR, Matas CG. Comparação entre limiares de audibilidade e eletroisiológico por estímulo tone burst. Braz J Otorhinolaryngol. 2007;73(4):513-22. 17. Porto MAA, Azevedo MF, Gil D. Auditory evoked potentials in premature and full-term infants. Braz J Otorhinolaryngol. 2011;77(5):622-7.
18. Yiap KH, Kunaratnam N. Auditory brainstem
responses in normal hearing ears. Ann Acad Med Singapore 1985;14(1):60-4.
19. Gorga M, Kaminski J, Beauchaine K, Jesteadt W, Neely S. Auditory brainstem responses from children three months to three years of age: normal patterns of response II. J Speech Hear Res.
1989;32(2):281-8.
20. Soares IA, Menezes PL, Carnaúba ATL, Pereira
LD. Padronização do potencial evocado auditivo de
tronco encefálico utilizando um novo equipamento. Pró-Fono Revista de Atualização Cientíica.
2010;22(4):421-6.
21. Anias R, Lima MAMT, Kós AOA. Avaliação da inluência da idade no potencial evocado auditivo de tronco encefálico. Rev Bras Otorrino¬laringol. 2004;70(1):84-9.
22. Lourenço EA, Oliveira MH, Umemura A,
Vargas AL, Lopes KC, Pontes JRA. Audiometria
de resposta evocada de acordo com sexo e idade:
achados e aplicabilidade. Braz J Otorhinolaryngol.
2008;74(4):545-51.
23. Rowe MJ. Normal Variability of the brain stem auditory evoked response in young and old adult
subjects. Electroencephalography and Clinical
Neurophysiology. 1978;44(4):459-70.
24. Don M, Ponton CW, Eggermont JJ, Masuda
A. Auditory brainstem response (ABR) peak amplitude variability relects individual differences
in cochlear response times. J Acoust Soc Am.
1994;96(6):3476-91.
25. Casali RL, Santos MFC. Auditory Brainstem
Evolked Response: response patterns of full-term and premature infants. Braz J Otorhinolaryngol. 2010; 76(6):729-38.
health: COMUSA Lewis, Doris Ruthy; Marone, Silvio Antonio Monteiro; Mendes, Beatriz C.A; Cruz,
Oswaldo Laercio Mendonça; Nóbrega, Manuel. Braz J Otorhinolaryngol. 2010;76(1):121-8.
6. Quimonez RE, Rodriguez Q. Comparison of neonatal hearing screening devices. PR Health Sci
J. 2001;20(4):361-5.
7. Jiang ZD, Brosi DM, Li ZH, Chen C, Wilkinson A. Brainstem Audi¬tory Function at Term in Preterm
Babies With and Without Perinatal Complications. Pediatr Res. 2005;58(6):1164-9.
8. Jeger J, Hall J. Effects of age and sex on
Auditory Brainstem Response. Arch Otolatyngol.
1980;106(7):387-91.
9. Sleifer P, Costa SS, Cóser PL, Goldani MZ,
Dornelles C, Weiss K. Auditory brainstem response
in premature and full-term children. Int J Pediatr Otorhinolaryngol. 2007;71(9):1449-56.
10. Matas CG. Medidas eletroisiológicas da audição. Audiometria de tronco encefálico. Em:
Carvallo RMM, organizadora. Fonoaudiologia
informação para a formação – Procedimentos em Audiologia. 1st ed. Rio de Janeiro: Guanabara Koogan; 2003. p. 43-57.
11. Esteves MCBN, DellAringa AHB, Arruda GV,
DellAringa AR, Nardi JC. Estudo das latências das ondas dos potenciais auditivos de tronco
encefálico em indivíduos normo-ouvintes. Braz J Otorhinolaryngol. 2009;75(3):420-5.
12. Zimmerman MC, Morgan DE, Dubno JR. Auditory brainstem evoked response characteristics in developing infants. Ann. Otol. Rhinol. Laryngol. 1987;96(3):291-9.
13. Sleifer P. Estudo da maturação das vias auditivas
por meio dos potenciais evocados auditivos de
tronco encefálico em crianças nascidas pré-termo
[dissertação]. Porto Alegre (RS): Universidade
Federal do Rio Grande do Sul, 2008.
14. Andrade GMQ, Resende LM, Goulart EMA, Siqueira AL, Vitor RWA, Januário JN. Deiciência auditiva na toxoplasmose congênita detectada
pela triagem neonatal. Braz J Otorhinolaryngol.
2008;74(1):21-8.
Received on: April 13, 2012
Accepted on: August 07, 2012