Increasing the Number of Mitochondria through
Activation of mTORC1
Maki Koyanagi1, Shun-ichiro Asahara1, Tomokazu Matsuda1, Naoko Hashimoto1, Yutaka Shigeyama1,
Yuki Shibutani1, Ayumi Kanno1, Megumi Fuchita3, Tomoko Mikami3, Tetsutya Hosooka1, Hiroshi Inoue4, Michihiro Matsumoto7, Masato Koike5, Yasuo Uchiyama5, Tetsuo Noda6, Susumu Seino1,2, Masato Kasuga7, Yoshiaki Kido1,3*
1Division of Diabetes and Endocrinology, Kobe University Graduate School of Medicine, Kobe, Japan,2Division of Cellular and Molecular Medicine, Kobe University Graduate School of Medicine, Kobe, Japan,3Kobe University Graduate School of Health Sciences, Kobe, Japan,4Frontier Science Organization, Kanazawa University, Kanazawa, Japan,5Department of Cell Biology and Neurosciences, Juntendo University Graduate School of Medicine, Tokyo, Japan,6Department of Cell Biology, Cancer Institute, Japanese Foundation of Cancer Research, Tokyo, Japan,7Research Institute National Center for Global Health and Medicine, Tokyo, Japan
Abstract
Aim:We previously found that chronic tuberous sclerosis protein 2 (TSC2) deletion induces activation of mammalian target of rapamycin Complex 1 (mTORC1) and leads to hypertrophy of pancreatic beta cells from pancreatic beta cell-specific TSC2 knockout (bTSC22/2) mice. The present study examines the effects of TSC2 ablation on insulin secretion from pancreatic
beta cells.
Methods:Isolated islets frombTSC22/2mice and TSC2 knockdown insulin 1 (INS-1) insulinoma cells treated with small
interfering ribonucleic acid were used to investigate insulin secretion, ATP content and the expression of mitochondrial genes.
Results: Activation of mTORC1 increased mitochondrial DNA expression, mitochondrial density and ATP production in pancreatic beta cells ofbTSC22/2 mice. In TSC2 knockdown INS-1 cells, mitochondrial DNA expression, mitochondrial
density and ATP production were increased compared with those in control INS-1 cells, consistent with the phenotype of
bTSC22/2mice. TSC2 knockdown INS-1 cells also exhibited augmented insulin secretory response to glucose. Rapamycin
inhibited mitochondrial DNA expression and ATP production as well as insulin secretion in response to glucose. Thus,
bTSC22/2 mice exhibit hyperinsulinemia due to an increase in the number of mitochondria as well as enlargement of
individual beta cells via activation of mTORC1.
Conclusion:Activation of mTORC1 by TSC2 ablation increases mitochondrial biogenesis and enhances insulin secretion from pancreatic beta cells.
Citation:Koyanagi M, Asahara S-i, Matsuda T, Hashimoto N, Shigeyama Y, et al. (2011) Ablation of TSC2 Enhances Insulin Secretion by Increasing the Number of Mitochondria through Activation of mTORC1. PLoS ONE 6(8): e23238. doi:10.1371/journal.pone.0023238
Editor:Siyaram Pandey, University of Windsor, Canada
ReceivedMarch 31, 2011;AcceptedJuly 9, 2011;PublishedAugust 19, 2011
Copyright:ß2011 Koyanagi et al. This is an open-access article distributed under the terms of the Creative Commons Attribution License, which permits unrestricted use, distribution, and reproduction in any medium, provided the original author and source are credited.
Funding:This work was supported by a grant for the Cooperative Link of Unique Science and Technology for Economy Revitalization (CLUSTER) from the Ministry of Education, Culture, Sports, Science and Technology (MEXT), Japan, to M. Kasuga; a Grant-in-Aid for Creative Scientific Research from MEXT to M. Kasuga (18GS0317), a Grant-in-Aid for Scientific Research from MEXT to Y. Kido (22590981) and the Program for Promotion of Basic and Applied Research for Innovations in Bio-oriented Industry (BRAIN) to H. Inoue. The funders, however, had no role in study design, data collection and analysis, decision to publish, or preparation of the manuscript.
Competing Interests:The authors have declared that no competing interests exist. * E-mail: [email protected]
Introduction
Type 2 diabetes mellitus is characterised by insulin resistance in peripheral tissues and pancreatic beta cell failure. Impairment of insulin secretory capacity has been shown to contribute to the onset of type 2 diabetes. It remains controversial whether such impairment of insulin secretory capacity is caused by an impairment of the functions of pancreatic beta cells alone, whether it occurs as a result of a decrease in pancreatic beta cell mass alone, or whether both factors are involved and influence each other [1–4]. It is therefore important to clarify the mechanism of the
impairment of insulin secretory capacity in order to elucidate the mechanism of pathogenesis of type 2 diabetes.
tricarboxylic acid cycle and is oxidised to CO2and H2O with the
generation of ATP in mitochondria [8]. It has been reported that no glucose-responsive insulin secretion is found in MIN6 cells depleted of mitochondrial DNA [9]. In addition, decreased insulin secretory capacity, decreased ATP production and abnormalities in mitochondrial morphology have been found in isolated islets from mouse models of diabetes and patients with type 2 diabetes [10,11]. Thus, mitochondria are clearly associated with the cellular functions of pancreatic beta cells.
We have previously shown that the insulin signalling pathway is responsible for regulation of both the number and size of pancreatic beta cells in mice [6,12]. Tuberous sclerosis is an autosomal dominant disorder characterised by formation of hamartomas. The genes for tuberous sclerosis complex (TSC) 1 and TSC2 have been identified as causative genes of inherited TSC [13,14]. Akt-mediated multiple phosphorylation of TSC2 inhibits its ability to act as a GTPase-activating protein toward Rheb, resulting in activation of mTOR complex 1 (mTORC1) [15]. Previously, we found that pancreatic beta cell–specific TSC2 knockout (bTSC22/2) mice, in which mTORC1 is constitutively active, exhibited an increase in the size of individual beta cells and a decrease in the number of beta cells via a negative feedback mechanism [12]. Alongside this role in the regulation of pancreatic beta cell mass, we also found that ablation of TSC2 in pancreatic beta cells may augment the ability to secrete insulin [12].
The above results prompted us to consider that mTORC1 might regulate not only pancreatic beta cell mass but also insulin secretion, and therefore in the present study we analysed the islets of pancreatic beta cell-specific TSC2 knockout (bTSC22/2) mice
and a TSC2 knockdown beta cell line. Here we succeeded in showing that constitutive activation of mTORC1 enhances insulin secretion by increasing the number of mitochondria.
Methods
Mice
We generated heterozygous pancreatic beta cell–specific TSC2 knockout (bTSC2+/2) mice by crossingTSC2flox/flox
mice [12] with those that express theCrerecombinase gene under the control of the rat insulin-2 gene [16] as described previously [12]. Animals were maintained on a 12 h light, 12 h dark cycle and fed normal chow from the time of weaning (3 weeks old), as described [17,18]. This study was performed in accordance with the guidelines of the Animal Ethics Committee of Kobe University Graduate School of Medicine.
Cell culture and transfection of siRNA
At 24 h before transfection, INS-1 cells were re-plated in 12 well plates (60 mm dishes) and transfected with small interfering RNA (siRNA) for TSC2 (SMARTpool; Dharmacon, Lafayette, CO, USA) or scramble controls (Non-Targeting siRNA#2; Dharma-con) with DharmaFECT2 transfection reagent (DharmaDharma-con). After a further incubation of 24 h for mRNA or 72 h for protein, the cells were harvested for evaluation of insulin secretion and mRNA or protein expression.
Assay of insulin secretion from isolated islets
Islets were isolated from 8-week-old mice as described previously [18,19]. To assay insulin release, 5 islets were manually selected, incubated in Krebs-Ringer solution and stimulated at 37uC with various concentrations of either glucose for 1 h or KCl for 30 min. The islets were then collected by centrifugation, and the supernatant was assayed for insulin secretion by an ELISA kit
with a mouse insulin standard (Shibayagi Co., Gunma, Japan). For measurement of islet insulin content, islets were solubilised in acid-ethanol solution (74% acid-ethanol, 1.4% HCl) overnight at 4uC before insulin ELISA.
Insulin secretion from INS-1 cells was measured after a 30 min incubation in Krebs-Ringer-bicarbonate-4-(2-hydroxyethyl)-1-pi-perazine ethanesulfonic acid (HEPES) buffer (KRBH; 140 mM NaCl, 3.6 mM KCl, 0.5 mM NaH2PO4, 0.5 mM MgSO4,
1.5 mM CaCl2, 2 mM NaHCO3, 10 mM HEPES, and 0.1%
BSA) containing the indicated stimulators. The insulin content was determined after extraction with acid ethanol.
ATP content
Isolated islets derived from 8-week-old mice were incubated with 2.8 mM and 11.2 mM glucose for 1 h after a 30 min starvation. ATP levels were measured with Cellno ATP Assay Kit Type N (TOYO BNet Co., Ltd, Tokyo, Japan). Luminescence of an aliquot of the solution was measured with a luminometer.
INS-1 cells were plated in a 96 well microtest tissue culture plate (35-3072; BD Falcon, Franklin Lakes, NJ, USA). The next day, siRNAs for TSC2 and scramble controls were transfected into the cells. After 48 h, ATP levels were determined using a ‘Cellno’ ATP Assay Kit Type N (TOYO BNet) according to the manufacturer’s instructions. Briefly, 100mL of the lysis/assay solution provided by the manufacturer was added to the cells. After shaking for 1 min and incubating for 10 min at 23uC, luminescence of an aliquot of the solution was measured in a luminometer.
Real-time RT-PCR analysis
Total cellular RNA was extracted from islets isolated from control andbTSC22/2mice and INS-1 cells with an RNeasy kit
(QIAGEN, Valencia, CA, USA). Real-time RT-PCR analysis of the total RNA pooled from 6 animals of each genotype was performed as described previously [20]. For real-time quantitative reverse transcription and PCR analysis, cDNA synthesized from total RNA was evaluated in a sequence detector (model 7900; Applied Biosystems, Foster City, CA, USA) with specific primers and SYBR Green PCR Master Mix (Applied Biosystems). The relative abundance of mRNAs was calculated with cyclophilin
mRNA as the invariant control. Details of the primers used for RT-PCR can be found in Table S1.
MitoTracker Red staining
After washing the cells with phosphate buffered saline, INS-1 cells were stained with 20 nM MitoTracker Red (Invitrogen, Carlsbad, CA, USA) and subjected to fluorescence-activated cell sorting (FACS) analysis. A minimum of 10,000 cells were analyzed on a BD FACSCalibur cell sorter (BD Biosciences, San Jose, CA, USA) using Cell Quest software (BD Biosciences). The mean fluorescence intensity was plotted for each treatment.
Electron microscopy
Two TSC2flox/floxand two bTSC22/2 mice were anesthetised
microscope (7100; Hitachi, Tokyo, Japan). For light microscopy, 1mm–thick sections were cut and stained with toluidine blue.
Morphometry
Morphometric analysis of the mitochondria in pancreatic beta cells was performed as described previously [21]. Briefly, electron micrographs of pancreatic beta cells were taken at a primary magnification of 65000 (n = 23 for control and n = 21 for
bTSC22/2 mice). After printing at62.9 the original magnifica-tion on projecmagnifica-tion papers, we estimated the mitochondrial density volume by point counting, using a double-lattice test system with a 1.5 cm spacing. The volume density (Vv) of mitochondria was expressed as percent volume: Vv = (Pi/Pt)6100 (%), where Pi is the number of points falling on each mitochondrial structure and Pt is the number of points falling on the cytoplasm of pancreatic beta cells.
Immunoblot analysis
We prepared lysates of isolated islets or INS-1 cells as described [17,18]. The lysates were probed with antibodies to TSC2, Akt, the phospho-Thr308form of Akt, the phospho-Ser473form of Akt,
p70 S6 kinase, the phospho-Thr389form of p70 S6 kinase, S6, the phospho-Ser235and -Ser236forms of S6, voltage-dependent anion-selective channel (VDAC) protein and cytochrome c oxidase complex IV (COXIV; all from Cell Signaling, Danvers, MA, USA). Antibodies to SDH (from Abcam, Cambridge, UK) as well as that tob-actin (from Sigma-Aldrich, St. Louis, MO, USA) were also used.
Statistical analysis
Data are presented as means6standard errors of the means. We assessed the significance of differences between independent means by the Student’st-test. APvalue of,0.05 was considered statistically significant.
Results
Insulin secretory response to glucose was enhanced in islets ofbTSC22/2mice
As previously described [12],bTSC22/2 mice show
hypogly-cemia and hyperinsulinemia at young ages. The insulin responses to glucose are also abnormal inbTSC22/2mice, with the plasma insulin levels after glucose challenge markedly higher than those in control mice [12]. In the present study, we further examined glucose-stimulated insulin secretion in isolated islets from control and bTSC22/2 mice at 8 weeks of age. Glucose induced a
concentration-dependent increase in insulin secretion from control islets in static incubations (Fig. 1A). In contrast, the insulin response of islets from bTSC22/2 mice to glucose was
signi-ficantly greater than that of control islets at both low and high glucose concentrations, except at 16.8 mM glucose, which showed no significant difference (Fig. 1A). The islets ofbTSC22/2mice exhibited a normal insulin secretory response to a high concentration of KCl (Fig. 1B), which elicits insulin release by inducing membrane depolarisation and calcium influx. Because
bTSC22/2mice have shown an increase in the individual size of
beta cells, the enhanced insulin secretion may be attributable to increased insulin synthesis. The total insulin content ofbTSC22/2 mice was significantly higher than that of control mice by, 1.5-fold (Fig. 1C). We therefore evaluated the insulin response to glucose normalised to insulin content. After normalisation, the insulin secretory response to glucose inbTSC22/2mice was still
significantly higher than that in control mice (Fig. 1D), suggesting that a factor in addition to enhanced insulin synthesis is involved in
the increased insulin response to glucose in islets ofbTSC22/2
mice.
The insulin secretory response of islets from bTSC22/2 mice
was significantly greater than that of control mice at low glucose concentrations (Fig. 1A and D), suggesting high sensitivity to glucose in pancreatic beta cells.
Number of mitochondria was increased in islets of bTSC22/2 mice
We next examined whether enhanced activity of mTORC1 resulted in an elevation of the ratio of ATP to ADP, which induced closure of the ATP-sensitive K-channels, depolarisation of the beta cell plasma membrane and influx of Ca2+via voltage-dependent
Ca-channels, leading to insulin secretion. ATP production was increased in the islets ofbTSC22/2mice at 8 weeks of age under
physiologic condition (11.2 mM glucose) and low glucose concentration (2.8 mM glucose) (Fig. 2A). We then measured mRNA expression of all 13 genes encoded in the mitochondria, comprising 7 subunits of complex I (NADH dehydrogenase; ND1 to ND6), 1 subunit of complex III (cytochrome c oxidoreductase; cyt b), 3 subunits of complex IV (cytochrome c oxidase; COX1 to COX3) and 2 subunits of complex V (ATP synthase; atp6 and atp8). Mitochondrial DNA expression was significantly greater in islets ofbTSC22/2mice than in control mice (Fig. 2B). Electron
microscopy revealed that while the morphology of mitochondria was not apparently altered in pancreaticbcells of either genotype, the volume density of mitochondria in pancreatic beta cells of
bTSC22/2 mice was significantly increased (about 2.6-fold)
compared with that of control mice at 10 weeks of age (Fig. 2C). These results suggest that the increased number of mitochondria resulted in the augmented ATP production in the pancreatic beta cells ofbTSC22/2mice.
TSC2 knockdown INS-1 cells led to enhancement of insulin secretion
To further confirm the phenotype ofbTSC22/2mice described above, we established TSC2 knockdown INS-1 cells. TSC2 was knocked down with siRNA. TSC2 protein and Tsc2 mRNA expression were significantly reduced by approximately 75% at the protein level and 70% at the mRNA level (Fig. 3A and B). Reduction in TSC2 expression resulted in an increase in the phosphorylation of p70 S6 kinase and S6 ribosomal protein, together with a decrease in the phosphorylation of Akt at Thr308 and Ser473(Fig. 3C). These results indicated that mTORC1 was activated by depletion of TSC2 and that activated mTORC1 downregulated Akt phosphorylation via a negative feedback system, which is consistent with the data obtained from analysis ofbTSC22/2mice [12].
We performed a glucose-stimulated insulin release assay with TSC2 knockdown INS-1 cells. TSC2 knockdown INS-1 cells exhibited a significant increase in insulin secretion at both low (2.8 mM) and high (25 mM) glucose concentrations (Fig. 3D). The insulin secretory response to low glucose concentrations was at a maximum without further augmentation of insulin secretion at higher glucose concentrations. These results indicate that reduction of TSC2 expression induced the activation of mTORC1, leading to enhancement of insulin secretion in vitro as well as in vivo as shown above.
TSC2 knockdown augmented mitochondrial number and function in pancreatic beta cell line cells
expression significantly increased ATP production in INS-1 cells (Fig. 4A). There was a significant difference in ATP production between TSC2-knockdown and control INS-1 cells both at 2.8 and 25 mM. High glucose concentrations did not induce further large increases in glucose-stimulated insulin secretion and ATP production compared with those at low glucose concentrations, possibly because they are greatly augmented even at low glucose concentrations in TSC2-knockdown INS-1 cells. We next examined the effect of TSC2 knockdown on the expression of mitochondrial DNA by real-time RT-PCR. Expression of mRNA by mitochondrial DNA was increased in TSC2 knockdown INS-1 cells, consistent with the results obtained in the islets ofbTSC22/2 mice (Fig. 4B). We also measured the amount of mitochondria with MitoTracker Red, which is a fluorescent dye that stains the mitochondrial membrane. Staining of the mitochondrial mem-brane in TSC2 knockdown INS-1 cells was about 1.7-fold more intense than in control INS-1 cells, suggesting an increase in the
number of mitochondria (Fig. 4C). We also examined the expression of proteins comprising the mitochondrial membrane by immunoblot analysis. VDAC, COXIV and succinate dehy-drogenase complex subunit A are mitochondrial membrane proteins encoded in the nucleus. The expression of these proteins was increased in TSC2 knockdown INS-1 cells (Fig. 4D). These results indicate that reduced expression of TSC2 induced an increase in the number of mitochondria and ATP production in vitro as well as in vivo.
Rapamycin treatment inhibited enhanced mitochondrial function in INS-1 cells
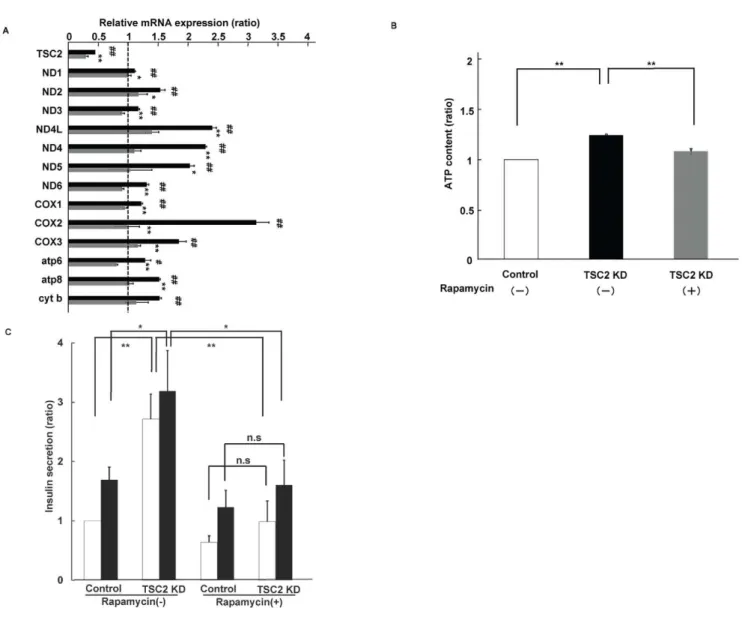
To further determine whether enhanced mTORC1 activity is responsible for the increase in mitochondrial biogenesis, we treated TSC2 knockdown INS-1 cells with rapamycin, an mTORC1 inhibitor. Treatment with 20 nM rapamycin reduced the expression levels of mitochondrial DNA to control levels in
Figure 1. Effect of beta cell–specific ablation of TSC2 on insulin release and insulin content.(AandB) Insulin release in response to the indicated concentrations of glucose (A) or KCl (B) was measured with islets isolated from control (white bars) orbTSC22/2(black bars) mice at the age of 8 weeks. Data were obtained from four independent experiments (n= 4–6). (C) Insulin content of isolated islets at the age of 8 weeks. (D) The amount of insulin secreted from the isolated islets normalised to insulin content. Data were obtained from two to three independent experiments (n= 4–6). All data are shown as means6SE of values from 4 animals of each genotype. *P,0.05, **P,0.01 vs the corresponding value for control mice.
TSC2 knockdown INS-1 cells (Fig. 5A). The amount of ATP produced and the insulin secretory response to glucose were also reduced to the levels in control cells with rapamycin treatment (Fig. 5B and C). These results suggest that enhanced mTORC1 activity might induce an increase in mitochondrial density that increases ATP production and promotes insulin secretion.
Discussion
Insulin-secreting pancreatic beta cells use their insulin receptors to transmit insulin signals into the cells. We previously found that the insulin signalling pathway in pancreatic beta cells is essential for maintenance of pancreatic beta cell mass [6]. It has been shown that constitutive activation of mTORC1 by inhibiting the
function of TSC2 is involved in the control of protein synthesis, cell proliferation, intracellular nourishment and regulation of transcription factors [15,22–25]. We have recently shown that pancreatic beta cell–specific TSC2 knockout (bTSC22/2) mice exhibit increased pancreatic beta cell mass due to constitutive enhancement of mTORC1 activity [12]. In the present study, we found in pancreatic beta cells that mTORC1 hyperactivity, which results from inhibition of TSC2 expression, enhanced insulin secretion by increasing the number of mitochondria.
The 13 types of proteins encoded by mitochondrial DNA are important subunits of the respiratory chain complexes (I, III, IV and V), which produce most of the energy required for cellular activity [26]. Mitochondria are also important to ATP production in pancreatic beta cells, and the pathogenesis of mitochondrial diabetes involves pancreatic beta cell failure resulting from
Figure 2. Effect of beta cell–specific ablation of TSC2 on mitochondrial function in pancreatic beta cells.(A) ATP content of isolated islets of control andbTSC22/2mice at 8 weeks of age. Data are shown as means
6SE from 4 mice per each genotype. Data were obtained from three independent experiments. *P,0.05, **P,0.01 vs the corresponding value for control mice. (B) The abundance of mRNAs for the indicated proteins was determined by real-time RT-PCR analysis of total RNA isolated from islets of control andbTSC22/2mice. The amounts of the mRNAs inbTSC22/2 mice are expressed relative to those in control animals. Data are means6SE of triplicates for pooled total RNA samples from 3 mice of each genotype. Data were obtained from four independent experiments. *P,0.05, **P,0.01 vs the corresponding value (1.0) for control mice. (C) Upper panel: Electron micrograph of beta cells of control andbTSC22/2mice at 10 weeks of age. Scale bar: 1mm. Lower panel: The volume density (%) of mitochondria in pancreatic beta cells obtained from control andbTSC22/2mice at 10 weeks of age.
mitochondrial DNA mutations [27]. This study showed that the pancreatic islets of bTSC22/2 mice exhibited increased mito-chondrial DNA content and an increased number of mitochon-dria, as determined by electron microscopy. This increase in the number of mitochondria is expected to enhance the insulin secretory capacity by increased ATP production. In fact, we found that the phenotype of TSC2 knockdown INS-1 cells was restored by administration of the mTORC1 inhibitor, rapamycin. Thus, these findings indicate that mTORC1 hyperactivity in pancreatic beta cells increased the insulin secretory response to glucose via an increase in the number of mitochondria.
Peroxisome proliferator-activated receptor gamma coactivator 1-alpha (PGC1a) was the first factor discovered in regulation of the biosynthesis of mitochondria [28,29]. PGC1a is a coactivator of the transcription factor nuclear respiratory factor 1 (NRF)-1/2, and NRF-1/2 induces transcription and stabilisation of mitochon-drial DNA by activating transcription factor A, mitochonmitochon-drial (TFAM), which is encoded in the nucleus [28,30–32]. Mice lacking TFAM specifically in pancreatic beta cells have decreased insulin secretory capacity associated with a depletion of mito-chondrial DNA and abnormalities in mitomito-chondrial morphology [33]. They become diabetic at 5 weeks of age, and their beta cell
Figure 3. Establishment of TSC2 knockdown INS-1 cells.(A,BandC) INS-1 cells treated with scramble siRNA (control) and TSC2 siRNA (DTSC2) were lysed and subjected to immunoblot analysis with antibodies against TSC2 (A) or the indicated proteins (C), or subjected to real-time PCR analysis ofTsc2mRNA (B). Data inBare relative expression values for INS-1 cells treated with scramble siRNA (control) and are means6SE from four independent experiments. **P,0.01 (D) Insulin secretion in response to the indicated concentrations of glucose for 30 min was assessed in INS-1 cells and expressed per DNA content. Data were obtained from four independent experiments.
mass is found to decrease with age. AMP-activated protein kinase (AMPK) is known to be involved in insulin secretion and cell survival in pancreatic beta cells [34] and is also another important factor that regulates the biosynthesis of mitochondria [35,36]. Aminoimidazole carboxamide ribonucleotide, which activates AMPK, stimulates the biosynthesis of mitochondria through PGC1aand NRF [37,38].
Previous studies in HEK293 cells have shown that mitochon-drial functions are enhanced by mTOR, which regulates cell growth and proliferation according to the nutritional environment [39]. Recently, it has also been found that rapamycin inhibits the transcription of mitochondrial genes by dissociating PGC1afrom the complex of TORC1 and the transcription factor YY1 [40]. The facts that PGC1afunctions as a coactivator of YY1, that the YY1-PGC1a complex is necessary for the expression of mito-chondrial genes and that the binding of the complex is dependent
on TORC1 activity indicate that mitochondrial function is influenced by the nutritional environment and by growth factors through mTORC1 activity. This study also showed that expression levels of mRNA for mitochondrial DNA were enhanced in INS-1 cells in which TSC2 expression was inhibited by siRNA and were inhibited by administration of rapamycin, suggesting that rapamycin inhibited the transcription of mito-chondrial DNA by dissociating the binding between PGC1aand YY1.
As mentioned above, the expression of mitochondrial genes is known to be controlled by PGC1a, but no change in the expression level of PGC1a was observed in TSC2-knockdown INS-1 cells (data not shown). Morino et al. reported a decrease in mitochondrial density and mitochondrial proteins in the skeletal muscles of patients with type 2 diabetes mellitus, but found no difference between the expression levels of PGC1a, NRF and
Figure 4. Effect of TSC2 knockdown on the function of mitochondria from INS-1 cells.(A) ATP content of control and TSC2. Cellular ATP level was measured at 2.8 mM (white bar) and 25 mM (black bar) glucose (n= 12). The figure shows data from one representative of four independent experiments. (B) The level of mRNA expression of mitochondria DNA-encoded genes obtained by real-time PCR. Data are means6SE of triplicate for pooled total RNA samples from three independent experiments. The amounts of the mRNAs in TSC2 INS-1 cells are expressed relative to those in control cells. (C) Mitochondrial density measured as described in the Material and Methods with MitoTracker Red. Left panel: Mitochondria in control cells and TSC2 INS-1 cells were stained. Right panel: Relative fluorescence was measured by fluorescence-activated cell sorting analysis after MitoTracker Red staining. Data were obtained from three independent experiments. (D) Mitochondrial protein expression assessed by western blotting in INS-1 cells.
TFAM [41]. Recently, it has been reported that the activity of PGC1a requires not only its expression but also modification of processes such as deacetylation and phosphorylation [42]. After being deacetylated by Sirt1 or phosphorylated AMPK, PGC1a
functions as a co-activator of transcription factors [43,44]. As deletion of TSC2 increases AMPK phosphorylation [45,46], we confirmed that the phosphorylation of AMPK was enhanced in the pancreatic islets ofbTSC22/2mice (data not shown). In the
pancreatic islets of bTSC22/2 mice, phosphorylated AMPK
might also increase the number of mitochondria through activation of PGC1a.
YoungbTSC22/2mice have greater pancreatic beta cell mass
and increased secretion of insulin by individual beta cells. We previously reported that in older bTSC22/2 mice, constitutive
hyperactivity of mTORC1 induces a negative feedback mecha-nism and attenuation of insulin signalling that results in decreased
pancreatic beta cell mass and development of diabetes mellitus [12]. In addition to attenuation of insulin signalling, we recently found that excessive insulin secretion induces endoplasmic reticulum (ER) stress [47]. It is possible, therefore, that hyperinsulinemia, which is also found in youngbTSC22/2mice,
may promote ER stress, leading to apoptosis of pancreatic beta cells and resulting in reduced pancreatic beta cell mass in older mice. In addition, it has been reported that constitutively enhanced mTORC1 activity induces ER stress [48]. That study, in which mouse embryonic fibroblasts were used, indicated that the deletion of TSC2 increases the likelihood of ER stress-induced apoptosis when mTORC1 activity is enhanced. Thus, in
bTSC22/2mice, attenuation of insulin signalling mediated by a
negative feedback mechanism and ER stress due to excessive insulin secretion are thought to overlap and contribute to a decrease in pancreatic beta cell mass in older mice.
Figure 5. Effects of rapamycin treatment on mitochondrial function in TSC2 INS-1 cells. (A) Effect of rapamycin treatment on mitochondrial DNA expression. The ratio of TSC2 INS-1 cells untreated (black bar) and treated (grey bar) with 20 nM rapamycin to control cells. Data are means6SE of triplicate pooled total RNA samples from three independent experiments.#P,0.05;##P,0.01 TSC2 cells compared with control (vehicle) cells. *P,0.05; **P,0.01 TSC2 cells treated with rapamycin compared with TSC2 INS-1 cells treated with vehicle. (B) Analysis of rapamycin effect on ATP production. ATP content of control cells (open bar), TSC2 INS-1 cells treated with (grey bar) and without (lack bar) 20 nM rapamycin (n= 12) Figure shows data from one representative of two independent experiments. (C) Insulin secretion in response to 2.8 mM (open bar) and 25 mM (filled bar) glucose for 30 min was assessed in INS-1 cells and expressed per DNA content. Data are shown with and without 20 nM rapamycin (n= 6). Figure shows data from one representative of three independent experiments.
We have shown that constitutive activation of mTORC1 enhances insulin secretion by increasing the number of mitochon-dria. As seen in the phenotype of bTSC22/2 mice, constitutive hyperactivity of mTORC1 resulted in decreased pancreatic beta cell mass. Thus, it is suggested that moderate mTORC1 activity is required to preserve the pancreatic beta cell mass and maintain the insulin secretory capacity of pancreatic beta cells. As mentioned above, mTORC1 activity is thought to be involved in the pathogenesis of type 2 diabetes mellitus through regulation of the cellular functions of pancreatic beta cells by control of the number of mitochondria. Further studies of the mechanism of regulation of mitochondrial functions in pancreatic beta cells are required for the prevention and treatment of type 2 diabetes mellitus.
Supporting Information
Table S1 Primers used for real-time RT-PCR analysis.
(DOC)
Acknowledgments
We thank M. Nagano, M. Oya and A. Tanida for technical assistance. This manuscript was written by Y. Kido.
Author Contributions
Conceived and designed the experiments: M. Koyanagi S-IA T. Matsuda NH HI TN SS M. Kasuga YK. Performed the experiments: M. Koyanagi Y. Shigeyama Y. Shibutani AK MF T. Mikami M. Koike. Analyzed the data: M. Koyanagi S-IA T. Matsuda T. Mikami TH HI MM YU SS M. Kasuga YK. Contributed reagents/materials/analysis tools: M. Koyanagi Y. Shibutani YK M. Kasuga. Wrote the paper: M. Koyanagi SS YK.
References
1. Leahy JL (1990) Natural history of beta-cell dysfunction in NIDDM. Diabetes Care 13: 992–1010.
2. Weyer C, Bogardus C, Mott DM, Pratley RE (1999) The natural history of insulin secretory dysfunction and insulin resistance in the pathogenesis of type 2 diabetes mellitus. J Clin Invest 104: 787–794.
3. Rhodes CJ (2005) Type 2 diabetes-a matter of beta-cell life and death? Science 307: 380–384.
4. Kasuga M (2006) Insulin resistance and pancreatic beta cell failure. J Clin Invest 116: 1756–1760.
5. Maechler P, Wollheim CB (2001) Mitochondrial function in normal and diabetic beta-cells. Nature 414: 807–812.
6. Hashimoto N, Kido Y, Uchida T, Asahara S, Shigeyama Y, et al. (2006) Ablation of PDK1 in pancreatic beta cells induces diabetes as a result of loss of beta cell mass. Nat Genet 38: 589–593.
7. Ueki K, Okada T, Hu J, Wee Liew C, Assmann A, et al. (2006) Total insulin and IGF-I resistance in pancreatic beta cells causes overt diabetes. Nat Genet 38: 583–588.
8. Wollheim CB, Maechler P (2002) Beta-cell mitochondria and insulin secretion: messenger role of nucleotides and metabolites. Diabetes 51 Suppl 1: S37–42. 9. Soejima A, Inoue K, Takai D, Kaneko M, Ishihara H, et al. (1996)
Mitochondrial DNA is required for regulation of glucose-stimulated insulin secretion in a mouse pancreatic beta cell line, MIN6. J Biol Chem 271: 26194–26199.
10. Anello M, Lupi R, Spampinato D, Piro S, Masini M, et al. (2005) Functional and morphological alterations of mitochondria in pancreatic beta cells from type 2 diabetic patients. Diabetologia 48: 282–289.
11. Lu H, Koshkin V, Allister EM, Gyulkhandanyan AV, Wheeler MB (2010) Molecular and metabolic evidence for mitochondrial defects associated with beta-cell dysfunction in a mouse model of type 2 diabetes. Diabetes 59: 448–459. 12. Shigeyama Y, Kobayashi T, Kido Y, Hashimoto N, Asahara S, et al. (2008) Biphasic response of pancreatic beta-cell mass to ablation of tuberous sclerosis complex 2 in mice. Mol Cell Biol 28: 2971–2979.
13. van Slegtenhorst M, de Hoogt R, Hermans C, Nellist M, Janssen B, et al. (1997) Identification of the tuberous sclerosis gene TSC1 on chromosome 9q34. Science 277: 805–808.
14. The European Chromosome 16 Tuberous Sclerosis Consortium (1993) Identification and characterization of the tuberous sclerosis gene on chromo-some 16. Cell 75: 1305–1315.
15. Inoki K, Li Y, Zhu T, Wu J, Guan KL (2002) TSC2 is phosphorylated and inhibited by Akt and suppresses mTOR signalling. Nat Cell Biol 4: 648–657. 16. Herrera PL (2000) Adult insulin- and glucagon-producing cells differentiate from
two independent cell lineages. Development 127: 2317–2322.
17. Kido Y, Burks DJ, Withers D, Bruning JC, Kahn CR, et al. (2000) Tissue-specific insulin resistance in mice with mutations in the insulin receptor, IRS-1, and IRS-2. J Clin Invest 105: 199–205.
18. Hashimoto N, Kido Y, Uchida T, Matsuda T, Suzuki K, et al. (2005) PKClambda regulates glucose-induced insulin secretion through modulation of gene expression in pancreatic beta cells. J Clin Invest 115: 138–145. 19. Kitamura T, Kido Y, Nef S, Merenmies J, Parada LF, et al. (2001) Preserved
pancreatic beta-cell development and function in mice lacking the insulin receptor-related receptor. Mol Cell Biol 21: 5624–5630.
20. Matsumoto M, Ogawa W, Akimoto K, Inoue H, Miyake K, et al. (2003) PKClambda in liver mediates insulin-induced SREBP-1c expression and determines both hepatic lipid content and overall insulin sensitivity. J Clin Invest 112: 935–944.
21. Koike M, Shibata M, Waguri S, Yoshimura K, Tanida I, et al. (2005) Participation of autophagy in storage of lysosomes in neurons from mouse models of neuronal ceroid-lipofuscinoses (Batten disease). Am J Pathol 167: 1713–1728.
22. Kobayashi T, Minowa O, Kuno J, Mitani H, Hino O, et al. (1999) Renal carcinogenesis, hepatic hemangiomatosis, and embryonic lethality caused by a germ-line Tsc2 mutation in mice. Cancer Res 59: 1206–1211.
23. Hino O (2003) Hereditary renal carcinogenesis fitting Knudson’s two-hit model: genotype, environment, and phenotype. Genes Chromosomes Cancer 38: 357–367.
24. Inoki K, Zhu T, Guan KL (2003) TSC2 mediates cellular energy response to control cell growth and survival. Cell 115: 577–590.
25. Harrington LS, Findlay GM, Gray A, Tolkacheva T, Wigfield S, et al. (2004) The TSC1-2 tumor suppressor controls insulin-PI3K signaling via regulation of IRS proteins. J Cell Biol 166: 213–223.
26. Wallace DC (1999) Mitochondrial diseases in man and mouse. Science 283: 1482–1488.
27. Velho G, Byrne MM, Clement K, Sturis J, Pueyo ME, et al. (1996) Clinical phenotypes, insulin secretion, and insulin sensitivity in kindreds with maternally inherited diabetes and deafness due to mitochondrial tRNALeu(UUR) gene mutation. Diabetes 45: 478–487.
28. Wu Z, Puigserver P, Andersson U, Zhang C, Adelmant G, et al. (1999) Mechanisms controlling mitochondrial biogenesis and respiration through the thermogenic coactivator PGC-1. Cell 98: 115–124.
29. Puigserver P, Wu Z, Park CW, Graves R, Wright M, et al. (1998) A cold-inducible coactivator of nuclear receptors linked to adaptive thermogenesis. Cell 92: 829–839.
30. Falkenberg M, Larsson NG, Gustafsson CM (2007) DNA replication and transcription in mammalian mitochondria. Annu Rev Biochem 76: 679–699. 31. Scarpulla RC (2008) Transcriptional paradigms in mammalian mitochondrial
biogenesis and function. Physiol Rev 88: 611–638.
32. Duncan JG, Fong JL, Medeiros DM, Finck BN, Kelly DP (2007) Insulin-resistant heart exhibits a mitochondrial biogenic response driven by the peroxisome proliferator-activated receptor-alpha/PGC-1alpha gene regulatory pathway. Circulation 115: 909–917.
33. Silva JP, Kohler M, Graff C, Oldfors A, Magnuson MA, et al. (2000) Impaired insulin secretion and beta-cell loss in tissue-specific knockout mice with mitochondrial diabetes. Nat Genet 26: 336–340.
34. Rutter GA, Leclerc I (2009) The AMP-regulated kinase family: enigmatic targets for diabetes therapy. Mol Cell Endocrinol 297: 41–49.
35. Reznick RM, Shulman GI (2006) The role of AMP-activated protein kinase in mitochondrial biogenesis. J Physiol 574: 33–39.
36. Kahn BB, Alquier T, Carling D, Hardie DG (2005) AMP-activated protein kinase: ancient energy gauge provides clues to modern understanding of metabolism. Cell Metab 1: 15–25.
37. Bergeron R, Ren JM, Cadman KS, Moore IK, Perret P, et al. (2001) Chronic activation of AMP kinase results in NRF-1 activation and mitochondrial biogenesis. Am J Physiol Endocrinol Metab 281: E1340–1346.
38. Winder WW, Holmes BF, Rubink DS, Jensen EB, Chen M, et al. (2000) Activation of AMP-activated protein kinase increases mitochondrial enzymes in skeletal muscle. J Appl Physiol 88: 2219–2226.
39. Schieke SM, Finkel T (2006) Mitochondrial signaling, TOR, and life span. Biol Chem 387: 1357–1361.
40. Cunningham JT, Rodgers JT, Arlow DH, Vazquez F, Mootha VK, et al. (2007) mTOR controls mitochondrial oxidative function through a YY1-PGC-1alpha transcriptional complex. Nature 450: 736–740.
41. Morino K, Petersen KF, Dufour S, Befroy D, Frattini J, et al. (2005) Reduced mitochondrial density and increased IRS-1 serine phosphorylation in muscle of insulin-resistant offspring of type 2 diabetic parents. J Clin Invest 115: 3587–3593.
43. Rodgers JT, Lerin C, Haas W, Gygi SP, Spiegelman BM, et al. (2005) Nutrient control of glucose homeostasis through a complex of PGC-1alpha and SIRT1. Nature 434: 113–118.
44. Jager S, Handschin C, St-Pierre J, Spiegelman BM (2007) AMP-activated protein kinase (AMPK) action in skeletal muscle via direct phosphorylation of PGC-1alpha. Proc Natl Acad Sci U S A 104: 12017–12022.
45. Feng Z, Hu W, de Stanchina E, Teresky AK, Jin S, et al. (2007) The regulation of AMPK beta1, TSC2, and PTEN expression by p53: stress, cell and tissue specificity, and the role of these gene products in modulating the IGF-1-AKT-mTOR pathways. Cancer Res 67: 3043–3053.
46. Hahn-Windgassen A, Nogueira V, Chen CC, Skeen JE, Sonenberg N, et al. (2005) Akt activates the mammalian target of rapamycin by regulating cellular ATP level and AMPK activity. J Biol Chem 280: 32081–32089.
47. Asahara S, Matsuda T, Kido Y, Kasuga M (2009) Increased ribosomal biogenesis induces pancreatic beta cell failure in mice model of type 2 diabetes. Biochem Biophys Res Commun 381: 367–371.