BGD
2, 933–975, 2005Comparison of deposition fluxes
Westling et al.
Title Page Abstract Introduction Conclusions References
Tables Figures
◭ ◮
◭ ◮
Back Close
Full Screen / Esc
Print Version
Interactive Discussion
EGU
Biogeosciences Discussions, 2, 933–975, 2005 www.biogeosciences.net/bgd/2/933/
SRef-ID: 1810-6285/bgd/2005-2-933 European Geosciences Union
Biogeosciences Discussions
Biogeosciences Discussionsis the access reviewed discussion forum ofBiogeosciences
Comparison of modelled and monitored
deposition fluxes of sulphur and nitrogen
to ICP-forest sites in Europe
O. Westling1, H. Fagerli2, S. Hellsten1, J. C. Knulst1, and D. Simpson2,3
1
IVL Swedish Environmental Research Institute, P.O. Box 5302, Gothenburg, Sweden 2
EMEP MSC-W, Norwegian Meteorological Institute, Oslo, Norway 3
Dept. Radio & Space Science, Chalmers Technical University, Gothenburg, Sweden Received: 9 May 2005 – Accepted: 5 July 2005 – Published: 9 August 2005
Correspondence to: O. Westling (olle.westling@ivl.se)
BGD
2, 933–975, 2005Comparison of deposition fluxes
Westling et al.
Title Page Abstract Introduction Conclusions References
Tables Figures
◭ ◮
◭ ◮
Back Close
Full Screen / Esc
Print Version
Interactive Discussion
EGU Abstract
The EMEP MSC-W Eulerian chemical transport model, and its predictions of deposition of acidifying and eutrophying pollutants over Europe, play a key role in the development of emission control strategies for the UNECE and EU. It is important that this model is tested against observational data. Such model evaluation is usually conducted using
5
observations from the EMEP monitoring network, which includes around 70 sites with wet deposition measurements in a variety of landscapes. Here we compare the results of the EMEP model with a completely independent data-set, that of the EU/ICP Forest (Level II) monitoring network. Modelled data from 1997 and 2000 were compared with observed deposition data from 160 ICP-Forest plots.
10
In general, similarities between modelled and observed deposition in this study were
reasonably good (r2 values between 0.5–0.8 for most components and years, with
mean values across all sites being within 30%), despite the uncertainty in comparing measured plot data with modelled grid data. EMEP tends to give somewhat lower
val-ues for the average, median and percentile SO2−
4 , NO −
3 and NH
+
4 wet deposition in the
15
whole deposition gradient compared to ICP, but differences in mean values were within
20% in 1997 and 30% in 2000. Modelled and observed concentrations of SO2−
4 , NO − 3
and NH+4 in precipitation are very similar as average (differences of 0–14%), median
and percentiles, and the correlation between modelled and observed data is rather
high (r2=0.50–0.78). Many of the sites showing large discrepancies between EMEP
20
and ICP data were found to have unusually high inter-annual variability in the
precip-itation amounts registered by ICP, suggesting that some differences may be due to
sampling procedures or complex topographic effects. A simple precipitation
variabil-ity index (PVI) was devised to flag sites with large variabilvariabil-ity, and many outliers in the chemical comparison were shown to be such sites. The largest discrepancies were
25
seen between EMEP and ICP precipitation amounts and for this component the
corre-lation was very poor (r2=0.04–0.23 with all data, and 0.23–0.27 with PVI-filtered data).
conclu-BGD
2, 933–975, 2005Comparison of deposition fluxes
Westling et al.
Title Page Abstract Introduction Conclusions References
Tables Figures
◭ ◮
◭ ◮
Back Close
Full Screen / Esc
Print Version
Interactive Discussion
EGU
sion is that the EMEP model performs rather well in reproducing patterns of S and N deposition to European forests.
1. Introduction
A major aim of EMEP (Cooperative Programme on the Long Range Transmission of
Air Pollutants in Europe,http://www.emep.int) is to support governments with scientific
5
guidance on the causes of air pollution concentrations and depositions within Europe. EMEP model results are an essential input to the RAINS integrated assessment model (Sch ¨opp et al.,1999;Amann et al.,1999), and have been crucial to a number of United Nations Economic Commission for Europe (UNECE) Protocols and the recent Euro-pean Union National Emissions Ceilings Directive. The modelling tool currently in use
10
at the Meteorological Synthesizing Centre West (MSC-W) of EMEP is a Eulerian model which calculates concentration and depositions associated with acidification and
eu-trophication, as well as ozone (Simpson et al., 2003a). An essential part of the use
of such a model has always been thorough evaluation against measurements, in or-der to give confidence in its basic scientific formulation and use for policy research.
15
Typically, these evaluations have consisted of comparisons of modelled concentrations and deposition against measurements available though the EMEP Chemical Coordi-nating Centre (EMEP-CCC), which provides a network of 170 sites throughout Europe (Hjellbrekke,2004). Seventy of these sites report wet deposition measurements.
The aims of the present work are twofold: (a) to compare the results of the EMEP
20
model with a completely independent data-set, and (b) to compare EMEP simulations of deposition to forests with monitored deposition data from plots which were represen-tative for forests in particular.
The data-sets used stem from the International Co-operative Programme on
As-sessment and Monitoring of Air Pollution Effects on Forests (ICP Forests,http://www.
25
BGD
2, 933–975, 2005Comparison of deposition fluxes
Westling et al.
Title Page Abstract Introduction Conclusions References
Tables Figures
◭ ◮
◭ ◮
Back Close
Full Screen / Esc
Print Version
Interactive Discussion
EGU
II monitoring system of forest sites, which has been in operation since 1994. The Forest Intensive Monitoring Co-ordinating Institute (FIMCI) was set up as a contractor
of the European Commission (EC), to evaluate and validate these data (UNECE/EC,
2000). The monitoring data was collected from the EU/ICP-F Pan European
Inten-sive (Level II) Monitoring Program via FIMCI (De Vries et al.,2001;ICP-Forest, 1998).
5
The integrated monitoring of forest plots throughout Europe includes deposition mon-itoring, comprising throughfall, stemflow, bulk and wet only precipitation in open field sites (located close to the forest). This study includes comparisons of modelled and monitored data on an annual basis, as well as with seasonal resolution (monthly). This work was conducted as a cooperation between the the Swedish ASTA program
10
(http://asta.ivl.se) and EMEP, and as part of the EU-funded NOFRETETE project (http:
//imk-ifu.fzk.de/nofretete/index.html).
The need for extensive model evaluation is strengthened by the complex nature of at-mospheric deposition. An enormous number of complex and often poorly-understood processes, both physical and chemical, are involved in controlling the deposition of
15
gases and particles from the atmosphere to vegetation (Fowler and Erisman, 2003;
Erisman et al.,2005;Wesely and Hicks,2000). Experimental evidence for processes
such as possible compensation-points for NO or NH3(Duyzer and Fowler,1994;Dorsey
et al.,2004;Sutton et al.,1994), and co-deposition effects (Fowler et al.,2001) exists,
but too few experiments are available to enable a reliable model approach.
20
Of course, comparisons of modelled versus observed concentrations have been
pub-lished previously. Schaap et al. (2004) for example compared inorganic aerosol fields
over Europe and found good agreement for mean levels (within 10–20%), and
correla-tion coefficients of aroundr2∼0.27–0.38. Mathur and Dennis(2003) considered model
performance for sulphate, nitrate and ammonium concentrations and depositions over
25
the Eastern United States using a modified version of the RADM model (Chang et al.,
1987). Model results for SO2−
4 and NO
−
3 were found to be moderate to good (r
2
=0.4–
0.7), but much worse for NH+4. This work suggested severe problems with the NH3
BGD
2, 933–975, 2005Comparison of deposition fluxes
Westling et al.
Title Page Abstract Introduction Conclusions References
Tables Figures
◭ ◮
◭ ◮
Back Close
Full Screen / Esc
Print Version
Interactive Discussion
EGU
for the globe, including some comparisons for EMEP measurement sites, obtaining
good performance for SO2−
4 , with geometric means within 4% for the EMEP stations,
degrading to within 63% for NH+4. In general, modelling of wet depositions is more
dif-ficult than for air concentrations. Model performance for wet deposition fluxes or con-centrations cannot be better than the performance for meteorological data. Moreover,
5
correct treatment of scavenging needs extensive access of meteorological parameters which are seldom available from standard meteorological drivers. Poor agreement be-tween modelled and observed wet deposition fluxes has been seen both in a regional
model intercomparison (van Loon et al.,2004) and for the global models in the COSAM
model intercomparison (Roelofs et al.,2001).
10
Differences in model formulation, available emission inventories, and also in
chemi-cal climate between Europe and other parts of the World preclude the direct application of conclusions drawn from these studies to the EMEP model or to the situation over Europe. However, these results indicate strongly the uncertainties surrounding the modelling of the inorganic, and especially nitrogen-containing, components of the
at-15
mospheric aerosol. Further, since the EMEP model has special importance for the estimation of impacts of acidifying and eutrophying pollutants to European ecosys-tems, evaluation of this model’s predicted deposition fields against measurements is an important component of building confidence in its use for both research studies and policy-oriented tasks.
20
2. Measurements
Total deposition (wet and dry) to forests can be estimated by measuring throughfall, in-cluding stemflow. The possibility to quantify the total deposition is limited to ions which do not take part in the uptake and leaching processes in the canopy, e.g. sulphate,
sodium and possibly also chloride (Hultberg and Grennfelt,1992;Erisman and
Draai-25
jers,1995). If wet deposition (in the ICP network measured as bulk deposition in open
BGD
2, 933–975, 2005Comparison of deposition fluxes
Westling et al.
Title Page Abstract Introduction Conclusions References
Tables Figures
◭ ◮
◭ ◮
Back Close
Full Screen / Esc
Print Version
Interactive Discussion
EGU
be used to estimate the dry deposition part to forests. Net throughfall includes not only the dry part, but also the possible contribution from fog and cloud water deposition.
Nitrogen in the form of both ammonium and nitrate, together with most other plant
nutrients, is strongly affected by canopy exchange, especially in areas with low to
mod-erate deposition of N. Different canopy exchange models have been proposed to
sep-5
arate between internal circulation and atmospheric deposition (Draaijers et al.,1996),
but the uncertainties are relatively large (Erisman et al.,2005). For that reason
mod-elled total deposition from throughfall data is not used in this study for comparison with EMEP modelled deposition of N to forests. Only measured bulk deposition of N in open field is compared with model calculated wet deposition by EMEP.
10
Quality-assured monitoring data during the period 1997 through 2000 was delivered
by FIMCI, after approval from ICP Forest (De Vries et al., 2001; ICP-Forest, 1998).
Data comprised bulk precipitation in open fields, throughfall in coniferous and decidu-ous forest plots and stemflow in some decidudecidu-ous plots. As part of the FIMCI quality control, obviously contaminated or unrealistic values had been removed from the data
15
set. Sites with data covering less than 315 days during a year were excluded from the study during that year.
However, some missing values (ca. 3% of the data) existed, which were filled-in by inserting the monthly mean value for that parameter, site and year to enable calcula-tions of annual deposition. Following the above procedures, data from seven European
20
countries (Sweden, France, Norway, Finland, Germany, Ireland, and Italy) representing various deposition levels, and with quality monitored deposition data were included in this study. This study includes 160 ICP sites in seven countries distributed over 140
EMEP grids (Fig.1).
The ICP deposition to deciduous forests is uncertain due to the limited data on
stem-25
BGD
2, 933–975, 2005Comparison of deposition fluxes
Westling et al.
Title Page Abstract Introduction Conclusions References
Tables Figures
◭ ◮
◭ ◮
Back Close
Full Screen / Esc
Print Version
Interactive Discussion
EGU
sources are located closer to the forest sites in Germany than in Sweden.
Inconsistent sampling periods complicate this comparison to some extent. ICP For-est data was collected at monthly intervals in Sweden and Finland, weekly in Ireland and parts of Germany, and on an irregular basis in Italy, Norway and some German counties. France collected data at 27 or 28 day intervals throughout the year (13
peri-5
ods). Weekly or bi-weekly collections were transformed into monthly data if the break between resulting records fell within 4 days from the calendar months end. In accor-dance with ICP Forest guidelines, stemflow is only measured at level II sites with beech stands. However, data was not available for all the beech stands for which through-fall was provided. The available data of good quality was used to calculate a stemflow loss
10
index to be used in estimating the total deposition to the forest floor as given by the EMEP model.
An important uncertainty in this comparison is associated with the precipitation
sam-pling. A field inter-comparison of different bulk collectors used in the ICP network has
found it difficult to estimate precipitation volumes accurately (Draaijers et al., 2001).
15
The deviation for precipitation volumes compared to the best estimate ranged from
+103% to −27%. Deviations are caused by several factors, such as aerodynamic
properties and collecting area of the collector. It be noted that even when monitored
by high-equality rain-gauges by official Meteorological Institutes, rainfall estimation is
difficult. Smith and Fowler(2001) suggested that rainfall amounts for 5×5 km2 in the
20
UK could be uncertain by between 30%–50%.
Examination of the precipitation amounts reported for the ICP network shows some
large differences between data for 1997 and 2000. The most extreme case involved
precipitation of just 419 mm in 1997 but over 1200 mm in the year 2000. It is hard to judge how far such features can be ascribed to meteorological variability or to
mea-25
surement artefacts (e.g. loss of precipitation in windy conditions,Nespor and Sevruk,
BGD
2, 933–975, 2005Comparison of deposition fluxes
Westling et al.
Title Page Abstract Introduction Conclusions References
Tables Figures
◭ ◮
◭ ◮
Back Close
Full Screen / Esc
Print Version
Interactive Discussion
EGU
variability index, PVI, has been defined as percentage:
PVI=100×
2.(P1997−P2000)
(P1997+P2000)
(1)
whereP represents the annual precipitation. Almost half the sites have a PVI of less
than 10%, whereas 18% show PVI values of greater than 20%. Although all data-points have been used in all statistics in this paper, points with PVI values greater than 20%
5
are indicated (circled) in scatter plots.
Finally, it should also be noted that although the ICP-Forest network forms an
exten-sive and very useful data-set, there are limitations to the accuracy with which different
components can be estimated. In an inter-comparison exercise of ICP samplers,
Eris-man et al. (2003) found that 65%, 50% and 45% of estimates for bulk precipitation of
10
SO2− 4 , NO
−
3 and NH
+
4 respectively, were more than 20% different from the best
esti-mates. Further examples are discussed inErisman et al.(2005).
3. The Eulerian EMEP model
For this study, regional concentrations of sulphur and nitrogen compounds have been calculated with the so-called OZONE version of the EMEP Unified Eulerian model,
15
revision rv2 0. This model is fully documented inSimpson et al.(2003a) and Fagerli
et al. (2004).
Briefly, the Eulerian EMEP model is a multi-layer atmospheric dispersion model for simulating the long-range transport of air pollution over several years. The model has
20 vertical layers in σ-coordinates and is primarily intended for use with a horizontal
20
resolution of ca. 50×50 km2 (at 60◦ N) in the EMEP polar stereographic grid. The
chemical scheme uses about 140 reactions between 70 species, and makes use of the
EQSAM module ofMetzger et al.(2002a,b) to describe equilibria between the inorganic
BGD
2, 933–975, 2005Comparison of deposition fluxes
Westling et al.
Title Page Abstract Introduction Conclusions References
Tables Figures
◭ ◮
◭ ◮
Back Close
Full Screen / Esc
Print Version
Interactive Discussion
EGU
All versions of the model use meteorological data from PARLAM (Benedictow,2002),
a dedicated version of the operational HIRLAM model (High Resolution Limited Area Model) maintained and verified at MET.NO. The anthropogenic emission input data used by the all model versions are generally based as far as possible upon emissions
reported per sector and grid officially reported to the Convention on Long-Range
Trans-5
boundary Air Pollution (e.g.Vestreng et al.,2004).
The dry deposition module makes use of a stomatal conductance algorithm which was originally developed for calculation of ozone fluxes, but which is now applied to all
pollutants where stomatal control is important (Emberson et al.,2000a,b,c; Simpson
et al.,2001,2003b;Tuovinen et al.,2001,2004). The deposition of SO2and NH3builds
10
upon relationships presented inSmith et al.(2000) andNemitz et al. (2001) involving
temperature, humidity and the ratio SO2/NH3, in an attempt to allow for so-called
co-deposition and surface acidity (Fowler and Erisman,2003;Simpson et al.,2003a).
The model also allows for calculations to different types of land-cover within each
grid. Dry deposition fluxes are calculated to a number of land-cover classes within each
15
grid square, including two different classes of coniferous forest and two of deciduous
forests. The resistance terms and deposition velocities are calculated independently over each land-cover, based upon vegetation characteristics such as height, leaf-area
index, and phenology (Emberson et al., 2000b; Simpson et al., 2001). The greater
height and associated roughness of forests leads to substantially greater deposition
20
rates than are modelled over say grasslands or water surfaces.
Dry deposition of aerosol particles depends on their size, with the model version used here distinguishing between fine and coarse aerosols. Details of the formulation
are given inSimpson et al.(2003a). Parameterisation of the wet deposition processes
in the EMEP model includes both in-cloud and sub-cloud scavenging of gases and
25
particles
BGD
2, 933–975, 2005Comparison of deposition fluxes
Westling et al.
Title Page Abstract Introduction Conclusions References
Tables Figures
◭ ◮
◭ ◮
Back Close
Full Screen / Esc
Print Version
Interactive Discussion
EGU 4. Results and discussion
The monitored plots with coniferous and deciduous forests were matched with the
cor-responding EMEP grid (50×50 km2). Deposition data for SO24− were compared for wet
and total deposition separately. For NH+4 and NO−
3 only observations of wet deposition
data could be used in the comparison for reasons discussed above.
5
Units used are given as kg (S or N) per hectare and year, as typically used in the
deposition literature in Europe (1 kg ha−1yr−1
=0.1 g m−2yr−1).
This study compares two completely different methods used to estimate deposition
to forest locations: (a) measured data from a spot, normally a forest plot of around
30×30 m2, with varying exposure, tree species, leaf area index, etc.; and (b) model
cal-10
culated average deposition to the same forest type in a corresponding grid 50×50 km2.
It should be kept in mind that both methods have uncertainties and no true values are available. Of course, scatter is to be expected when paring single sites with grid
data, but systematic differences between measurements at several monitored sites
and model calculated values give valuable information on the causes and dimension
15
of uncertainty. The comparison of modelled and observed data from 1997 and 2000 comprises:
1. precipitation amount,
2. total deposition of SO2−
4 to coniferous and deciduous forests,
3. wet deposition of SO2−
4 , NO −
3 and NH
+
4 in open field,
20
4. concentrations of SO2−
4 , NO −
3 and NH
+
4 in precipitation.
Total deposition from the ICP sites is represented by throughfall monitoring, repre-senting both wet and dry deposition to forests, and wet deposition by bulk precipitation in open field. The results are compared to calculated wet and dry deposition from the EMEP grid model.
BGD
2, 933–975, 2005Comparison of deposition fluxes
Westling et al.
Title Page Abstract Introduction Conclusions References
Tables Figures
◭ ◮
◭ ◮
Back Close
Full Screen / Esc
Print Version
Interactive Discussion
EGU
Results are shown as scatter plots and in tables of percentiles. Additionally Table1
summarises the statistical parameters (intercept, slope and r2 values) obtained with
linear regression.
4.1. Precipitation
The precipitation amount at the ICP sites is normally measured in the same collectors
5
that sample precipitation for chemical analysis and the methods are standardised in the
ICP Forest manual. However, precipitation is notoriously difficult to measure accurately,
and as noted in section 2, significant problems are known to affect ICP precipitation
samples. Using the PVI index defined by Eq. (1) as an indicator of some of these
problems, almost half the sites have a PVI of less than 10%, whereas 18% show PVI
10
values of greater than 20%.
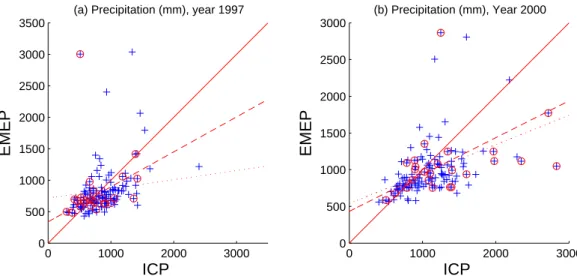
The comparison between precipitation used in the EMEP calculations and observed
data at the ICP sites show large scatter (Fig.2, Tables 1–2) with notably lower
pre-cipitation in EMEP grids expressed as average, median and percentiles, except for
the areas with the lowest precipitation, the 20 percentile. The correlation coefficients
15
(Table 1) are very low, although PVI-filtering makes a substantial difference to these
values.
This can to some extent be explained by the coarse resolution of the model. The
precipitation field pattern is very patchy (e.g. influenced by local topographic effects),
and the regional scale model is unable to resolve this sub grid scale distribution. A
20
typical problem arises with small scale showers. In reality precipitation is high in a small area of a given grid, but a large fraction of the grid should remain dry. Within the model, however, this precipitation is averaged out to cover the whole grid at a lower intensity. Thus, even though average precipitation amounts may be simulated well, the model predicts precipitation more often, but in lower amounts, than occur in reality. It can be
25
noted, however, that the correlation between EMEP-model precipitation and measured
precipitation wasr2=0.54 andr2=0.42 for 1997 and 2000, respectively. This strongly
BGD
2, 933–975, 2005Comparison of deposition fluxes
Westling et al.
Title Page Abstract Introduction Conclusions References
Tables Figures
◭ ◮
◭ ◮
Back Close
Full Screen / Esc
Print Version
Interactive Discussion
EGU
methods.
4.2. Sulphur
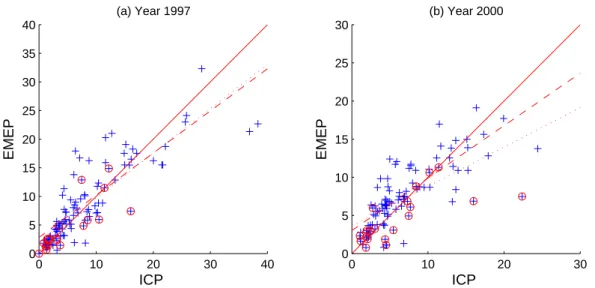
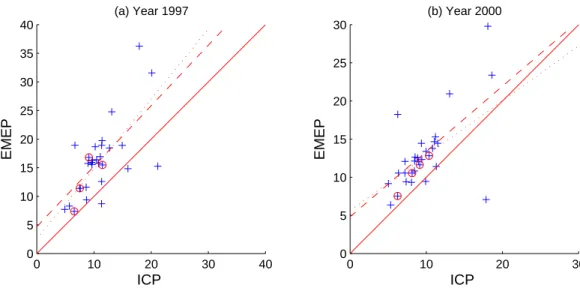
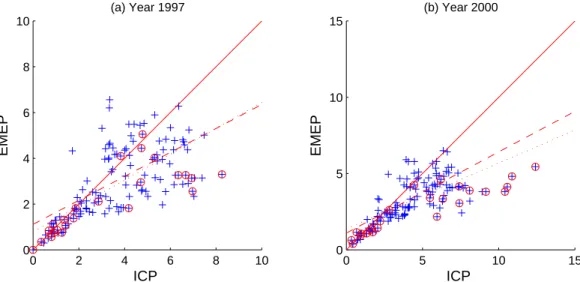
Figure 3 compares the modelled (EMEP) and observed (ICP) deposition of SO2−
4 in
coniferous forests for 1997 and 2000. The correlation is rather good during 1997 and 2000, especially if a few ICP sites with extremely high reported deposition values, or
5
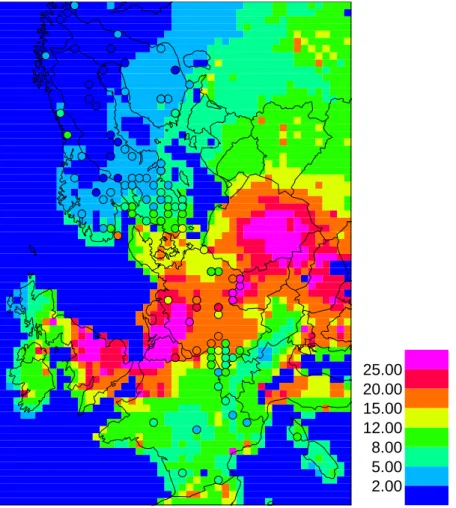
with PVI>20%, are excluded (Fig. 3includes all points). This can also be seen from
Fig. 4 where the modelled field of total sulphur deposition in 1997 has been plotted
together with ICP data. This figure clearly shows a high degree of correlation between the EMEP and ICP estimates of total S deposition, with spatial gradients captured very well and no systematic errors across the sites.
10
Table3quantifies some statistics for this comparison. The results for 1997 are very
good, with both mean and medium deposition values having errors of around 5%. For 2000 the error in the mean was low (4%), but much higher for the median (37%), with the EMEP model giving higher depositions in this case. This overestimate is un-expected, because the EMEP calculation represents an average forest with all age
15
classes of trees. The ICP sites are normally located in mature forest stands, which generally reveal higher dry deposition than the most common forest stand.
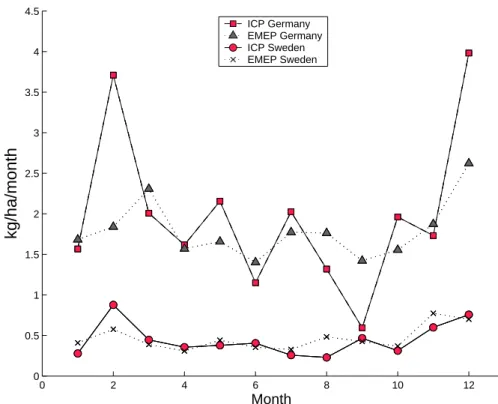
The monthly resolution of modelled and observed SO2−
4 deposition was studied for
1997 with ICP sites in Germany (a high deposition area) and Sweden (moderate
de-position), for which monthly deposition data was available (Fig.5). The results for the
20
Swedish sites are reasonable throughout the year. However, for Germany the EMEP results are significantly lower than ICP in February and December but significantly
higher in September. It is unclear why the seasonal patterns should be so different for
Germany, but one difference arises from the fact that the emission sources are located
closer to the forest sites in Germany than in Sweden (forest composition is the same,
25
BGD
2, 933–975, 2005Comparison of deposition fluxes
Westling et al.
Title Page Abstract Introduction Conclusions References
Tables Figures
◭ ◮
◭ ◮
Back Close
Full Screen / Esc
Print Version
Interactive Discussion
EGU
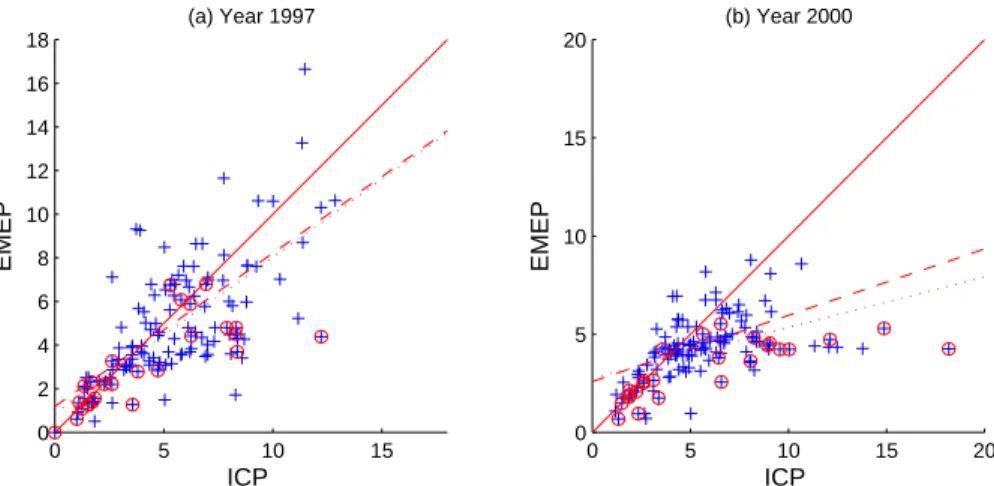
The modelled and observed total deposition of SO2−
4 in deciduous forests, shown in
Fig.6, show similar correlation as coniferous forests. As noted in section2above, the
ICP deposition to deciduous forests is uncertain and correction factors were applied.
With these corrections of the throughfall data, EMEP overestimated the SO2−
4 wet
position slightly in most cases. The comparison between modelled and observed
de-5
position of SO2−
4 in precipitation (Fig. 7) is more scattered compared to deposition
in forests. EMEP is slightly underestimating the deposition as average, median and
all percentiles, both 1997 and 2000 (Table 4), in comparison to observed data. The
observed deposition in open field, collected with bulk samplers, could normally be ex-pected to be 5 to 15% higher than wet only deposition, due to dry deposition in the
10
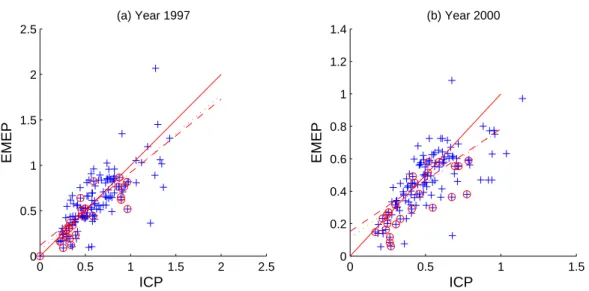
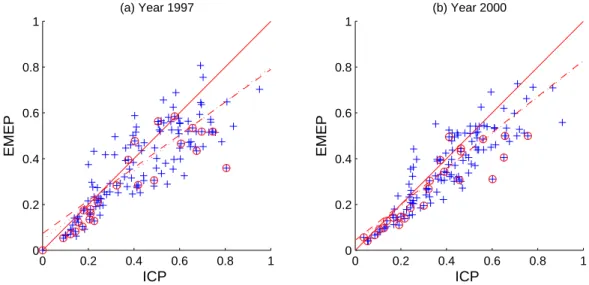
open samplers in open field. However, the main reason for the higher deposition in observed data is higher measured precipitation amount at the ICP sites, in comparison to the values used in the EMEP calculations in the corresponding grids. The correlation
of modelled and observed concentration of SO2−
4 in precipitation (Fig.8) is higher and
average, median and percentiles are very close (see Table4), in comparison to
depo-15
sition. The EMEP performance of modelling SO2−
4 deposition compared to observed
data at ICP sites 1997 and 2000 can be summarised: EMEP slightly overestimates
the total (wet and dry) deposition of SO2−
4 to forests, but differences are within 20%
in 1997 and 30% in 2000, EMEP slightly underestimates the wet deposition of SO2−
4 ,
mainly due to lower precipitation amounts in the EMEP calculations. The modelled
20
concentrations of SO2−
4 in precipitation is very similar to observed, but the modelled
data should be 5 to 15% lower due to dry deposition in observed data in open field with bulk samplers. The consequence of the first two statements above is that EMEP
seems to give somewhat higher dry deposition of SO2−
4 to forests, compared to the dry
deposition observed in the ICP forest plots (throughfall minus deposition in open field).
BGD
2, 933–975, 2005Comparison of deposition fluxes
Westling et al.
Title Page Abstract Introduction Conclusions References
Tables Figures
◭ ◮
◭ ◮
Back Close
Full Screen / Esc
Print Version
Interactive Discussion
EGU
4.3. Nitrogen Deposition
As noted in Sect. 2 it is only possible to compare modelled and observed nitrogen
deposition in precipitation, because canopy exchange (uptake) of nitrogen affects the
chemical composition of throughfall. Open-field sites are used for this comparison, and
Fig. 9 compares modelled and observed deposition of NO−
3. The results show that
5
many points lie along the 1:1 line, but the scatter is large. However, many of the points lying far from the 1:1 line are also those associated with PVI values of more than 20%, which may indicate data-problems rather than model problems. The average, median and percentiles indicate an underestimation by EMEP, compared to observations
(Ta-ble5). The correlation between modelled and observed concentrations of NO−
3 is much
10
higher (Fig.10), compared to deposition, showing that the scattered picture in
deposi-tion is mainly caused by differences in precipitation amounts used by EMEP and ICP,
and probably also by data problems at some ICP sites (indicated by high PVI values).
The comparison between modelled and observed deposition of NH+4 (Fig.13) in open
field is very similar to deposition of NO−
3, but the pattern is even more scattered for NH
+
4. 15
The average and median values are at the same level for NH+4 (Table6) and NO−
3
(Ta-ble5). By comparing concentrations the correlation between modelled and observed
data becomes much higher, except for high concentrations at a few ICP sites.
The spatial patterns of calculated and observed total depositions are illustrated in
Figs. 11 and 12 for oxidised and reduced nitrogen respectively. These plots show
20
mixed results, with values coinciding very well over most of France and northern
Ger-many, but with some areas showing systematic differences between the EMEP and
ICP deposition totals (e.g. southern Norway and Sweden).
The EMEP performance of modelling nitrogen deposition compared to observed data at ICP sites 1997 and 2000 can be summarised: EMEP slightly underestimates
25
the average, median and percentile NO−
3 and NH
+
4 deposition in the whole deposition
gradient, and the correlation between modelled and observed data is relatively low.
Modelled and observed concentrations of both NO−
3 and NH
+
av-BGD
2, 933–975, 2005Comparison of deposition fluxes
Westling et al.
Title Page Abstract Introduction Conclusions References
Tables Figures
◭ ◮
◭ ◮
Back Close
Full Screen / Esc
Print Version
Interactive Discussion
EGU
erage, median and percentiles, and the correlation between modelled and observed
data is rather high. The differences in deposition are mainly caused by differences in
precipitation amount used by EMEP and ICP.
4.4. Concentrations in precipitation
The differences in precipitation amounts used in EMEP and ICP are accompanied by a
5
low correlation between modelled and observed data, as described earlier. The accu-racy of the EMEP modelled wet deposition is probably better described by comparing modelled and observed concentrations in precipitation. The similarities between
mod-elled and observed concentrations in precipitation are summarised in Table7. The ICP
sites in this study are probably too few to clearly show uncertainties in the data that
10
EMEP uses, or to replace the precipitation data for the EMEP grids. But the observed
systematic differences between EMEP and ICP data implies that the accuracy of the
precipitation data used in EMEP should be evaluated against data from national pre-cipitation networks or other independent data at the fine resolution that is required by the model.
15
4.5. Comparisons with EMEP sites
In order to put the above ICP comparison in the context, we present here a brief dis-cussion of some relevant comparisons against wet deposition data from the standard
EMEP network (CCC:2004), also for 1997 and 2000. The objective was to see whether
the same conclusions on model performance could be drawn using the EMEP data as
20
when using the ICP data. Such comparisons, albeit with earlier versions of the EMEP
model have been presented in e.g.Fagerli et al.(2003);Fagerli (2004). Compared to
these standard EMEP data, both oxidised and reduced nitrogen depositions are under-estimated by the model in both years, with the same magnitude as in the comparison
with ICP data. NO−
3 in precipitation is 15 and 23% lower than observations in 1997
25
BGD
2, 933–975, 2005Comparison of deposition fluxes
Westling et al.
Title Page Abstract Introduction Conclusions References
Tables Figures
◭ ◮
◭ ◮
Back Close
Full Screen / Esc
Print Version
Interactive Discussion
EGU
10% in both years. However, in contrast to the comparison with ICP forest data, which concluded that the model underestimated sulphur wet deposition, model results for the
EMEP sites slightly overestimate the measured data (Fig.14). In 1997 and 2000 the
average bias was 10 and 8%, respectively. The modelled precipitation is on average slightly higher than the amounts measured at the EMEP stations, also in contrast to the
5
conclusions from the comparison with ICP precipitation data. There are no major diff
er-ences in the overall model performance for the two years, although the wet deposition of oxidised nitrogen is somewhat more underestimated in 2000 than in 1997.
Further, as noted in Sect.4.1, the correlation between EMEP-model precipitation and
measured precipitation,r2=0.54 andr2=0.42 for 1997 and 2000 respectively, is much
10
better than that found here between EMEP and ICP. This strongly suggests that some
of the poor correlation is likely associated with the difficulties of sampling precipitation
in the ICP network.
5. Conclusions
This paper has presented a comparison of the EMEP chemical transport model with
15
a data-set never before used in the evaluation or formulation of the model, that of the EU/ICP Forest (Level II) monitoring network. Modelled data from 1997 and 2000 were compared with observed deposition data from 160 sites of the EU/ICP Forest (Level II) monitoring network.
In general, similarities between modelled and observed deposition in this study were
20
remarkably good, especially considering the many uncertainties in comparing mea-sured plot data with modelled grid data, and uncertainties inherent in the deposition
monitoring methods themselves (Erisman et al., 2005, 2003;Draaijers et al., 2001).
It should be noted that the EMEP model, with it’s grid size of approx. 50×50 km2 (at
60◦N), cannot be expected to reproduce small-scale variations in deposition regimes,
25
caused by such factors as local emissions (especially important for NH3, e.g.Sutton
BGD
2, 933–975, 2005Comparison of deposition fluxes
Westling et al.
Title Page Abstract Introduction Conclusions References
Tables Figures
◭ ◮
◭ ◮
Back Close
Full Screen / Esc
Print Version
Interactive Discussion
EGU
e.g. Dore et al., 1992; Fowler et al., 1988), or where processes not included in the model (e.g. occult deposition) are important.
EMEP tends to give lower values for the average, median and percentile SO2−
4 , NO − 3
and NH+4 wet deposition in the whole deposition gradient compared to ICP, however,
differences in mean values are within 20% in 1997 and 30% in 2000. Modelled and
5
observed concentrations of SO2−
4 , NO −
3 and NH
+
4 in precipitation are very similar as
average (differences of 0–14%), median and percentiles, and the correlation between
modelled and observed data is rather high (r2=0.50–0.78). The spatial pattern of S
deposition was reproduced very well by the model. For oxidised and reduced nitrogen
the overall spatial patterns were captured but systematic differences were found in
10
some areas.
It was found that precipitation values reported by some ICP sites could show very large variation between 1997 and 2000. A simple variable, precipitation variability in-dex (PVI) was defined to quantify this, and it was found that many of the sites showing large discrepancies between EMEP and ICP data were found to have unusually high
15
PVI values. This suggests that some differences between EMEP modelled and ICP
observed depositions may be due to sampling procedures or complex topographic ef-fects. Although more work is needed to understand these discrepancies, the overall conclusion is that the EMEP model performs rather well in reproducing patterns of S and N deposition to European forests.
20
Acknowledgements. The work of OW, SH and JK was funded by the Swedish ASTA
pro-gramme. The work of HF and DS was supported by the European Commission’s Fifth Frame-work Program in the form of the NOFRETETE Project (contract No. EVK2-CT2001-00106), and by the Co-operative Programme for Monitoring and Evaluation of the Long-range Transmission of Air pollutants in Europe (EMEP) under UNECE.
BGD
2, 933–975, 2005Comparison of deposition fluxes
Westling et al.
Title Page Abstract Introduction Conclusions References
Tables Figures
◭ ◮
◭ ◮
Back Close
Full Screen / Esc
Print Version
Interactive Discussion
EGU References
Adams, P., Seinfeld, J., and Koch, D.: Global concentrations of tropospheric sulfate, nitrate, and ammonium aerosol simulated in a general circulation model, J. Geophys. Res., 104, 13 791–13 828, 1999. 936
Amann, M., Bertok, I., Cofala, J., Gyarfas, F., Heyes, C., Klimont, Z., and Sch ¨opp, W.: Integrated
5
assessment modelling for the Protocol to abate acidification, eutrophication and ground level ozone in Europe, Tech. Rep. 132, Ministry of Housing, Spatial Planning and the Environment, luch & Energie Report, 1999. 935
Benedictow, A.: 1999 meteorological fields produced by PARLAM-PS and used as input for Eulerian EMEP model. Documentation and characterization, Tech. rep., The Norwegian
Me-10
teorological Institute, Oslo, Norway, 2002. 941
CCC:2004: Data Report 2002 Acidifying and eutrophying compounds, Emep/ccc-report, The Norwegian Institute for Air Research (NILU), Kjeller, Norway, 2004. 947
Chang, J., Brost, A., Isaksen, I., Madronich, S., Middleton, P., Stockwell, W., and Walcek, C.: A three-dimensional Eulerian acid deposition model: Physical concepts and formulation, J.
15
Geophys. Res., 92, 14 681–14 700, 1987. 936
De Vries, W., Reinds, G., Van der Salm, C., Draaijers, G., Bleeker, A., Erisman, J., Au ´ee, J., Gundersen, P., Kristensen, H., Van Dobben, H., De Zwart, D., Derome, J., Voogd, J., and Vel, E.: Intensive Monitoring of Forest Ecosystems in Europe, Tech. Rep. 2001a, UN/ECE, EC, Forest Intensive Monitoring Co-ordinating Institute, 177 pp., 2001. 936,938
20
Dore, A., Choularton, T., and Fowler, D.: An improved wet deposition map of the United King-dom incorporating the seeder-feeder effect over mountaneous terrain, Atmospheric Environ-ment, 26A, 1375–1381, 1992. 949
Dorsey, J., Duyzer, J., Gallagher, M., Coe, H., Pilegaard, K. Westrate, J., Jensen, N., and Wal-ton, S.: Oxidised nitrogen and ozone interaction with forests, I: Experimental observations
25
and analysis of exchange with Douglas fir, Q. J. R. Meteorol. Soc., 130, 1941–1955, 2004. 936
Draaijers, G., Erisman, J., Spranger, T., and Wyers, G.: The application of throughfall measure-ments for atmospheric deposition monitoring, Atmospheric Environment, 30, 3349–3361, 1996. 938
30
per-BGD
2, 933–975, 2005Comparison of deposition fluxes
Westling et al.
Title Page Abstract Introduction Conclusions References
Tables Figures
◭ ◮
◭ ◮
Back Close
Full Screen / Esc
Print Version
Interactive Discussion
EGU formed within the framework of the Pan European Intensive Monitoring Program of EU/ICP
forests, TNO report R 2001/140, TNO-MEP, Apeldoorn, 2001. 939,948
Duyzer, J. and Fowler, D.: Modelling land atmosphere exchange of gaseous oxides of nitrogen in Europe, Tellus, 46B, 353–372, 1994. 936
Emberson, L., Ashmore, M., Cambridge, H., Simpson, D., and Tuovinen, J.: Modelling stomatal
5
ozone flux across Europe, Environmental Pollution, 109, 403–414, 2000a. 941
Emberson, L., Simpson, D., Tuovinen, J.-P., Ashmore, M., and Cambridge, H.: Towards a model of ozone deposition and stomatal uptake over Europe, EMEP MSC-W Note 6/2000, 2000b. 941
Emberson, L., Wieser, G., and Ashmore, M.: Modelling of stomatal conductance and ozone
10
flux of Norway spruce: comparison with field data, Environmental Pollution, 109, 393–402, 2000c. 941
Erisman, J. and Draaijers, G.: Atmospheric deposition in relation to acidification and eutrophi-cation, Studies in Environmental Research, 63, 1995. 937
Erisman, J., Vermeulen, A., Hensen, A., Flechard, C., D ¨ammgen, U., Fowler, D., Sutton, M.,
15
Gr ¨unhage, L., and Tuovinen, J.: Monitoring and modelling of biosphere/atmosphere ex-change of gases and aerosols in Europe, Environmental Pollution, 403–413, 2005. 936, 938,940,948
Erisman, J. W., M ¨ols, H., Fonteijn, P., Geusebroek, M., Draaijers, G., Bleeker, A., and van der Veen, D.: Field intercomparison of precipitation measurements performed within the
frame-20
work of the Pan European Intensive Monitoring Program of EU/ICP Forest, Environmental Pollution, 125, 139–155, 2003. 940,948
Fagerli, H.: Air concentrations and deposition of acidifying and eutrophying components, sta-tus 2002, in EMEP Report 1/2004, Transboundary acidification, eutrophication and ground level ozone in Europe, Status Report 1/2004, The Norwegian Meteorological Institute, Oslo,
25
Norway, 77–103, 2004. 947
Fagerli, H., Simpson, D., and Aas, W.: Model performance for sulphur and nitrogen compounds for the period 1980 to 2000, in In Transboundary Acidification, Eutrophication and Ground Level Ozone in Europe. EMEP Status Report 1/2003, Part II Unified EMEP Model Perfor-mance, edited by L. Tarras ´on, The Norwegian Meteorological Institute, Oslo, Norway, 1–66,
30
2003. 947
Sta-BGD
2, 933–975, 2005Comparison of deposition fluxes
Westling et al.
Title Page Abstract Introduction Conclusions References
Tables Figures
◭ ◮
◭ ◮
Back Close
Full Screen / Esc
Print Version
Interactive Discussion
EGU tus Report 1/2004, The Norwegian Meteorological Institute, Oslo, Norway, 11–18, 2004. 940
Fowler, D. and Erisman, J.: Biosphere/Atmosphere Exchange of Pollutants. Overview of subproject BIATEX-2, in: Towards Cleaner Air for Europe – Science, Tools and Applica-tions, Part 2, Overviews from the Final Reports of the EUROTRAC-2 Subprojects, edited by: Midgley, P. M. and Reuther, M., Margraf Verlag, Weikersheim, also available from
5
http://www.gsf.de/eurotrac/publications/, 2003. 936,941
Fowler, D., Cape, J., Leith, I., Choularton, T., Gay, M., and Jones, A.: The influence of altitude on rainfall composition at Great Dun Fell, Atmospheric Environment, 22, 1355–1362, 1988. 949
Fowler, D., Sutton, M. A., Flechard, C., Cape, J. N., Storeton-West, R., Coyle, M., and Smith,
10
R. I.: The control of SO2 dry deposition on to natural surfaces by NH3 and its effects on regional deposition, Water, Air and Soil Pollution, 1, 39–48, 2001. 936
Hjellbrekke, A.-G.: Data Report 2002 Acidifying and eutrophying compounds, Tech. Rep. EMEP/CCC Report 1/2004, The Norwegian Institute for Air Research (NILU), Kjeller, Norway, 2004. 935
15
Hultberg, H. and Grennfelt, P.: Sulphur and seasalt deposition as reflected by throughfall and runoffchemistry in forested catchments, Environmental Pollution, 75, 215–222, 1992. 937 ICP-Forest, 1998: Manual on methods and criteria for harmonized sampling, assessment,
mon-itoring and analysis of the effects of air pollution on forests, Tech. rep., Federal Research Centre for Forestry and Forestry Products (BFH), Hamburg, Germany, edited in May 1998
20
by the programme Coordinating Centre, 1998. 936,938
Mathur, R. and Dennis, R. L.: Seasonal and annual modeling of reduced nitrogen compounds over the eastern United States: Emissions, ambient levels, and deposition amounts, J. Geo-phys. Res., 108, 4481, 2003. 936
Metzger, S. M., Dentener, F. J., Jeuken, A., , Krol, M., and Lelieveld, J.: Gas/Aerosol Partitioning
25
2, Global modeling results, J. Geophys. Res., 107, ACH 17, 2002a. 940
Metzger, S. M., Dentener, F. J., Lelieveld, J., and Pandis, S. N.: Gas/Aerosol Partitioning 1. A computionally efficient model., J. Geophys. Res., 107, ACH 16, 2002b. 940
Nemitz, E., Milford, C., and Sutton, M. A.: A two-level canopy compensation point model for describing bi-directional biosphere-atmosphere exchange of ammonia, Q. J. R. Meteorol.
30
Soc., 127, 815–833, 2001. 941
BGD
2, 933–975, 2005Comparison of deposition fluxes
Westling et al.
Title Page Abstract Introduction Conclusions References
Tables Figures
◭ ◮
◭ ◮
Back Close
Full Screen / Esc
Print Version
Interactive Discussion
EGU Roelofs, G., Kasibhatla, P., Barrie, L., Bergmann, D., Bridgeman, C., Chin, M., Christensen,
J., Easter, R., Feichter, J., Jeuken, A., Kjellstrom, E., Koch, D., Land, C., Lohmann, U., and Rasch, P.: Analysis of regional budgets of sulfur species modeled for the COSAM exercise, Tellus, 53B, 673–694, 2001. 937
Schaap, M., van Loon, M., ten Brink, H. M., Dentener, F. J., and Builtjes, P. J. H.: Secondary
in-5
organic aerosol simulations for Europe with special attention to nitrate, Atmos. Chem. Phys., 4, 857–874, 2004,SRef-ID: 1680-7324/acp/2004-4-857. 936
Sch ¨opp, W., Amann, M., Cofala, J., Heyes, C., and Klimont, Z.: Integrated assessment of European air pollution emission control strategies, Environ. Mod. & Software, 14, 1–9, 1999. 935
10
Simpson, D., Tuovinen, J.-P., Emberson, L., and Ashmore, M.: Characteristics of an ozone deposition module, Water, Air and Soil Pollution: Focus, 1, 253–262, 2001. 941
Simpson, D., Fagerli, H., Jonson, J., Tsyro, S., Wind, P., and Tuovinen, J.-P.: The EMEP Unified Eulerian Model. Model Description, EMEP MSC-W Report 1/2003, The Norwegian Meteorological Institute, Oslo, Norway, 2003a. 935,940,941
15
Simpson, D., Tuovinen, J.-P., Emberson, L., and Ashmore, M.: Characteristics of an ozone deposition module II: sensitivity analysis, Water, Air and Soil Pollution, 143, 123–137, 2003b. 941
Smith, R. and Fowler, D.: Uncertainty estimation in the wet deposition of sulphur, Water, Air and Soil Pollution: Focus, 1, 341–354, 2001. 939
20
Smith, R., Fowler, D., Sutton, M. A., Flechard, C., and Coyle, M.: Regional estimation of pol-lutant gas dry deposition in the UK: model description, sensitivity analyses and outputs, Atmospheric Environment, 34, 3757–3777, 2000. 941
Sutton, M., Asman, W., and Schjørring, J.: Dry deposition of reduced nitrogen, Tellus, 46B, 225–273, 1994. 936
25
Sutton, M. A., Milford, C., Dragosits, U., Place, C. J., Singles, R. J., Smith, R. I., Pitcairn, C. E. R., Fowler, D., Hill, J., and ApSimon, H. M.: Dispersion, deposition and impacts of atmo-spheric ammonia: quantifying local budgets and spatial variability, Environmental Pollution, 102, 349–361, 1998. 948
Tuovinen, J.-P., Simpson, D., Mikkelsen, T., Emberson, L., M., M. R. A., Aurela, Cambridge,
30
BGD
2, 933–975, 2005Comparison of deposition fluxes
Westling et al.
Title Page Abstract Introduction Conclusions References
Tables Figures
◭ ◮
◭ ◮
Back Close
Full Screen / Esc
Print Version
Interactive Discussion
EGU Tuovinen, J.-P., Ashmore, M., Emberson, L., and Simpson, D.: Testing and improving the EMEP
ozone deposition module, Atmospheric Environment, 38, 2373–2385, 2004. 941
UNECE/EC, 2000: Intensive Monitoring of Forest Ecosystems in Europe, Evaluation of the Programme in view of its objectives and proposals for the scientific evaluation of the data, A strategy document, Tech. rep., UN/ECE 2000, Brussels Geneva, edited by: de Vries, W.,
5
http://europa.eu.int/comm/agriculture/fore/monitor/2000/strat en.pdf, 2000. 936
van Loon, M., Roemer, M. G. M., and Builtjes, P. J. H.: Model Inter-Comparison In the frame-work of the Unified EMEP model, TNO report R2004/282, TNO, Apeldoorn, The Netherlands, 2004. 937
Vestreng, V., Adams, M., and Goodwin, J.: Inventory Review 2004. Emission data reported to CLRTAP and under the NEC directive. EMEP/EEA Joint Review Report, Tech. Rep. EMEP-MSCW Report 1/2004, The Norwegian Meteorological Institute, Oslo, Norway, 2004. 941
575
BGD
2, 933–975, 2005Comparison of deposition fluxes
Westling et al.
Title Page Abstract Introduction Conclusions References
Tables Figures
◭ ◮
◭ ◮
Back Close
Full Screen / Esc
Print Version
Interactive Discussion
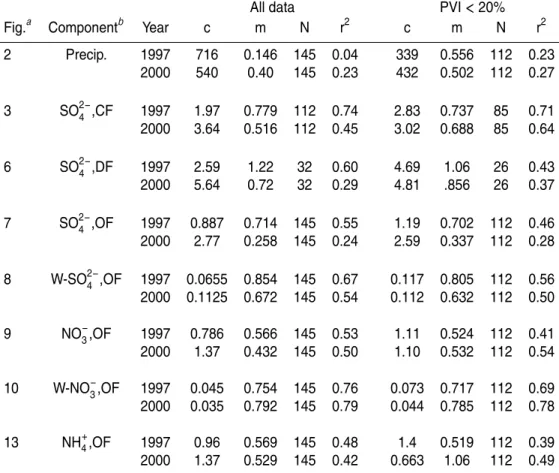
EGU Table 1. Summary of statistical comparisons for 1997 and 2000. Tables give intercept (c),
slope (m), number of points (N) and correlation coefficients (r2) derived from linear regression of the scatter plots indicated.
All data PVI<20%
Fig.a Componentb Year c m N r2 c m N r2
2 Precip. 1997 716 0.146 145 0.04 339 0.556 112 0.23 2000 540 0.40 145 0.23 432 0.502 112 0.27 3 SO2−
4 ,CF 1997 1.97 0.779 112 0.74 2.83 0.737 85 0.71 2000 3.64 0.516 112 0.45 3.02 0.688 85 0.64 6 SO2−
4 ,DF 1997 2.59 1.22 32 0.60 4.69 1.06 26 0.43
2000 5.64 0.72 32 0.29 4.81 .856 26 0.37 7 SO2−
4 ,OF 1997 0.887 0.714 145 0.55 1.19 0.702 112 0.46 2000 2.77 0.258 145 0.24 2.59 0.337 112 0.28 8 W-SO2−
4 ,OF 1997 0.0655 0.854 145 0.67 0.117 0.805 112 0.56 2000 0.1125 0.672 145 0.54 0.112 0.632 112 0.50
9 NO−
3,OF 1997 0.786 0.566 145 0.53 1.11 0.524 112 0.41 2000 1.37 0.432 145 0.50 1.10 0.532 112 0.54 10 W-NO−
BGD
2, 933–975, 2005Comparison of deposition fluxes
Westling et al.
Title Page Abstract Introduction Conclusions References
Tables Figures
◭ ◮
◭ ◮
Back Close
Full Screen / Esc
Print Version
Interactive Discussion
EGU Table 2.Annual precipitation during 1997 and 2000. EMEP modelled and ICP bulk (147 sites).
Annual EMEP 1997 ICP 1997 EMEP 2000 ICP 2000
precipitation mm mm mm mm
average 825 856 981 1105
median 719 823 896 1062
max 3038 2403 2865 2829
p80 917 1068 1126 1396
p60 794 898 951 1133
p40 691 729 841 932
p20 613 593 756 738
BGD
2, 933–975, 2005Comparison of deposition fluxes
Westling et al.
Title Page Abstract Introduction Conclusions References
Tables Figures
◭ ◮
◭ ◮
Back Close
Full Screen / Esc
Print Version
Interactive Discussion
EGU Table 3. Deposition of SO2−
4 (as S) in coniferous forests. EMEP modelled wet+dry and ICP throughfall (115 sites) during 1997 and 2000.
Deposition EMEP 1997 ICP 1997 EMEP 2000 ICP 2000 of SO2−
4 kg/ha kg/ha kg/ha kg/ha
average 8.30 7.90 7.31 7.00
median 5.96 5.63 6.81 4.98
max 32.31 38.34 19.11 30.78
p80 15.00 11.62 11.14 10.24
p60 7.73 7.36 7.51 6.57
p40 5.16 4.36 6.19 4.55
p20 2.60 3.04 3.45 2.94
BGD
2, 933–975, 2005Comparison of deposition fluxes
Westling et al.
Title Page Abstract Introduction Conclusions References
Tables Figures
◭ ◮
◭ ◮
Back Close
Full Screen / Esc
Print Version
Interactive Discussion
EGU Table 4. Deposition of SO2−
4 (as S) in precipitation. EMEP modelled wet and ICP bulk precipi-tation (149 sites) during 1997 and 2000.
Deposition EMEP 1997 ICP 1997 EMEP 2000 ICP 2000 of SO2−
4 kg/ha kg/ha kg/ha kg/ha
average 4.80 5.30 4.24 5.73
median 4.29 4.80 4.25 5.02
max 16.65 12.86 8.77 18.18
p80 6.96 7.83 5.33 7.93
p60 4.80 5.78 4.46 5.92
p40 3.60 4.29 4.04 4.40
p20 2.57 2.63 3.12 3.26
BGD
2, 933–975, 2005Comparison of deposition fluxes
Westling et al.
Title Page Abstract Introduction Conclusions References
Tables Figures
◭ ◮
◭ ◮
Back Close
Full Screen / Esc
Print Version
Interactive Discussion
EGU Table 5.Deposition of NO−
3 (as N) in open field. EMEP modelled wet and ICP bulk precipitation (157 sites) during 1997 and 2000.
Deposition EMEP 1997 ICP 1997 EMEP 2000 ICP 2000 of NO−
3 kgN/ha kgN/ha kgN/ha kgN/ha
average 3.07 3.65 3.28 4.44
median 2.92 3.37 3.30 4.16
max 6.56 8.26 6.50 12.41
p80 4.44 5.65 4.65 6.37
p60 3.34 4.09 3.88 4.74
p40 2.45 3.03 2.78 3.72
p20 1.66 1.74 2.05 2.13
BGD
2, 933–975, 2005Comparison of deposition fluxes
Westling et al.
Title Page Abstract Introduction Conclusions References
Tables Figures
◭ ◮
◭ ◮
Back Close
Full Screen / Esc
Print Version
Interactive Discussion
EGU Table 6.Deposition of NH+4 (as N) in open field. EMEP modelled wet and ICP bulk precipitation
(157 sites) during 1997 and 2000.
Deposition EMEP 1997 ICP 1997 EMEP 2000 ICP 2000 of SO2−
4 -S kg/ha kg/ha kg/ha kg/ha
average 3.39 4.07 3.90 4.67
median 2.96 3.50 3.78 4.28
max 11.96 12.77 13.27 13.56
p80 5.38 6.31 5.82 7.16
p60 3.87 4.37 4.37 5.16
p40 2.26 2.84 2.94 3.63
p20 1.20 1.42 1.67 2.00
BGD
2, 933–975, 2005Comparison of deposition fluxes
Westling et al.
Title Page Abstract Introduction Conclusions References
Tables Figures
◭ ◮
◭ ◮
Back Close
Full Screen / Esc
Print Version
Interactive Discussion
EGU Table 7.Volume weighted concentrations in precipitation 1997 and 2000. Units given as mgS/L
or mgN/L as appropriate.
Concentrations in EMEP 1997 ICP 1997 EMEP 2000 ICP 2000
precipitation mg/L mg/L mg/L mg/L
SO2−
4 average 0.61 0.63 0.46 0.52
SO2−
4 median 0.58 0.58 0.46 0.50
NO−
3 average 0.39 0.45 0.36 0.41
NO−
3 median 0.41 0.44 0.36 0.40
NH+4 average 0.42 0.49 0.42 0.43
BGD
2, 933–975, 2005Comparison of deposition fluxes
Westling et al.
Title Page Abstract Introduction Conclusions References
Tables Figures
◭ ◮
◭ ◮
Back Close
Full Screen / Esc
Print Version
Interactive Discussion
BGD
2, 933–975, 2005Comparison of deposition fluxes
Westling et al.
Title Page Abstract Introduction Conclusions References
Tables Figures
◭ ◮
◭ ◮
Back Close
Full Screen / Esc
Print Version
Interactive Discussion
EGU
0 1000 2000 3000
0 500 1000 1500 2000 2500 3000 3500
(a) Precipitation (mm), year 1997
ICP
EMEP
0 1000 2000 3000
0 500 1000 1500 2000 2500 3000
ICP
EMEP
(b) Precipitation (mm), Year 2000
BGD
2, 933–975, 2005Comparison of deposition fluxes
Westling et al.
Title Page Abstract Introduction Conclusions References
Tables Figures
◭ ◮
◭ ◮
Back Close
Full Screen / Esc
Print Version
Interactive Discussion
EGU
0 10 20 30 40 0
5 10 15 20 25 30 35 40
(a) Year 1997
ICP
EMEP
0 10 20 30
0 5 10 15 20 25 30
ICP
EMEP
(b) Year 2000
Fig. 3. Total deposition of SO2−
4 in coniferous forests, kgS ha− 1
BGD
2, 933–975, 2005Comparison of deposition fluxes
Westling et al.
Title Page Abstract Introduction Conclusions References
Tables Figures
◭ ◮
◭ ◮
Back Close
Full Screen / Esc
Print Version
Interactive Discussion
EGU 2.00
5.00 8.00 12.00 15.00 20.00 25.00
Fig. 4. Yearly average total deposition of SO2−
4 in coniferous forests, kgS ha
−1yr−1. EMEP
BGD
2, 933–975, 2005Comparison of deposition fluxes
Westling et al.
Title Page Abstract Introduction Conclusions References
Tables Figures
◭ ◮
◭ ◮
Back Close
Full Screen / Esc
Print Version
Interactive Discussion
EGU
0 2 4 6 8 10 12
0 0.5 1 1.5 2 2.5 3 3.5 4 4.5
Month
kg/ha/month
ICP Germany EMEP Germany ICP Sweden EMEP Sweden
Fig. 5. Monthly average total deposition of SO2−
4 in coniferous forests, kgS ha
−1 month−1,
BGD
2, 933–975, 2005Comparison of deposition fluxes
Westling et al.
Title Page Abstract Introduction Conclusions References
Tables Figures
◭ ◮
◭ ◮
Back Close
Full Screen / Esc
Print Version
Interactive Discussion
EGU
0 10 20 30 40 0
5 10 15 20 25 30 35 40
(a) Year 1997
ICP
EMEP
0 10 20 30
0 5 10 15 20 25 30
ICP
EMEP
(b) Year 2000
Fig. 6. Total deposition of SO2−
4 in deciduous forests, kgS ha− 1
BGD
2, 933–975, 2005Comparison of deposition fluxes
Westling et al.
Title Page Abstract Introduction Conclusions References
Tables Figures
◭ ◮
◭ ◮
Back Close
Full Screen / Esc
Print Version
Interactive Discussion
EGU
0 5 10 15
0 2 4 6 8 10 12 14 16 18
(a) Year 1997
ICP
EMEP
0 5 10 15 20
0 5 10 15 20
ICP
EMEP
(b) Year 2000
Fig. 7. Deposition of SO2−
4 -S in open field, kgS ha− 1
yr−1. EMEP modelled wet vs. ICP bulk
BGD
2, 933–975, 2005Comparison of deposition fluxes
Westling et al.
Title Page Abstract Introduction Conclusions References
Tables Figures
◭ ◮
◭ ◮
Back Close
Full Screen / Esc
Print Version
Interactive Discussion
EGU
0 0.5 1 1.5 2 2.5 0
0.5 1 1.5 2 2.5
(a) Year 1997
ICP
EMEP
0 0.5 1 1.5
0 0.2 0.4 0.6 0.8 1 1.2 1.4
ICP
EMEP
(b) Year 2000
Fig. 8. Volume weighted concentrations of SO2−
4 in precipitation, mgS L
−1, EMEP modelled wet
BGD
2, 933–975, 2005Comparison of deposition fluxes
Westling et al.
Title Page Abstract Introduction Conclusions References
Tables Figures
◭ ◮
◭ ◮
Back Close
Full Screen / Esc
Print Version
Interactive Discussion
EGU
0 2 4 6 8 10
0 2 4 6 8 10
(a) Year 1997
ICP
EMEP
0 5 10 15
0 5 10 15
ICP
EMEP
(b) Year 2000
Fig. 9. Deposition of NO−
3 in open field, kgN ha− 1
yr−1. EMEP modelled wet vs. ICP bulk
BGD
2, 933–975, 2005Comparison of deposition fluxes
Westling et al.
Title Page Abstract Introduction Conclusions References
Tables Figures
◭ ◮
◭ ◮
Back Close
Full Screen / Esc
Print Version
Interactive Discussion
EGU
0 0.2 0.4 0.6 0.8 1 0
0.2 0.4 0.6 0.8 1
(a) Year 1997
ICP
EMEP
0 0.2 0.4 0.6 0.8 1 0
0.2 0.4 0.6 0.8 1
ICP
EMEP
(b) Year 2000
Fig. 10. Volume weighted concentrations of NO−
3 in precipitation, mgN L
−1
BGD
2, 933–975, 2005Comparison of deposition fluxes
Westling et al.
Title Page Abstract Introduction Conclusions References
Tables Figures
◭ ◮
◭ ◮
Back Close
Full Screen / Esc
Print Version
Interactive Discussion
EGU 1.000
2.000 3.000 4.000 5.000 7.000
Fig. 11. Yearly average wet deposition of oxidised nitrogen, kgN ha−1yr−1. EMEP modelled
BGD
2, 933–975, 2005Comparison of deposition fluxes
Westling et al.
Title Page Abstract Introduction Conclusions References
Tables Figures
◭ ◮
◭ ◮
Back Close
Full Screen / Esc
Print Version
Interactive Discussion
EGU 1.000
2.000 3.000 4.000 5.000 7.000
Fig. 12. Yearly average wet deposition of reduced nitrogen, kgN ha−1yr−1. EMEP modelled
BGD
2, 933–975, 2005Comparison of deposition fluxes
Westling et al.
Title Page Abstract Introduction Conclusions References
Tables Figures
◭ ◮
◭ ◮
Back Close
Full Screen / Esc
Print Version
Interactive Discussion
EGU
0 5 10 15
0 5 10 15
(a) Year 1997
ICP
EMEP
0 5 10 15
0 5 10 15
ICP
EMEP
(b) Year 2000
Fig. 13. Deposition of NH+4-N in open field, kgN ha−1yr−1. EMEP modelled wet vs. ICP bulk
BGD
2, 933–975, 2005Comparison of deposition fluxes
Westling et al.
Title Page Abstract Introduction Conclusions References
Tables Figures
◭ ◮
◭ ◮
Back Close
Full Screen / Esc
Print Version
Interactive Discussion
EGU Fig. 14. Scatter-plots of modelled versus observed (EMEP stations) sulphur wet deposition in