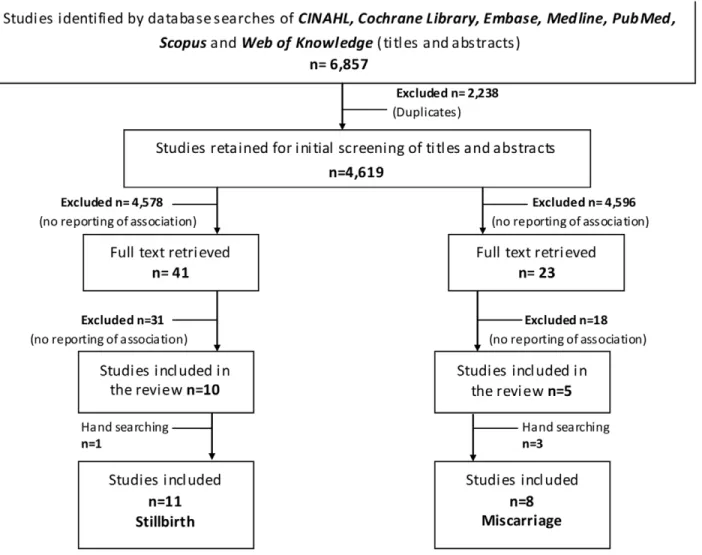
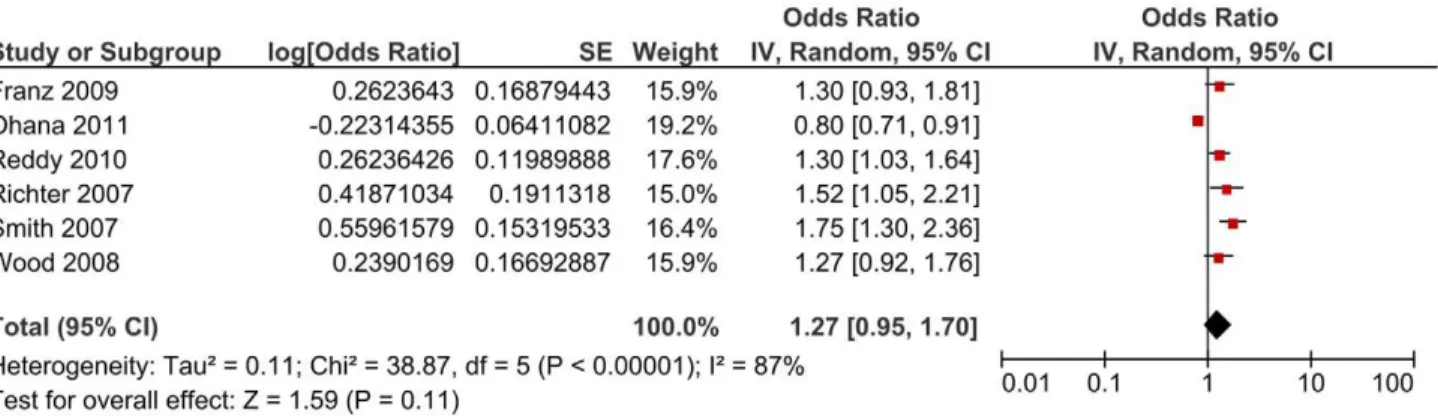
Caesarean delivery and subsequent stillbirth or miscarriage: systematic review and meta-analysis.
Texto
Imagem


Documentos relacionados
Method : We performed a meta-analysis of published genetic association studies by searching through Medline, PubMed, and Web of Science databases to analyze a possible
Para atender aos requisitos de latência e da prevenção da sobrecarga, o IoV exige no- vas perspectivas para o desenvolvimento de algoritmos e técnicas que controlam o tráfego de
A computer-based search of compatible papers from 1966 to November 2017 was performed using the following databases: MEDLINE-Pubmed, EMBASE, LILACS and The Cochrane Library.
O estágio na COFICAB Portugal contribuiu para um melhor conhecimento da dinâmica de uma empresa multinacional e os serviços que esta oferece, assim como a importância que um
Para o meio acadêmico, por não possuir muitas fontes sobre o mercado de luxo, e especificamente sobre importação de carros de luxo, este trabalho pretende fornecer mais
A Secretaria de Educação Especial em 2002 divulgou um documento denominado Portal de Ajudas Técnicas fundamentado no Artigo 208, nos incisos I e III da Constituição da República
Os ensaios de avaliação da atividade antioxidante foram realizados pelo método DPPH, que é baseado na captura do radical DPPH (2,2-difenil-1-picril-hidrazil)
Conclui-se que o Programa de Residência Médica de Saúde da Família e Comunidade da Universidade de Gurupi promove melhoria na qualidade dos serviços da Atenção Básica de
