Apps vs Devices: Can the Usability of Mobile Apps be
Decoupled from the Device?
Azham Hussain1 and Maria Kutar2
1School of Computing, UUM College of Arts and Sciences, Universiti Utara Malaysia, Malaysia.
2
Salford Business School, University of Salford, Manchester M5 4WT. United Kingdom.
ABSTRACT
In this paper we present a study using subjective measures to examine usability of mobile phone applications running on two different platforms, the OSX iPhone and an O2 Orbit running Windows Mobile operating system. The aim was to enhance the understanding of the influence of devices on mobile application usability. We gathered subjective measures using questionnaires to assess the satisfaction level while using mobile applications installed on two different devices. Results indicate that the device on which an application is installed strongly influence user satisfaction.
Keywords: Usability, Mobile Application, App, iPhone, O2 Orbit.
1.
Introduction
Evaluation of interfaces is a primary task in human-computer interaction. Nielsen [1] describes usability as multiple components that are associated with five usability attributes which can be divided into objective and subjective measures. Objective measures will describe how effective and efficient an application is, while subjective measures examine user‟s thoughts and feelings about their use of the application. Objective measurements are difficult to carry out effectively, and the process of collecting objective data can be time-consuming and costly. In contrast, subjective data may be obtained more easily, quickly, and inexpensively. Subjective measurement techniques also provides the only direct means for the assessment of user opinion and preferences [2].
Usability of mobile phone application is becoming an increasingly important area as the many applications previously run on desktop computers, are now running via mobile phone technologies. Growing demand for mobile application can be seen in many business industries. For example in airlines, a survey reveals that 78% of airlines
intend to adapt their Web sites to work on mobile phones by 2012 [3]. However, designing effective user interfaces for mobile application is difficult as there is a very limited amount of screen resource, small screen display, limited
bandwidth, and users‟ eyes are often focused on the external environment rather than the interface, which makes input and interpretation of output difficult. If users are using the device whilst walking or driving, they cannot devote all of their attention, and in particular, visual attention to it. Consequently the design of visual interfaces that can work in these conditions is challenging.
This paper will expose the usability factor that influence design of mobile applications and determine the usability problems which may arise when mobile applications are installed in different platforms. The next section will discuss previous studies in the area of mobile applications and evaluation, followed by research design and study methodology in section three. We give results from the study in section four together with discussion of the findings. Finally, conclusions and recommendation are given in section five.
2.
Usability of Mobile Applications
positioning it as the key repository for other core services. These include news, travel, weather, sports updates, and access to social networking site, which are becoming
essentials and „must-have‟ for many users [5]. The increasing number of mobile users indicates the importance of ensuring that applications are useable.
Usability evaluation methods refer to the techniques employed to carry out usability evaluation, such as usability testing, focus groups and interviews. All of these methods have been used by many researchers to evaluate usability, and each method has advantages and disadvantages depending on the specific objectives of the study. Different evaluation methods have emerged and contributed to the evolution of usability evaluation, giving software development organizations a wide collection of techniques that fit specific development projects [6]. Usability research on mobile phones is an emerging area of interest. The usability studies utilized are mainly conventional usability testing methods. Ramsay [7] conducted a usability study on WAP (Wireless Application Protocol) when it was first introduced to the market. He investigated the usability of WAP from a
user‟s point-of-view, aimed at highlighting important factors to form guidelines and reference for future WAP user interface designs. There were many technical issues regarding WAP, such as connectivity rates, data access, etc and more information was needed from the usability point of view. A study by Condos et al. [8] on WAP evaluated two main UK WAP portals based on a survey on usage and future trends, as well as a WAP usability evaluation. They compared the methodologies and results of their study with past research and developed usability principles (a total of 10 guiding principles were written), thus contributing to further developments of WAP and M-commerce. Jason et al. [9] studied the effects of using
mobile devices while “on the move”, specifically HCI issues involved in using mobile devices in the dynamic/field environment. The mobile device used was a personal digital assistant (PDA) with a customized interface. The four main issues identified are dynamic user configuration, limited attention capacity, high-speed interaction and context dependency.
Most of the constraints on mobile device (low bandwidth, low storage, short battery life and limited processor speed) may be solved but how about small screen size. With small screen, designers must choose only the most important features to display even with high resolution screens. A few studies focus on small screen are; Maniar [10] investigates the effect of mobile phone screen size on video based learning to find out the users acceptance level on mLearning. Findlater [11] look on the impact of screen size on performance and user satisfaction and found most hypothesis are supported that large screen are better then small screen.
3.
Evaluation Method and Implementation
Several qualitative techniques suggested by Nielsen [1] for usability evaluation are observation, questionnaire and interviews, focus groups and user feedbacks. All these methods have been used by researchers to evaluate usability and each method has advantages and disadvantages depending on the objective of the study. In the study reported in this paper we employed questionnaires and interviews to give flexibility to participants and we allow them to get familiar with application before they answer questionnaire and been interviewed.
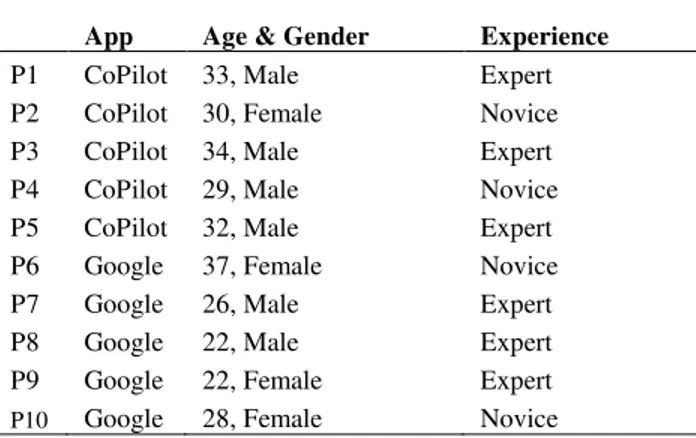
Ten subjects participated in our test sessions. Six of them were male, and four female. The age of subjects ranged from 22 to 37 years old. Six were experienced mobile application users and four were novice users. Participants were given time to learn and become familiar with the application and platform before starting the session. Each session consisted of five simple tasks to be completed using the application, before being requested to complete a questionnaire and then take part in an informal interview session to discover participant‟s thoughts on the mobile application. Table 1 shows the description of participants.
Table 1: Participant Descriptions
App Age & Gender Experience
P1 CoPilot 33, Male Expert
P2 CoPilot 30, Female Novice
P3 CoPilot 34, Male Expert
P4 CoPilot 29, Male Novice
P5 CoPilot 32, Male Expert
P6 Google 37, Female Novice
P7 Google 26, Male Expert
P8 Google 22, Male Expert
P9 Google 22, Female Expert
P10 Google 28, Female Novice
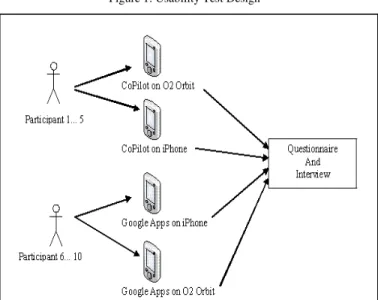
Participants were asked to use O2 Orbit 2 for Windows mobile OS and iPhone for OS X iPhone OS. Both devices contained a GPS Receiver for SatNav system. Both devices also had WiFi capability to connect to wireless internet. Other features of both mobile phones included touch screen, virtual keypad and sound speaker. Using a within-subjects study design, each participant was assigned a mobile application, withers CoPilot or GoogleApps, and completed the tasks using both the O2 Orbit and the iPhone.
Figure 1: Usability Test Design
3.1
CoPilot Application
CoPilot Live is a satellite navigation mobile application that can be installed in mobile phones. This application is designed for drivers, especially for those who are not familiar with new routes and locations. The application provides a flying interface with an oblique bird's-eye view of the road, as well as a direct-overhead map view. It uses a GPS receiver to show the precise location, and provides visual and spoken directions on how to drive to the chosen destination. Other features available to assist the user include speed camera location, speed limit information, expected time to arrival, points of interest and current traffic condition data.
We created five tasks to be carried out using each device. Care was taken to ensure that the tasks were simple, met the purpose of the applications, and represent the main part of user interfaces, as suggested by Nielsen [1].
Picture 1: Participant with CoPilot Apps
Tasks included; navigation to a specific address, key-in of a favorite address and changing the measurement unit. The tasks were undertaking inside the car in order to get the satellite signal and to let the participant experience the real environment when they make use the application, but the car remained stationary during the study for safety reasons. Participants were required to complete a questionnaire, and an interview session took place after all tasks were finished.
3.2
Mobile Google Apps
Google Apps is a set of free web applications offered by Google Inc. Users are required to have a Google Account in order to use all applications in Google apps. Popular applications in Google apps include Google Mail, Google Calendar and Google Documents. Google Mail is a widely used email client which allows users to manage multiple email accounts. Google Calendar allows multiple calendars to be created and shown in the same view. They can also be easily shared. Google Calendar is a web-based application which runs on any operating system, which has a browser that supports the required web technologies. Google Docs allows users to create, edit and store common office documents using word processing, spreadsheet and presentation software. User can access and read their document anytime anywhere using a mobile phone with internet connection, which may be either a WiFi or a 3G connection. However, the applications for mobile are different compared to desktop apps in term of the interface and functions, in response to the specific needs of the mobile environment.
For Google apps, five tasks were created for both the O2 and iPhone devices. We created a new Google account for participants which were deleted after the study was completed. Among the tasks created for Google Apps are; finding the nearest event in Google calendar, sending an email, reading a PDF file in Google Docs and creating a new event for Google calendar.
Participants were required to complete a questionnaire, and an interview session took place after all tasks were finished.
3.3
Questionnaire and Interview Session
The questionnaire used was based on the Questionnaire for User Interaction Satisfaction (QUIS) originated by Chin [12], with some amendments to comply with the mobile environment. The questionnaire contains forty questions in six sections and the last section focused on the mobile setting. We also create a semi-structured instrument for the interview session, to support the data from questionnaire. The questions were designed so as not to be too technical, and the session was conducted in an informal manner, the overall aim being to obtain
participants‟ opinions and perspectives on using mobile
application. Examples of questions include the feeling after completed the task, the comment on menu arrangement, voice assistance, interface, screen, satisfaction on system speed and safety. We also ask participants to comment on the devices for both iPhone and O2 Orbit in term of screen size, speed and text size.
4.
Results and Discussions
In this section the results for both platforms will be compared to uncover usability problems. We summarize the results by showing the mean and standard deviation for all sections in questionnaire and then discuss the results for both platforms.
4.1
CoPilot
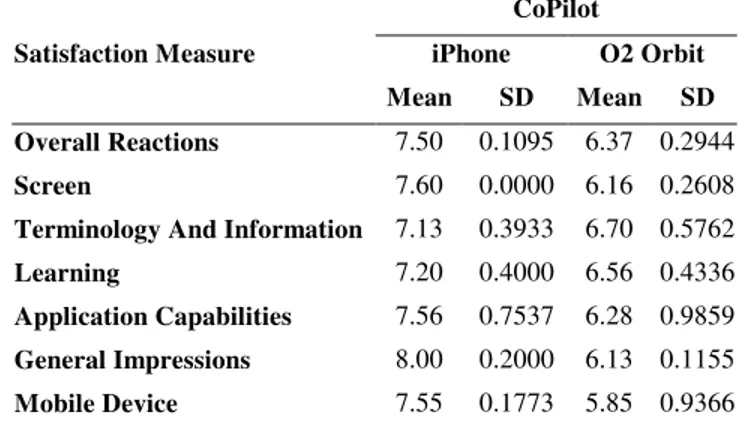
Table 2 shows the mean and standard deviation for the CoPilot app running on the iPhone and O2 Orbit. Overall reaction to this application shows that the participants were very satisfied with the application, particularly for the iPhone device. Participants agreed that the application on iPhone was very impressive and stimulating. However, participants rated CoPilot on the Orbit as only „satisfied‟ and the mean for overall section is 6.37 on a 9 point Likert scale. Participants rated the application on Orbit as not so easy to use and quite inflexible. One participant rated
CoPilot on the Orbit as „moderate‟ for all questions in terms of overall reaction.
For the screen design, all participants gave scores of at least 8 on the 9 point Likert scale for the layout and the sequence of screens for iPhone, with lower scores for the Orbit. Participants were very happy with the instructions provided on the screen, and with the voice assistance while using the application for both devices. It was also revealed that that the speaker for Orbit is more clear in comparison with the iPhone.
Table 2: Results for CoPilot
CoPilot
Satisfaction Measure iPhone O2 Orbit
Mean SD Mean SD
Overall Reactions 7.50 0.1095 6.37 0.2944
Screen 7.60 0.0000 6.16 0.2608
Terminology And Information 7.13 0.3933 6.70 0.5762
Learning 7.20 0.4000 6.56 0.4336
Application Capabilities 7.56 0.7537 6.28 0.9859 General Impressions 8.00 0.2000 6.13 0.1155
Mobile Device 7.55 0.1773 5.85 0.9366
Overall rating for satisfaction on the learning process shows that the participants were confident and found it straightforward to learn to use the application. Novice users gave higher satisfaction ratings for learning to operate the application on both devices.
The satisfactions levels on system response time showed discrepancy between the two devices. Participants were not happy with the system response time on the O2 Orbit, with some scores of 3 on the 9 point Likert scale but there was greater satisfaction with system response time for the iPhone device. In term of general impression of the application, it is clear that the participant expressed greater satisfaction with screen design on iPhone. We realize that the iPhone screen is brighter and more contrast compare to Orbit mobile phone. Overall, the results illustrate that the participants were more satisfied with the iPhone device compare to the Orbit.
4.2
Mobile Google Apps
Overall result for using the Google apps can be seen in Table 3. Overall satisfaction was lower compared to those for the CoPilot app on Orbit. However, participants were more satisfied when using Google apps on the iPhone. The means were slightly higher for terminology, learning, impressions and mobile device compare to the CoPilot app. Participants were not satisfied with Google apps running on Orbit and they think that the application was not stimulating and was rigid.
Table 3: Measure for Mobile Google Apps
Google Apps
Satisfaction Measure iPhone O2 Orbit
Mean SD Mean SD
Overall Reactions 7.07 0.3011 4.87 0.9180
Screen 7.32 0.3633 4.00 1.2083
Terminology And Information 7.20 0.4320 5.16 0.9529
Learning 7.50 0.3830 6.12 1.1628
Application Capabilities 7.32 0.4147 5.68 1.0060 General Impressions 8.07 0.4163 4.00 0.6000 Mobile Device 7.66 0.6604 3.23 0.8519
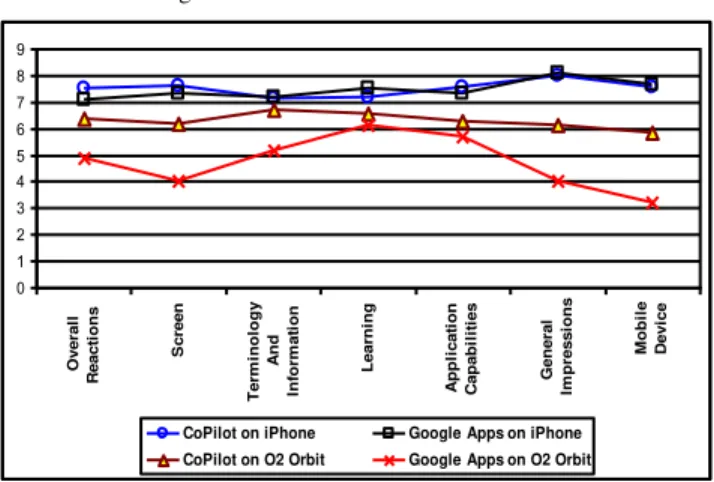
Three standard deviations for O2 orbit are slightly higher. One participant, with bigger finger size gave low scores for several satisfaction measures, for instance; virtual keypad, text size and touch screen. Novice users also gave low scores for use of the stylus for screen size and connection speed, whereas the other participants gave higher scores on these measures. We give an overview of all satisfaction measures for both platforms in figure 2 below.
Figure 2: Satisfaction for Both Devices
0 1 2 3 4 5 6 7 8 9 O v e ra ll R e a c ti on s S c re e n Te rm ino log y A nd Inf orm a ti on Le a rni ng A pp li c a ti on C a pa bi li ti e s G e ne ra l Im pre s s ion s M ob il e D e v ic e
CoPilot on iPhone Google Apps on iPhone CoPilot on O2 Orbit Google Apps on O2 Orbit
4.3
Interviews
Participants were interviewed after they had used each of the applications and had completed the questionnaire. Nvivo 8 was used to manage and analyze the interview data. We create four internal sources and twelve tree nodes base on usability measure develop by Hussain [13] and focus merely on subjective measures. Table 4 describes the feedback from participant on mobile application. Based on interview transcripts, we categorized the comments and feedback from participant into positive and negative feedback.
Table 4: Feedback from Participants
Application / Device Positive Feedback
Negative Feedback
Total Feedback
CoPilot / iPhone 19 5 24
CoPilot / Orbit 5 15 20
Google / iPhone 10 11 21
Google / Orbit 6 23 29
Almost all participants were very happy to use CoPilot inside iPhone except one participant who expressed dissatisfaction with the virtual keypad. All participants were unhappy with CoPilot on the Orbit mentioning screen size, touch screen, tiny virtual keypad and most
participants stated that overall they didn‟t enjoy using
CoPilot on the Orbit. For the Google apps on iPhone, interestingly we found a more equal balance of positive and negative feedback. Participants were unhappy using the virtual keypad on the iPhone and they noted that the keypad is too sensitive. Almost all participants gave positive feedback about the content. For Google apps on Orbit, all participants mentioned that the virtual keypad as
is too small and they don‟t like to use stylus. Some
participants still made mistakes while using the stylus and suggested a physical keypad for data entry would be preferable. Participants were also unhappy with the overall navigation and interface design and they suggested having one main menu for all sub-applications on Google apps. It appears that the features and capabilities of the mobile device strongly influence the user satisfaction with mobile applications. One participant stated that she will only use mobile apps if she has an iPhone. An additional factor given which would influence general use of mobile apps is price; not all the applications are free and the priciest application currently is a SatNav system.
5.
Conclusions
not too sensitive or responsive. Interface is a primary element to attract users, and we should consider aesthetically pleasing designs to make the application more appealing to users. In term of mobile devices, increasing the system speed will make sure system contents and the data can be loaded into mobile phone faster. The results suggest that larger screen size on mobile devices will make the user more likely to use and more satisfied with apps.
We have focused on subjective measures to evaluate apps running on mobile phones in this paper. Future work will focus on using a mixed method approach to examine whether subjective and objective measures correlate. It would also be advisable to examine a wider range of devices to examine the extent to which the quality of interaction is device rather than application dependent.
6.
References
[1] Nielsen, J.: „Usability Engineering‟ (Morgan Kaufmann,
1994)
[2] Cushman, W.H., and Rosenberg, D.J.: „Human Factors in
Product Design ‟ (Elsevier Science & Technology 1991.
[3] Rokou, T., Survey reveals growing airline demand for mobile application, Access: 2009
[4] Chittaro, L.: „Visualizing information on mobile devices‟,
Computer, 2006, 39, (3), pp. 40-45
[5] Leung, C.H., et al.: „Analysis of mobile commerce market in Hong Kong‟. Proc. Proceedings of the 5th international conference on Electronic commerce, Pittsburgh, Pennsylvania 2003.
[6] Scapin, D., and Law, E.: „Review, Report and Refine
Usability Evaluation Methods (R3 UEMs)‟: „Book Review, Report and Refine Usability Evaluation Methods (R3
UEMs)‟ 2007
[7] Ramsay, M., and Huntington, P.: „Mildly irritating: a WAP
usability study‟, Aslib Proceedings: new information perspectives, 2001, 53, pp. 141-158
[8] Condos, C., et al.: „Ten usability principles for the
development of effective WAP and m-commerce services‟, Aslib proceedings, 2002, 54, (6), pp. 345 - 355
[9] Jason, P., et al.: „Using while moving: HCI issues in
fieldwork environments‟, ACM Trans. Comput.-Hum.
Interact., 2000, 7, (3), pp. 417-437
[10]Maniar, N., et al.: „The Effect of Mobile Phone Screen Size
on Video Based Learning‟, JOURNAL OF SOFTWARE, 2008, 3, (4), pp. 51 - 61
[11]Findlater, L., and McGrenere, J.: „Impact of screen size on
performance, awareness, and user satisfaction with adaptive graphical user interfaces‟. Proc. Proceeding of the twenty-sixth annual SIGCHI conference on Human factors in computing systems, Florence, Italy 2008.
[12]Chin, J.P., et al.: „Development of an instrument measuring
user satisfaction of the human-computer interface‟. Proc. Proceedings of the SIGCHI conference on Human factors
in computing systems, Washington, D.C., United States 1988
[13]Hussain, A., and Kutar, M.: „Usability Metric Framework
for Mobile Phone Application‟. Proc. The 10th Annual Conference on the Convergence of Telecommunications, Networking & Broadcasting Liverpool, UK.
Azham Hussain is a lecturer at School of Computing, Universiti
Utara Malaysia. He received his PhD from University of Salford, UK in 2012. His research interest includes mobile development and evaluation, software development methods and mobile interaction. He has been involved in several researches under the Malaysian grant since 2002. He is a member of the British Computer Society (BCS) and internet society.