ISSN online: 1807-1775
DOI: 10.4301/S1807-17752017000200006
APP ADOPTION AND SWITCHING BEHAVIOR: APPLYING THE EXTENDED TAM IN SMARTPHONE APP USAGE
Subhadin Roy
Indian Institute of Management, Udaipur, India
ABSTRACT
The increasing use of mobile applications have been escalating with the increasing use of smartphones. In the present study, we examine (a) the adoption behavior of mobile apps using the extended TAM framework, and (b) whether adoption leads to subsequent use behavior and switching intentions. Based on data collected from two surveys in India we test the conceptual model of extended TAM and the effects of behavior on switching intentions using factor analysis and structural equation modeling. The major findings indicate a significant effect of most predictor variables on the perceived usefulness and perceived ease of use of apps. Further, we found a significant effect of behavioral intention on use behavior and subsequent switching intentions to apps from computers/laptops.
JISTEM USP www.jistem.fea.usp.br 1. INTRODUCTION
Escalating advances in information and communication technology has led to huge awareness for the mobile phones having extra features, generally known as smartphones (Hassan et al. 2014). Advances in technology has enabled mobile devices to have advanced computing ability and data connectivity through wireless services, such as Wi-Fi and 4G, which has led to the advent of the smartphones (Middleton, 2010). The increase in the smartphone consumers have resulted in the growth and rising use of mobile applications (apps) to meet the various needs of the consumer for any plausible purpose. Mobile applications (apps) are defined as “small programs that run on a mobile device and perform tasks ranging from banking to gaming and web browsing” (Taylor et al. 2011, p. 60). Mobile apps “cut through the clutter of domain name servers and uncalibrated information sources, taking the user straight to the content he or she already values” (Johnson, 2010, p. 24) as the consumer does not require to connect through an internet browser. Technically, mobile apps allow the users to perform specific tasks that can be installed and run on a range of portable digital devices such as smartphones and tablets (Liu, Au & Choi 2014). Mobile apps (which can be commercial or non-commercial) offer a wide range of services. For example, apps could be related to stock markets, sports, shopping, maps, banking, news, travel etc. In addition to informative usefulness, there are many apps that satisfy entertainment usefulness, such as game apps, social media (Facebook), and music. According to Accenture (2012), consumers assume that there should be an app for everything. In other words, everything should be “appified” (Hassan, et al. 2014). Apps provide customized and focused information services with the location awareness function. Apps are more user friendly, can be less expensive and easier to download and install compared to desktop applications (Taylor, Voelker, and Pentina 2011). Apps can satisfy both hedonic and utilitarian values depending on the app type and the usage need (Wang, Liao & Yang 2013).
Since both smartphones and apps are used with high levels of engagement, marketers have started to promote their brands via apps (Gupta 2013). During the last few years, mobile applications have become a fully-fledged market. Globally, users spend on an average,82% of their mobile minutes with apps and just 18% with web browsers (Gupta 2013).Marketers are utilizing the mobile apps for engage consumers in two-way interactions that enhance consumer loyalty and overall brand engagement (Chiem et al. 2010). Apps are considered as a novel channel of brand communication (Hutton & Rodnick 2009). Easy availability of apps represents a significant reason for consumers to make the switch from traditional PC and mobile phones to smartphones.
of communication and transaction (Bhattacharjee et al. 2011). From a theoretical perspective, a complete model of consumer adoption of apps (including antecedents theoretical) and its consequences would benefit the academia in marketing and IS research. This becomes important from the contextual value of testing of an IS theory in a different setting (in this case mobile apps) (Hong et al. 2014) that is important both for research and for solving problems at the managerial/practical level (Lee & Baskerville 2003).
Thus, the objective of the present study is to examine the adoption of mobile apps using the technology acceptance model framework (namely TAM3 of Venkatesh and Bala, 2008) and the subsequent effects of the main TAM constructs on behavioral and switching intentions. The rest of the paper is organized as follows: in the next section, we provide a brief literature review of TAM and its relevance in mobile app adoption leading to the research objectives. Subsequently, we discuss the research methodology and the major results. We follow this up with the discussions and the managerial implications before concluding the paper.
2. LITERATURE REVIEW
2.1 Technology Acceptance Model
A review of mobile marketing literature (Okazaki & Barwise 2011) showed Technology Acceptance Model (TAM) to be the most widely applied theory in recent studies. In this regard, Technology Acceptance Model (TAM) is a well-accepted theory for explaining the user’s intention to adopt technological innovations (Davis 1993).The adoption of technological products and services is explained by TAM and its extensions: TAM2 (Venkatesh & Davis 2000) and TAM 3 (Venkatesh & Bala 2008). The modifications to the original TAM have been necessitated by the constant development of new and more sophisticated IT devices (Nysveen et al. 2005). TAM suggests that perceived usefulness (PU) and perceived ease of use (PEU) are beliefs about a new technology that influence an individual's attitude toward and use of that technology (Davis et al. 1989). These beliefs influence the usage intentions, drive adoption and subsequent usage behavior. PU is defined as “the degree to which an individual believes that using a particular system would enhance his or her job performance” and PEU is defined as, “the degree to which an individual believes that using a particular system would be free of physical and mental effort” (Davis 1993). TAM researchers suggest that the adoption of mobile devices is influenced by both the perceived usefulness and ease of use, and the behavior and attitudes of the consumers’ social network (Lu, Yao & Yu 2005). TAM has been useful to various technologies (e.g. word processors, e-mail, WWW, Management Information Systems) in various situations (e.g., time and culture) with different control factors (e.g., gender, organizational type and size) and different subjects (e.g. undergraduate students, MBAs, and knowledge workers), leading its proponents to believe in its strength (Lee, Kozar & Larsen 2003).
JISTEM USP www.jistem.fea.usp.br
influence processes (Venkatesh & Bala, 2008). Compliance represents a situation in which an individual performs certain behavior in order to attain certain rewards or avoid punishment (Miniard & Cohen, 1979). Identification refers to an individual’s belief that performing a behavior will elevate his or her social status within a referent group because important referents believe the behavior should be performed (Venkatesh & Davis, 2000). Internalization is defined as the incorporation of a referent’s belief into one’s own belief structure (Warshaw, 1980). TAM2 hypothesizes that subjective norm and cognitive instruments influence perceived usefulness and behavioral intention that would further satisfy the users as they gain more experience with the technology. Venkatesh et al. (2003) synthesized these models into the unified theory of acceptance and use of technology (UTAUT). UTAUT integrated four key factors (i.e., performance expectancy, effort expectancy, social influence, and facilitating conditions) and four moderating variables (i.e., age, gender, experience, and voluntariness). All the eight factors were proposed to predict behavioral intentions to use a technology (and actual used) primarily in organizational context (Venkatesh, Davis & Morris 2007).
Subsequently, TAM3 was proposed as an advancement of TAM2 to enable the understanding of the role of interventions in technology adoption. TAM3 presents a complete nomological network of the determinants of individuals’ IT adoption and use (Venkatesh & Bala 2008). TAM3 posits that the effect of perceived ease of use on behavioral intention will diminish and the effect of perceived ease of use on perceived usefulness will increase with increasing experience with a technology (Venkatesh & Bala 2008).
2.2 TAM and Mobile Commerce
As an extension of e-commerce, mobile commerce (m-commerce) is considered a separate channel that can deliver value by offering convenience and accessibility anywhere, anytime (Balasubramanian et al. 2002; Koet al. 2009). The additional value created by mobile services for consumers is derived from being accessible independent of time and place (Balasubramanian et al. 2002; Chen & Nath 2004), and being customized based on time, location and personal profile (Figge 2004). Mobile devices provide advanced mobile services, including banking, commerce, shopping, games, information, thereby facilitating mobile commerce. The adoption of technological products and services (in connection with m-commerce) has been predominantly explained using TAM and its extensions. TAM has been used to predict the attitudes and behavior of users of mobile services, based on perceived usefulness (PU) and perceived ease of use (PEU) of mobile systems (Nicolas,Castillo & Bouwman 2008). For mobile services, researchers suggest that the consumers’ peers and the social network influence the adoption and use of both the device and the technology (Taylor, Voelker & Pentina 2011; Nicolas, Castillo & Bouwman 2008;Lu, Yao & Yu 2005). Therefore, further study of this relationship is required to determine the usefulness of TAM in customer adoption of mobile apps.
2.3 Mobile Commerce and Apps
either direct or indirect, with a monetary value implemented via a wireless telecommunication network (Barnes 2002). Apps offer variety of services that facilitate m-commerce as they can be used anytime and anywhere. Mobile apps enable consumers to take care of daily tasks as a consumer can use an app to make purchases, pay bill/ online transactions, locate stores, financial transactions, get driving directions/cabs, browse menus and reviews of local (and not-so-local) restaurants, thus facilitating M-commerce. The adoption rates of mobile apps are becoming increasingly critical in the business realm due to ease-of-use, quick access to specialized content and engaging functionality (Jones, 2014).In addition to representing an opportunity for advertising and branding, apps hold potential as a mobile commerce channel (Taylor, Voelker & Pentina 2011). It empowers shoppers with the ability to gather information on the spot from multiple sources, check on product availability, special offers and alter their selection at any point along the path to purchase (Lai, Debbarma & Ulhas 2012). Thus, the consumer shopping modality is quickly and decisively changing from traditional shopping and PC-based online shopping to mobile shopping (Ali et al. 2011; Butcher 2011) through various apps. Obviously, the rate of adoption of mobile devices as shopping platforms is impressive, outpacing the initial rate of adoption for personal computers as a shopping channel (Ali et al. 2011). Apps save time and effort of consumers as they can do the work anytime and from anywhere (apps reduces the need to be physically present at a place) without the hassle of logging to laptops/computers. Hence, marketers are embracing mobile apps as a platform for communication and consumer interaction as they are more cost efficient than traditional ads and may sometimes create entirely new revenue stream (Gupta 2013).
2.4 TAM and Mobile Apps
The obvious question that both the academic and the practitioners would be asking is, what drives a consumer to adopt an app? This becomes more important when the app is a commercial app unlike social media or free music apps as the stakes would be higher. This is where technology adoption (that includes personal and social factors) becomes important. Researchers suggest that the adoption of mobile devices is influenced by both the perceived usefulness and ease of use, and the behavior and attitudes of the consumers’ social network (Lu, Yao, & Yu 2005). For example, Shi (2009) investigated the factors influencing users’ intentions to adopt app and revealed that some factors such as enjoyment and facilitating conditions are significantly influencing users’ attitude and intention to use apps. In addition, Wu, Kang & Yang (2015) found perceived usefulness, self-efficacy, and peer influence to be the key determinants of users’ attitude toward and intention to purchase paid apps. In the context of mobile devices, social influence is important, as the adoption of these devices is often used to enhance the consumer’s sense of self-importance and social status (Sarker and Wells 2003).
3. JUSTIFICATION AND STUDY OBJECTIVE
JISTEM USP www.jistem.fea.usp.br
behavior of apps (which could be a very important factor of investigation, specifically for developing nations).
Earlier researchers (e.g. Rousseau & Fried 2001; Johns 2001) have considered context to be a sensitizing device that makes an individual more aware of the potential situational and temporal boundary conditions to theories. However, later researchers have opined that context is a critical driver of cognition, attitudes and behavior, or a moderator of relationships among such lower-level phenomena (Bamberger 2008; Whetten 2009). Thus, the generalizability of any theory in different settings is important both for research and for managing and solving practical problems in organizations (Lee & Baskerville 2003). Such “situation linking” makes the models more accurate and the interpretation of results more robust (Bamberger 2008). For example, in a study of information and communication technology implementation, Venkatesh et al. (2010) replicated the job characteristics model (JCM; Hackman & Oldham 1980) that was developed based on theory and data from western contexts, in the new context of a service organization in a developing country, i.e., a bank in India. Similarly we have replicated the TAM 3 model in mobile apps context under the settings of developing country i.e., India. An understanding of adoption behavior would also enable the marketer to understand the consumer better and devise strategies accordingly. Thus, there is both a theoretical and a managerial need for an in-depth study of the way adoption of apps is prevalent in young consumers.
The present study aims to investigate the adoption of commercial apps and its subsequent effect of use and switching behavior. The study draws from the fundamental constructs of TAM 3 (Venkatesh & Bala 2008) and introduces the same (with modifications) in the context of commercial mobile app adoption. The present study goes beyond TAM3 by including a switching behavior construct as a consequence of commercial app adoption. Thus, the present study has two objectives. First, it aims to explore the influence of the major technology adoption constructs (i.e. TAM3) on commercial app adoption. Second, it investigates the effect of adoption and use behavior on subsequent switching behavior. The model that summarizes the conceptual model tested in the study is given in figure 1.
4. RESEARCH METHODOLOGY
4.1 Measures
4.2 Data Collection
Subjective Norm
Image
Smartphone Self-Efficacy
Result Demonstrability
Output Quality Job Relevance
Smartphone Anxiety Perceptions of External Control
Smartphone Playfulness
Perceived Enjoyment
Perceived Usefulness
Perceived Ease of Use
Behavioral Intention
Use Behavior
Switching Intention
Original TAM
In study 2, a new sample of 300 students were selected in phase 2 and randomly divided into three groups. The screening criterion used was that the participant should not have a commercial app already installed in his/her smartphone. Each group was then asked to install either a) a banking app; b) a travel booking app; and c) fashion shopping app (names of apps given to the participants a priori).The participants were instructed to use the app for a fortnight (as per their convenience). The survey was conducted on the 15th day. The questionnaire included use behavior
and switching intention questions (along with TAM3 questions) in this phase (total scale items in questionnaire = 55). Thus, all 15 study constructs were measured in study 2. In study 2, the usable questions received were 281 (average age 27, male female ratio around 55:45).
5. RESULTS
Study 1: Exploratory Factor Analysis, Confirmatory factor Analysis and Construct Validation
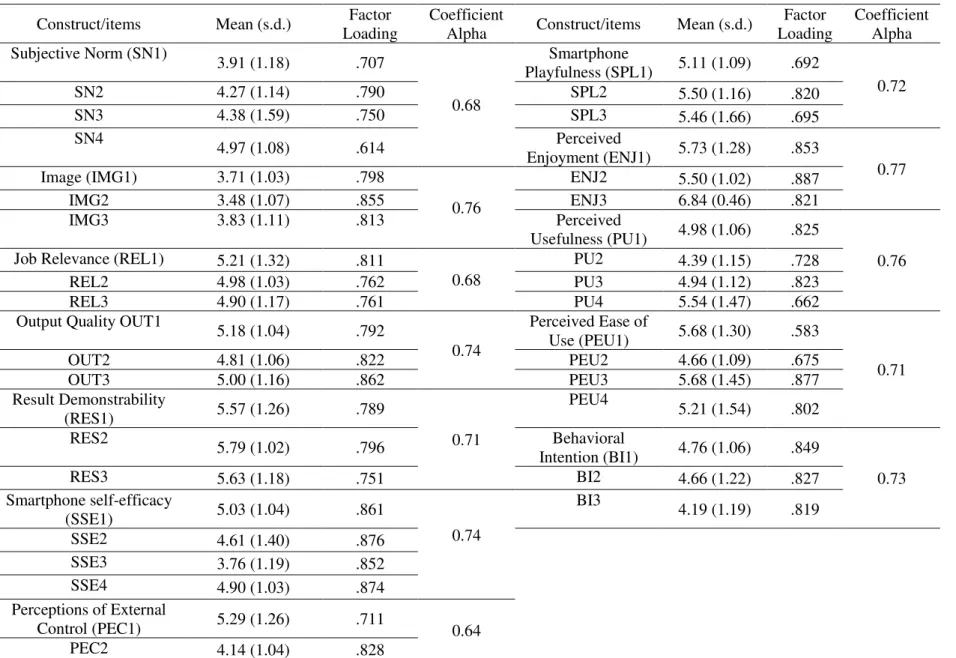
Researchers recommend exploratory factor analysis (EFA) as a precursor to confirmatory analysis of measurement items since it provides an initial overview of the latent variables and helps in identifying redundant items (Netemeyer, Bearden, & Sharma 2003; Lewis, Templeton, & Byrd 2005). Thereby, EFA helps to measure ‘purification’ (Churchill, 1979), and allows a researcher to delete, add or modify measurement items based on the results (Smith, Milberg, & Burke, 1996). Even though we selected established measures of adoption and use behavior, we first conducted an exploratory factor analysis (EFA) to ensure that the dimensional structure of the study constructs were similar to those found in erstwhile literature. This was done to ensure that the nature of the constructs (as measured by the items) was perceived in the same way in India that they are in western countries. Researchers have hinted that measures developed in a specific cultural context may not hold true for a different culture and thus applying scales developed in a specific culture may suffer from an etic or pseudo etic trap while being used in another context (Craig & Douglas, 2000; Ford, West and Sargeant 2015).
Table 1. Study 1: EFA Table
Construct/items Mean (s.d.) Factor Loading
Coefficient
Alpha Construct/items Mean (s.d.)
Factor Loading
Coefficient Alpha Subjective Norm (SN1)
3.91 (1.18) .707
0.68
Smartphone
Playfulness (SPL1) 5.11 (1.09) .692
0.72
SN2 4.27 (1.14) .790 SPL2 5.50 (1.16) .820
SN3 4.38 (1.59) .750 SPL3 5.46 (1.66) .695
SN4
4.97 (1.08) .614 Perceived
Enjoyment (ENJ1) 5.73 (1.28) .853
0.77 Image (IMG1) 3.71 (1.03) .798
0.76
ENJ2 5.50 (1.02) .887
IMG2 3.48 (1.07) .855 ENJ3 6.84 (0.46) .821
IMG3 3.83 (1.11) .813 Perceived
Usefulness (PU1) 4.98 (1.06) .825
0.76 Job Relevance (REL1) 5.21 (1.32) .811
0.68
PU2 4.39 (1.15) .728
REL2 4.98 (1.03) .762 PU3 4.94 (1.12) .823
REL3 4.90 (1.17) .761 PU4 5.54 (1.47) .662
Output Quality OUT1
5.18 (1.04) .792
0.74
Perceived Ease of
Use (PEU1) 5.68 (1.30) .583
0.71
OUT2 4.81 (1.06) .822 PEU2 4.66 (1.09) .675
OUT3 5.00 (1.16) .862 PEU3 5.68 (1.45) .877
Result Demonstrability
(RES1) 5.57 (1.26) .789
0.71
PEU4
5.21 (1.54) .802 RES2
5.79 (1.02) .796 Behavioral
Intention (BI1) 4.76 (1.06) .849
0.73
RES3 5.63 (1.18) .751 BI2 4.66 (1.22) .827
Smartphone self-efficacy
(SSE1) 5.03 (1.04) .861
0.74
BI3
4.19 (1.19) .819 SSE2 4.61 (1.40) .876
SSE3 3.76 (1.19) .852 SSE4 4.90 (1.03) .874 Perceptions of External
PEC3 5.39 (1.17) .711 Smartphone Anxiety
(SNX1) 2.89 (2.02) .614
0.68 SNX2 2.65 (1.13) .794
JISTEM USP www.jistem.fea.usp.br
EFA does not allow detailed tests for convergent and discriminant validity of sub-constructs of a scale (Hair et al., 2008). Thus, we further analyzed the data using confirmatory factor analysis (CFA) using maximum likelihood as the method of estimation using Amos 20. Scale development papers (Churchill, 1979) suggest a fresh dataset for conducting CFA. However, we used the same data for two reasons: a) we used scales that were already validated and found to have face validity for the Indian audience; and b) our study objective was exploration and not measure development.
Each sub-dimension (the thirteen first order factors) was first tested using independent measurement models that yielded satisfactory fit statistics. Subsequently, we ran a complete measurement model with all first order constructs (FOC) correlated to each other. The model displayed good fit (Chi square/df= 2.5; GFI=0.94; AGFI=0.91; NFI=0.94; CFI = 0.93; RMR = 0.06; RMSEA = 0.07) calibrations did not reveal any high modification index (above 6) and thus, all 44 items were retained in the solution. The standardized factor loadings for the items displayed statistically significant t values (Table 2). The Average Variance Extracted (AVE) for all FOCs was above 0.6 as per standard cut-offs suggested by researchers (Hair et al., 2008) and all factors displayed adequate construct reliability through composite reliability (CR)/Joreskog’s Rho coefficients above 0.7 as per guidelines proposed by Chin (1998) (Table 2). Thus, the convergent validity of the thirteen FOCs of our conceptual model was established.
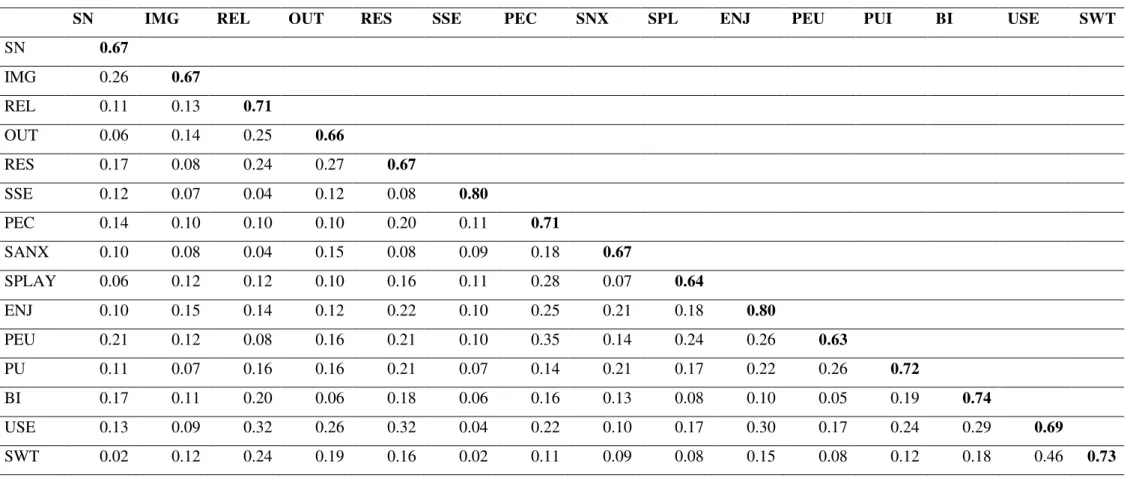
To test for discriminant validity, the squared inter-factor correlations between each factor were compared with the AVE values of each construct (as per the approach suggested by Fornell & Larcker 1981). The diagonal values of the AVE’s were larger than the non-diagonal values of the squared inter construct correlations and thus discriminant validity was achieved.
Table 2. Study 1: CFA Results and Construct Reliability Measures
Construct/Items Std.
Loading t Value p
Subjective Norm(CR=0.90, AVE=0.67, α =0.66)
People who influence my behavior think that I should use APPs 0.85 4.23 < .001 People who are important to me think that I should use APPs 0.82 4.46 < .001 My peers/tech experts have been helpful in my learning of the use of APPs 0.79 4.70 < .001 In general, my social/ college environment has supported the use of APPs 0.81
Image (CR=0.86, AVE=0.67, α =0.71)
People in my college/social circle who use APPs have more prestige than
People in my college/social circle who use APPs have a high profile 0.89 5.36 < .001 Having the latest APPs is a status symbol in my college/social circle 0.86
Task Relevance(CR=0.89, AVE=0.71, α =0.73)
In my daily activities, usage of APPs is important 0.91 5.99 < .001 In my daily activities, usage of APPs is relevant 0.89 7.12 < .001 The use of APPs is pertinent to my various daily activities 0.73
Output Quality(CR=0.84 , AVE=0.66, α =0.77)
The quality of the output/help I get from APPs is high 0.85 7.87 < .001
I have no problem with the quality of the APP’s output 0.82 6.83 < .001
I rate the results from the APPs to be excellent 0.75
Result Demonstrability (CR=0.86, AVE=0.67, α =0.74)
I have no difficulty telling others about the results of using the APPs 0.83 4.13 < .001 I believe I could communicate to others the benefits of using the APPs 0.86 4.17 < .001 The results of using the APPs are clear to me 0.76
Smartphone self-efficacy (CR=0.94, AVE=0.80, α =0.73) (I am able to complete a job/activity using an APP …
. . .evenif there was no one around to tell me what to do 0.91 5.35 < .001
. . . even if I had just the built-in help facility for assistance. 0.88 4.44 < .001
. .. onlyif someone showed me how to do it first 0.92 3.33 < .01
. . .onlyif I had used similar App/software before this one to do the same
JISTEM USP www.jistem.fea.usp.br
I have control over using the APP 0.83 3.06 < .01 I have the resources necessary to use the APP 0.87 3.32 < .01 Given the resources, opportunities and knowledge it takes to use the APP,
it would be easy for me to use the APP 0.83
Smartphone Anxiety (CR=0.89, AVE=0.67, α =0.71)
Smartphone Apps do not scare me at all 0.73 2.77 < .01 Working with a Smartphone App makes me nervous 0.82 4.16 < .001 Smartphone Apps make me feel uncomfortable 0.85 4.09 < .001 Smartphone Apps make me feel uneasy 0.86
Smartphone Playfulness (CR=0.84, AVE=0.64, α =0.72) (how you would characterize yourself when you use an App)
. . . spontaneous 0.76 4.75 < .001
. . . creative 0.84 6.51 < .001
. . . playful 0.81
Perceived Enjoyment (CR=0.92, AVE=0.80, α =0.82)
I find using APPs to be enjoyable. 0.89 7.42 < .001 The actual process of using APP is pleasant. 0.92 7.08 < .001
I have fun using APPs. 0.88
Perceived Usefulness (CR=0.88, AVE=0.63, α =0.79)
Perceived Ease of Use (CR=0.91, AVE=0.72, α =0.73)
My interaction with the APP is clear and understandable. 0.76 3.62 < .01 Interacting with the APP does not require a lot of my mental effort. 0.83 5.19 < .001 I find the APP to be easy to use. 0.97 6.93 < .001 I find it easy to get the APP to do what I want it to do. 0.82
Behavioral Intention (CR=0.90, AVE=0.74, α =0.69)
Assuming I had access to the APP, I intend to use it. 0.89 4.45 < .001 Given that I had access to the APP, I predict that I would use it. 0.84 6.00 < .001 I plan to use the APP till it becomes out-dated. 0.86
Use Behaviour (CR=0.86, AVE=0.69, α =0.81)
I am likely to use smartphone APPs for various commercial activities in
the near future. 0.79 5.64 < .001
I am likely to use smartphone APPs to shop for products and services in
the near future. 0.83 5.53 < .001
I am likely to use smartphone APPs for entertainment services in the near
future. 0.85
Switching Intention (CR=0.89, AVE=0.73, α =0.80)
It is likely that I would use smartphone APPs instead of a computer/laptop
for my commercial needs in the near future. 0.89 2.78 < .01 It is likely that I would use smartphone APPs instead of a computer/laptop
for my product/service needs in the near future. 0.82 3.21 < .01 It is likely that I would use smartphone APPs instead of a computer/laptop
for my entertainment needs in near future 0.85
JISTEM USP www.jistem.fea.usp.br Study 2: Validation of the Conceptual Model
In study 2, the conceptual model (Figure 1) containing the antecedents of app adoption and its consequences was estimated using structural equation modelling. Thus, the questions in study 2 included items on behavioral intention and switching behavior. We first conducted EFA for the use behavior and switching constructs (with factor loadings above 0.7 for a two factor solution with three items each for use behavior and switching intention). Before running the complete model, we first conducted tests for the complete measurement models for the 15 study constructs. The measurement model yielded a good fit (Chi square/df= 1.8; GFI=0.92; AGFI=0.89; NFI=0.92; CFI= 0.91; RMR= 0.05; RMSEA= 0.06) and the standardized loadings of the first 13 constructs were found significant and similar to the values in study 1. The two new constructs in study 2 were also found to have significant standardized loading and high AVE values (Table 2, last eight rows). We conducted a discriminant validity test for the study 2 constructs similar to that in study 1 and the AVE values for all study constructs were found to be higher than their respective squared correlations (Table 3).
Table 3. Study 2: Discriminant Validity Test Results
SN IMG REL OUT RES SSE PEC SNX SPL ENJ PEU PUI BI USE SWT
SN 0.67
IMG 0.26 0.67
REL 0.11 0.13 0.71
OUT 0.06 0.14 0.25 0.66
RES 0.17 0.08 0.24 0.27 0.67
SSE 0.12 0.07 0.04 0.12 0.08 0.80
PEC 0.14 0.10 0.10 0.10 0.20 0.11 0.71
SANX 0.10 0.08 0.04 0.15 0.08 0.09 0.18 0.67
SPLAY 0.06 0.12 0.12 0.10 0.16 0.11 0.28 0.07 0.64
ENJ 0.10 0.15 0.14 0.12 0.22 0.10 0.25 0.21 0.18 0.80
PEU 0.21 0.12 0.08 0.16 0.21 0.10 0.35 0.14 0.24 0.26 0.63
PU 0.11 0.07 0.16 0.16 0.21 0.07 0.14 0.21 0.17 0.22 0.26 0.72
BI 0.17 0.11 0.20 0.06 0.18 0.06 0.16 0.13 0.08 0.10 0.05 0.19 0.74
USE 0.13 0.09 0.32 0.26 0.32 0.04 0.22 0.10 0.17 0.30 0.17 0.24 0.29 0.69
JISTEM USP www.jistem.fea.usp.br
Table 4. Study 2. SEM results
Exogenous Variable Endogenous Variable Std.
Estimate S.E. P Subjective Norm (SN) Image (IMG) (R2=0.25) 0.50 0.061 <0.001
Subjective Norm (SN)
Perceived Usefulness (PU) (R2=0.28)
0.14 0.053 .017
Image (IMG) 0.09 0.053 .099
Task Relevance (REL) 0.10 0.062 .089
Output Quality (OUT) 0.05 0.042 .372
Result Demonstrability (RES) 0.17 0.081 .008 Perceived Ease of Use (PEU) 0.22 0.051 <.001
REL X OUT 0.54 0.012 <0.001
Smartphone Self Efficacy (SSE)
Perceived Ease of Use (PEU) (R2=0.45)
0.19 0.057 .024
Perceptions of External Control
(PEC) 0.34 0.061 <0.001
Smartphone Anxiety (SNX) -0.16 0.054 .001 Smartphone Playfulness (SPL) 0.18 0.072 <0.001 Perceived Enjoyment (ENJ) 0.16 0.055 .003
Perceived Usefulness (PU)
Behavioral Intention (BI) (R2=0.27)
0.28 0.056 <0.001 Perceived Ease of Use (PEU) 0.18 0.057 .002
Behavioral Intention (BI) Use Behavior (USE) (R2=0.13) 0.27 0.046 <0.001
Use Behavior (USE) Switching Intention (R2=0.27) 0.19 0.052 .015
6. DISCUSSION
The adoption rates of mobile apps are becoming increasingly critical in the business realm due to ease-of-use, quick access to specialized content and engaging functionality (Kimberley, 2014). In this regard, the present study contributes to both the theory and practice of mobile app use behavior. The present study tests a theoretical model that explains the adoption of mobile applications. The model comprised of fifteen factors with three of them (viz. behavioral intention, use behavior and switching intention) as the outcomes of mobile app adoption. This research complements existing adoption studies in the field of mobile marketing by examining a specific perspective of mobile marketing, namely mobile apps adoption.
The present study adds a relevant and a novel contribution to the field of technology acceptance by extending the TAM theory to smartphone apps. It is expected that a technology will be adopted more rapidly if it has technological compatibility and ease of adoption (Benedetto, Calantone, & Zhang, 2003). The present study supports this fact through the findings that perceived usefulness and perceived ease of use leads to app adoption. It has been observed that information and entertainment usefulness of app affects smartphone users’ attitudes toward mobile apps usage. Thereby, it extends and validates the TAM3 (Venkatesh and Bala 2008) in the context of smartphone apps. Image, task relevance and output quality were not found to have significant effects on Perceived Usefulness. Image may not necessarily have an effect on app usage since app usage is an individual choice and it may not matter what other think. Though task relevance and output quality did not have significant direct effects, the significant indirect effect implies that in case an app is required, it is used and at that time, the quality has an influence on adoption. All behavioral variables such as smartphone self-efficacy; perceived external control and smartphone anxiety were found to affect perceived ease of use. This supports the need to include consumer’s cognitive and conative components in a technology acceptance model (Venkatesh & Bala 2008).
7. MANAGERIAL IMPLICATIONS
For mobile app marketers, our findings imply that mobile app users require appropriate combination of information and entertainment i.e., both information and entertainment usefulness positively affect smartphone users’ mobile app adoption. The study sheds light on the determinants of smartphones apps among the users by highlighting the role of the extended technology adoption model. The finding of perceived usefulness and perceived ease of use on smartphone app usage intention supports the applicability of TAM in mobile apps and suggests that perceived usefulness is more important than ease of use. The study design allowed the measurement of usage behavior ex-post and the findings imply that smartphone users may start using commercial mobile apps if they find it useful and easy to use. This may subsequently result in a switch from laptop and PC based commercial activities to smartphone apps. Thus, it becomes important for a manager to convey the usefulness and ease of use of apps that can subsequently influence adoption. However, the marketer should also be aware of the consumer psyche (such as level of smartphone anxiety) so that they can reduce/increase the effects of the same to increase adoption. Managers can take advantage from our results to design and market apps so as to attract user’s attention and affection and formulate affective marketing strategies.
8. LIMITATIONS
JISTEM USP www.jistem.fea.usp.br
data from different markets. Such a comparative study would increase generalizability of the present study and bring out contrasting results (if they exist). Second, we had young and young adults as the respondents who are known to be technology ready. Thus, a future study could address whether the same results would hold good for aged audience or even those with low technology readiness. Third, we did not include the issue of privacy affecting use and switching behavior (as our focus was on TAM). However, privacy is gaining importance as an influencer of mobile commerce use and thus its inclusion as a moderator in the same model could provide interesting findings. In spite of the limitations, the novelty of the study lies in its application of a tested framework (TAM) in a new mobile phone usage phenomenon and the findings generated provide thoughts to ponder for academicians and marketers.
REFERENCES
Accenture. (2012). Always On, Always Connected – Finding Growth Opportunities in an Era of
Hypermobile Consumers, Retrieved from
http://www.accenture.com/SiteCollectionDocuments/PDF/Accenture_EHT_Research_20 12_Consumer_Technology_Report.pdf (accessed on February 13, 2016).
Ali, A., Wong, E., Meeker, G. & Gill, D. (2011). The Mobile Shopping Framework Study: The Role of
Mobile Devices in the Shopping Process, Retrieved from
http://advertising.yahoo.com/industry-knowledge/mobile-shopping-insight.html (accessed on February 13, 2016).
Balasubramanian, S., Peterson, R.A. & Jarvenpaa, S.L. (2002). Exploring the implications of m-commerce for markets and marketing. Journal of the Academy of Marketing Science, 30(4), 348– 361.
Bamberger, P.A. (2008). Beyond contextualization: Using context in theories to narrow the micro– macro gap in management research. Academy of Management Journal, 51(5), 839–846.
Barnes, S.J. (2002). The mobile commerce value chain: Analysis and future developments.
International Journal of Information Management, 2(2), 91–108.
Benedetto, C. A., Calantone, R. J. & Zhang, C. (2003). International technology transfer model and
exploratory study in the People’s Republic of China. International Marketing Review, 20(4),
446-462.
Bhattacharjee, S., Gopal, R. D., Marsden, J. R. & Sankaranarayanan, R. (2011). Digital goods and markets: Emerging issues and challenges. ,ACM Transactions on Management Information Systems. 2 (2), article 8.
Butcher, D. (2011). Half of us Consumers Shop with Mobile Devices: Study, Retrieved from http://www.mobilecommercedaily.com/2011/04/20/half-of-us-consumers-shop-withmobile-devices-study (accessed on February 13, 2016).
Chen, L.D. & Nath, R. (2004). A framework for mobile business applications. International. Journal
of Mobile Communication, 2 (4), 368–381.
Chiem, R., Arriola, J., Browers, D., Gross, J., Limman, E., Nguyen, P.V., Sembodo, D., Young, S. & Seal, K.C. (2010). The critical success factors for marketing with downloadable applications: Lessons learned from selected European countries. International Journal of Mobile Marketing, 5 (2), 43-56.
Chin, W. W. (1998). The partial least squares approach for structural equation modeling. In N.J. Mahwah, & G. A. Marcoulides, (Eds.), Modern Methods for Business Research, pp.295– 336).Lawrence Erlbaum Associates, New York, NY.
Churchill, G. A. Jr. (1979). A paradigm for developing better measures of marketing constructs. Journal
Craig, C. & Douglas, S. (2012). International advertising research: Conceptual and methodological issues. In S.Okazaki, (Ed.), Handbook of Research on International Advertising, (pp.201-231). Edward Elgar, Northampton.
Davis, F. D. (1993). User acceptance of information technology: System characteristics, user perception and behavioral impact. ,International Journal of Man-Machine Studies, 38, 475–487.
Davis, F.D., Bagozzi, R.P. & Warshaw, P.R. (1989). User acceptance of computer technology: A comparison of two theoretical models. Management Science, 35(8), 982-1003.
Figge, S. (2004). Situation-dependent services: A challenge for mobile network operators. Journal
Business Research, 57 (12),1416–1422.
Ford, J., West, D. & Sargeant, A. (2015). Emic and etic cross-cultural scale development. In Dato, M. Conway (Ed.), The Sustainable Global Marketplace, (pp. 387).Springer, NYC.
Fornell, C. and Larcker, D. F. (1981). Evaluating structural equation models with unobservable variables and measurement error. Journal of Marketing Research, 18(1), 39-50.
Gupta, S. (March 2013). For mobile devices, think apps not ads. Harvard Business Review, 71-75. Hackman, J.R., & Oldham G.R. (1980). Work Redesign, Reading, MA, Addison-Wesley.
Hair, J.F., Anderson, R.E., Tatham, R.L. & Black, W.C.(2008), Multivariate Data Analysis, Prentice Hall, Upper Saddle River, New Jersey.
Hampton, K. N., Goulet, L. S., Rainie, L. & Purcell, K. (June 16, 2011), “Social networking sites and
our lives”,PEW Research Internet Project, Retrieved from
http://www.pewinternet.org/Reports/2011/Technology-and-socialnetworks (accessed January 24, 2016).
Hassan, M., Kouser, R., Abbas, S. S. & Azeem, M. (2014). Consumer attitudes and intentions to adopt smartphone apps: Case of business students. Pakistan Journal of Commerce and Social Sciences, 8 (3), 763-779.
Hayes, A. F. (2015). An index and test of linear moderated mediation. Multivariate Behavioral Research, 50(1), 1-22.
Hayes, A. F. & Agler, R. A.(2014). On the standard error of the difference between independent regression coefficients in moderation analysis. Multiple Linear Regression Viewpoints, 4(2), 16-27. Heinonen, K., & Strandvik, T. (2007). Consumer responsiveness to mobile marketing. International
Journal of Mobile Communications, 5 (6), 603-617.
Hoehle, H. & Venkatesh, V. (2015). Mobile application usability: Conceptualization and instrument development. MIS Quarterly, 39 (2), 435-472.
Hong, W., Chan, F.K.Y., Thong, J.Y.L., Chasalow, L.C. & Dhillon, G. (2013). A framework and guidelines for context-specific theorizing in information systems research. Information Systems
Research, 25 (1), 111-136.
Hutton, G., McCann, U. & Rodnick, S. ( 2009). Smartphone opens up new opportunities for smart marketing. Admap, 44, (11), 22–24.
Johns, G. (2006). The essential impact of context on organizational behavior. Academy of Management Review, 31(2), 386–408.
Johns, G.(2001). In praise of context. Journal of Organizational Behavior, 22 (1), 31-42.
Johnson, R. (2010). Apps culture reinventing mobile internet. Electronic Engineering Times, 1588, 24-30.
JISTEM USP www.jistem.fea.usp.br
Kline, R.B. (2011). Convergence of structural equation modeling and multilevel modeling. In M. Williams, and W.P. Vogt (Eds.), Handbook of Methodological Innovation in Social Research
Methods, 562-589.Sage, London.
Ko, E., Kim, E.Y. and Lee, E.K. (2009). Modeling consumer adoption of mobile shopping for fashion products in Korea. Psychology & marketing, 26 (7), 669–687.
Lai, Jung-Yu., Debbarma, S. & Ulhas, K.R. (2012). An empirical study of consumer switching behaviour towards mobile shopping. International Journal Mobile Communications, 10 (4), 386-404.
Lee, A.S., & Baskerville, R.L. (2003). Generalizing generalizability in information systems research.
Information Systems Research, 14 (3), 221–243.
Lee, G., & Raghu, T. S. (2014). Determinants of mobile apps' success: Evidence from the app store market. Journal of Management Information Systems, 31 (2), 133-170.
Lee, Y., Kozar, K. A. & Larsen, K. R. (2003). The technology acceptance model: Past, present, and future. Communications of the Association for Information Systems, 12 (1), 752-780.
Lewis, B. R., Templeton, G. F. & Byrd, T. A. (2005). A methodology for construct development in MIS research. European Journal of Information Systems, 14 (4), 388-400.
Liu, C. Z., Au,Y. A. & Choi, H. S. (2014). Effects of freemium strategy in the mobile app market: An empirical study of google play. Journal of Management Information Systems, 31(3), 326–354. López-Nicolás, C., Molina-Castillo, F. J. & Bouwman, H. (2008). An assessment of advanced mobile
services acceptance: Contributions from TAM and diffusion theory models. Information &
Management, 45,359–364.
Lu,J., Yao, J. E. & Yu, C.S. (2005). Personal innovativeness, social influences and adoption of wireless internet services via mobile technology. The Journal of Strategic Information Systems, 14(3), 245- 268.
Middleton, C. (2010). Delivering services over next generation broadband networks: Exploring devices, applications and networks. Telecommunications Journal of Australia, 60(59), 1-59.
Miniard, P.W. & Cohen, J. B. (1979). Isolating attitudinal and normative influences in behavioral intention models. Journal of Marketing Research, 16(1), 102–110.
Netemeyer, R. G., Bearden, W. O. & Sharma, S. (2003). Scaling procedures: Issues and applications, Sage Publications, London.
Nysveen, H., Pedersen, P. & Thorbjornsen, H. (2005). Explaining intention to use mobile chat services: Moderating effects of gender. Journal of Consumer Marketing, 22 (5),. 247–256.
Okazaki, S. & Barwise, P. (2011). Has the time finally come for the medium of the future? Journal of
Advertising Research, 51 (1), 59-71.
Rousseau, D.M., & Fried. Y. (2001). Location, location, location: Contextualizing organizational research. Journal of Organisational Behaviour, 22 (1), 1–13.
Sarker, S., & Wells, J. P. (2003). Understanding mobile handheld device use and adoption.
Communications of the ACM, 46 (12), 35-40.
Shi, W. (2009). An empirical research on users’ acceptance of smart phone online application software.
International Conference on Electronic Commerce and Business Intelligence, 106-110.
Smith, H., Milberg, S. and Burke, S. (1996). Information privacy: Measuring individuals' concerns about organizational practices. MIS Quarterly, 20 (2), 167-196.
Venkatesh, V. & Bala, H. (2008). Technology acceptance model 3 and a research agenda on interventions. Decision Sciences, 39 (2), 273-315.
Venkatesh, V., Bala, H. & Sykes, T.A. (2010). Impacts of information and communication technology
implementations on employees’ jobs in service organizations in India: A multi-method longitudinal
field study. Production and Operations Management, 19(5), 591–613.
Venkatesh, V., Morris, M. G., Davis, G. B. & Davis, F. D. (2003). User acceptance of information technology: Toward a unified view. MIS Quarterly, 27 (3), 425-478.
Venkatesh, V., Thong, J. Y. L. & Xu, X. (2016). Unified theory of acceptance and use of technology: A synthesis and the road ahead. Journal of the Association for Information Systems, 17 (5), 328-376. Venkatesh, V., Fred D. Davis, & Michael G. Morris. (2007). Dead or alive? The development, trajectory and future of technology adoption research. Journal of the Association for Information System, 8 (4), 267.
Venkatesh, V. & Davis, F.D. (2000). A theoretical extension of the technology acceptance model: Four longitudinal field studies. Management Science, 46(2), 186–204.
Walsh, S. P., White, K.M., Cox, S. & Young, R.M. (2011). Keeping in constant touch: The predictors
of young Australians’ mobile phone involvement. Computers in Human Behavior, 27 (1), 333–342.
Wang, H-Y., Liao, C. & Yang, L-H. (2013). What affects mobile application use? The roles of consumption values. International Journal of Marketing Studies, 5 (2), 11-22.
Warshaw, P. R. (1980). A new model for predicting behavioral intentions: An alternative to Fishbein.
Journal of Marketing Research, 17 (2), 153–172.
Whetten, D.A. (2009). An examination of the interface between context and theory applied to the study of Chinese organizations. Management and Organization Review, 5(1), 29-55.