499
COMPARISON OF ECG SIGNAL DENOISING ALGORITHMS IN EMD
AND WAVELET DOMAINS
Md. Ashfanoor Kabir & Celia Shahnaz Department of Electrical and Electronic Engineering, Bangladesh University of Engineering and Technology
Dhaka, Bangladesh
E-mail: [email protected]; [email protected] ABSTRACT
This paper presents a detail analysis on the Electrocardiogram (ECG) denoising approaches based on noise reduction algorithms in Empirical Mode Decomposition (EMD) and Discrete Wavelet Transform (DWT) domains. Compared to other denoising methods such as; filtering, independent and principle component analysis, neural networks, and adaptive filtering, EMD and wavelet domain denoising algorithms are found more effective in the reduction of noise from the ECG signal. Denoising methods in EMD domain depends on the number of intrinsic mode functions (IMFs) to be discarded or noise compensated and that in wavelet domain rely on the number of decomposition levels as well as selection of threshold value for each level. This paper provides the performance analyses of ECG signal denoising algorithms in EMD and wavelet domains thus comparing there effectiveness in reducing the noise. For analyses purpose, extensive simulations are carried out using the MIT-BIH database and the performances are evaluated in terms of standard metrics namely, SNR improvement in dB, Mean Square Error (MSE) and Percent Root Mean Square Difference (PRD). Results show that denoising schemes involving both EMD and wavelet domains are able to reduce noise from ECG signals more accurately and consistently in comparison to noise reduction algorithms in EMD or wavelet domain alone.
keywords:QRS complex, EMD, Wavelet, ECG Denoising, SNR. 1. INTRODUCTION
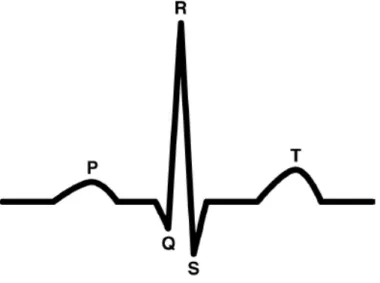
ECG signals are oscillatory and periodic in nature. A complete ECG beat is shown in Fig.1. It can be seen from Fig. 1 that the ECG beat has a distinct, characteristic shape. ECG is a very important biological signal to diagnose cardiac arrhythmia. Usually ECG signals are subjected to contamination by various noises. The sources of noise may be either cardiac or extracardiac. Reduction or disappearance of the isoelectric interval, prolonged repolarization and atrial flutter are responsible for cardiac noise, whereas respiration, changes of electrode position, muscle contraction, and power line interference cause extracardiac noise [9], [19].
500
Numerous methods have been reported to denoise ECG signals based on filter banks, principal component analysis (PCA), independent component analysis (ICA), neural networks (NNs), adaptive filtering, empirical mode decomposition (EMD), and wavelet transform [24]-[5]. The filter bank based denoising process smoothes the P and R amplitude of the ECG signal, and it is more sensitive to different levels of noise [22]. By exploiting PCA or ICA or NNs, a statistical model of the ECG signal and noise is first extracted and then, the in-band noise is removed by discarding the dimensions corresponding to the noise [8]-[34]. Although PCA, ICA and NNs based schemes are powerful for in-band noise filtering, the statistical model derived therein is not only fairly arbitrary but also extremely sensitive to small changes in either the signal or the noise unless the basis functions are trained on a global set of ECG beat types. In particular, one of the difficulties with the application of ICA is the determination of the order of the independent components (ICs). Thus for further processing, visual inspection is required, which is undesirable in routine clinical ECG analysis [35]. The limitations of the adaptive filtering based ECG denoising lies in the fact that a reference signal has to be additionally recorded together with the ECG [36].
Comparatively, the denoising methods based on EMD and that based on wavelet are found more effective in reducing noise from the ECG signals. Since, ECG signals are relatively weak and may have strong background noises, the thresholding performed in either EMD or wavelet domain alone will result in an inadequate denoising as far as reliable clinical applications are concerned [15]. To reduce noise further from ECG signals, methods incorporating noise reduction algorithms in both EMD and wavelet domains have been reported in [15] and [14]. In [15], an EMD-wavelet based denoising method is presented, in which the QRS complex of the ECG signal embedded in the first few IMFs consisting of high frequency noise is subject to thresholding in wavelet domain. As a result, the thresholding technique cannot distinguish between high frequency noise and the QRS information. In [14], the authors presented an ECG denoising method employing noise reduction algorithms in EMD and wavelet domains that is capable of overcoming the limitations of the existing methods. Here, in order to preserve the QRS information in the presence of noise, the noisy ECG signal is first enhanced in the EMD domain by a windowing operation. Then, the ECG signal with a relatively reduced noise is transformed in the wavelet domain. Finally, an adaptive thresholding scheme is employed to the wavelet coefficients prior to reconstructing a cleaner ECG signal. The method proposed in [14] provides a better donoising performance for the ECG signals at different levels of SNR in comparison to that of the other state-of-the-art methods.
The performance of the methods under consideration has been verified using the MIT-BIH arrhythmia database employing standard metrics like, SNR improvement in dB, Mean Square Error (MSE) and Percent Root Mean Square Difference (PRD). The results attest that the methods involving both EMD and wavelet domains perform better denoising of ECG signals compared to the methods involving merely EMD or wavelet domain based denoising. This paper is organized as follows. A brief background of the use of EMD in ECG denoising is presented in section 2. Section 3 presents the basic principle and application of wavelet transform for the enhancement of ECG signals. Reported ECG signal denising methods based on noise reduction algorithms in EMD domain is described in section 4 and that in discrete wavelet transform (DWT) domain is presented in section 5. Denoising schemes involving enhancements in both EMD and DWT domains are explained in section 6 and there advantages over merely EMD or wavelet domain based denoising is presented in section 7. In section 8, the simulation results of all the denoising methods under consideration is provided in detail and their relative performance is compared.
2. EMPIRICAL MODE DECOMPOSITION (EMD)
EMD is intuitive and adaptive, with basic functions derived fully from the data. The computation of EMD does not require any previously known value of the signal. The key task here is to identify the intrinsic oscillatory modes by their characteristic time scales in the signal empirically, and accordingly, decompose the signal into intrinsic mode functions (IMFs). As a result, EMD is especially applicable for nonlinear and non-stationary signals, such as ECG. A function is considered to be an IMF if it satisfies two conditions; First, In the whole data set, the number of local extrema and that of zero crossings must be equal to each other or different by at most one and second, at any point, the mean value of the envelope defined by the local maxima and that defined by the local minima should be zero. The systematic way to decompose the data into IMFs, known as the "sifting" process, is described as follows,
1. All the local maxima of the data are determined and joined by cubic spline line as the upper envelope. 2. All the local minima of the data are found and connected by cubic spline line as the lower envelope.
3. In the first sifting process, the mean
m
1 of the upper and lower envelops is first determined, and then, subtractedfrom the original data
x
[
n
]
to obtain the first componenth
1[
n
]
as,.
]
[
=
]
[
11
n
x
n
m
h
(1)501
i, ii and iii are repeated on
h
1[
n
]
to derive the second componenth
2[
n
]
as,.
]
[
=
]
[
1 22
n
h
n
m
h
(2)where,
m
2 is the mean value determined fromh
1[
n
]
. with a view to determinec
1[
n
]
fromh
2[
n
]
, the conditions to be satisfied to be an IMF is checked forh
2[
n
]
. Ifh
2[
n
]
does not satisfy the conditions, a standard difference(SD) is calculated from the two consecutive sifting results, namely
h
i1[
n
]
andh
i[
n
]
as,.
]
[
|
]
[
]
[
|
=
21
2 1
0
=
h
n
n
h
n
h
SD
i i i
N
n
(3)When the value of SD resides within a predefined range, the sifting process is terminated, and
h
i[
n
]
is termed as]
[
1
n
c
.5. Once
c
1[
n
]
is obtained, it is then subtracted from the original data to get a residuer
1[
n
]
,].
[
]
[
=
]
[
11
n
x
n
c
n
r
(4)The residue
r
1[
n
]
is treated as a new signal, and sifting process as described above is carried out onr
1[
n
]
to obtain the next residue signalr
2[
n
]
. Therefore, the residue signal thus obtained can be expressed in general as,].
[
]
[
=
]
[
n
r
1n
c
n
r
j j
j (5)If
r
j[
n
]
becomes a constant or monotonic function, the process of decomposing the signal into IMFs is terminated. To this end, for a L level decomposition, the original signal x[n] can be represented as the sum of the decomposed IMFs and the resulting residuer
L[
n
]
as given by,].
[
]
[
=
]
[
1
1 =
n
r
n
c
n
x
i LL
i
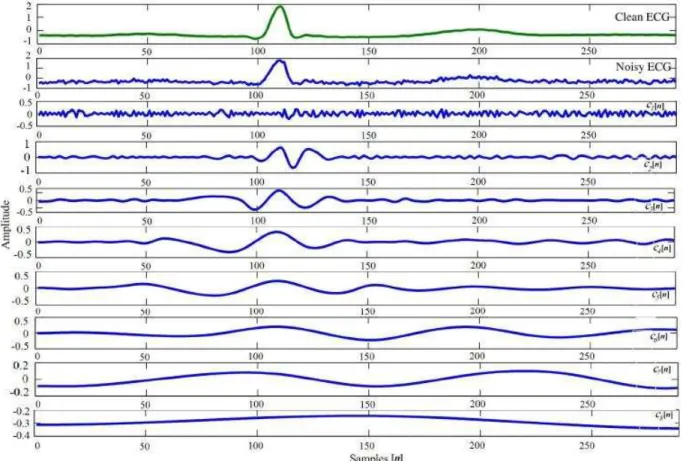
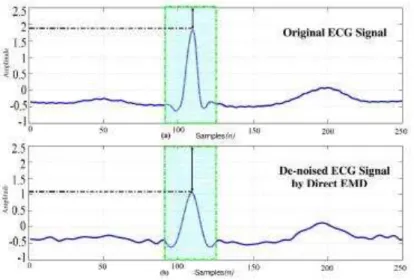
(6)The basic principle of using EMD in ECG signal denoising is to decompose the noisy signal into the IMFs as shown in Fig. 5(`)@. Since some IMFs contain useful signal information and others carry signal plus noise, the selection of proper number of IMFs is an important factor in ECG denoising by EMD. Numerous approaches have been proposed to identify whether a specific IMF contains useful information or noise [16]. Conventionally, a number of initial IMFs assumed to contain noise are discarded in the process of denoising thus causing distortion in the reconstructed ECG signal, particularly, in the QRS complex as shown in Fig. 2. It is observed from Fig. 5(`)@ that the first IMF
c
1[
n
]
contains mostly high frequency noise. The second and third IMFs (
c
2[
n
]
andc
3[
n
]
), in general, contain not only the high frequency noise, but also the components of the QRS complex. The rest of the IMFs mainly carry useful information about the ECG signal. With a view to remove noise, discarding the first IMF as done in the conventional EMD method may still retain considerable noise and removing the first two IMFs may result in a heavy distortion in the R waves of the denoised signal. Therefore, in the EMD domain, the method of thresholding the initial IMFs as performed via removing them is not effective enough for ECG denoising.502
Fig. 2. Decomposition of noisy ECG signal into IMFs.
3. DISCRETE WAVELET TRANSFORM (DWT)
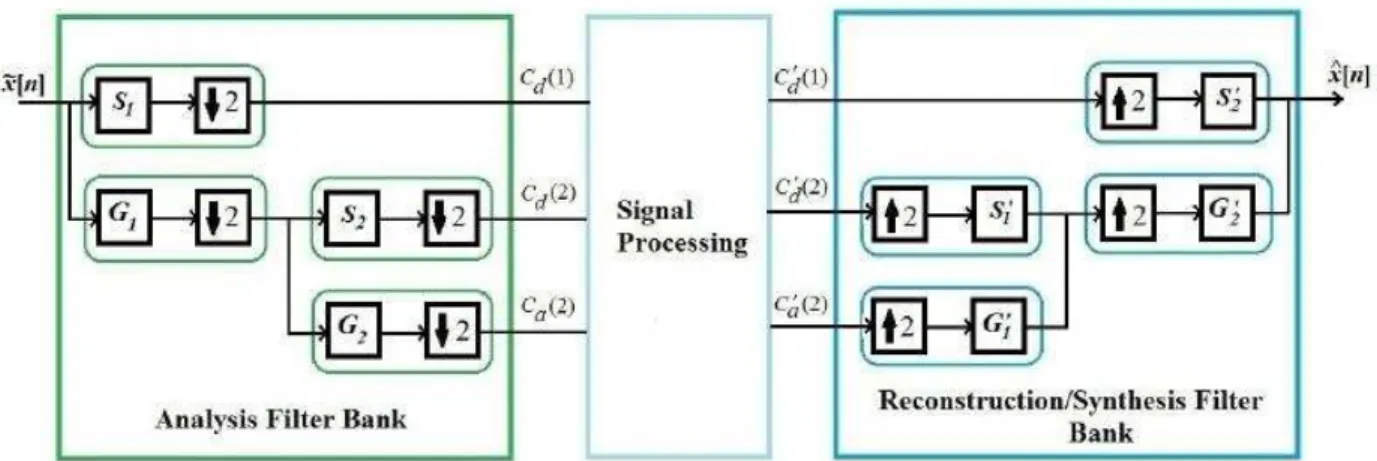
In wavelet transform, a signal is analyzed and expressed as a linear combination of the sum of the product of the wavelet coefficients and mother wavelet. A family of the mother wavelet is available [17] having the energy spectrum concentrated around the low frequencies like the ECG signal as well as better resembling the QRS complex of the ECG signal. Therefore, for the analysis of an ECG signal x[n] at different scales, wavelet transform (DWT) is in used in practice. In Discrete Wavelet Transform (DWT), for analyzing both the low and high frequency components in x[n], it is passed through a series of low-pass and high-pass filters with different cut-off frequencies. This process results in a set of approximate (
c
a) and detail (c
d) DWT coefficients, respectively. The DWT hierarchy of a 2 level signal analysis and reconstruction/synthesis is shown in Fig. 5, where down arrow and up arrow represent down-sampling and up-sampling the DWT coefficients, respectively. The filtering operations in DWT result in a change in the signal resolution [28], whereas sub sampling (down sampling/up sampling) causes change of the scale. Thus, DWT decomposes the signal into approximate and detail information thereby helping in analyzing it at different frequency bands with different resolutions.A general equation for the DWT transformed signal is written as [20],
],
[
]
[
=
]
,
[
,=
n
n
x
b
a
X
abn
(7)
where, x[n] is the given ECG signal to be transformed and
.
)
1
(
=
]
[
,
a
b
n
a
n
b
a
(8)503
conditions [29] are to be maintained for
[
n
]
to be the mother wavelet. First, the energy associated with
[
n
]
must be finite, i.e..
<
|
]
[
|
=
2=
n
E
n
(9)Second, the following admissibility condition must be true,
,
<
|
]
[
~
|
=
2
0 =
k
k
k
(10)where,
is the admissibility constant with its value dependent on the chosen wavelet, and,
]
[
=
]
[
( 2 )/=
K kn i
n
e
n
k
(11)is the K-point Discrete Fourier Transform (DFT) of
[
n
]
. Eqn. 10 implies that the wavelet has no zero-frequency component, i.e.[0]
~
= 0, or alternately, it must have a zero mean.Generally, in ECG denoising, after performing noise reduction on noisy ECG y[n], signal reconstruction is required retaining the characteristics of the original uncorrupted ECG signal x[n]. Since, DWT satisfies the energy conservation law and original signal can be properly reconstructed via employing it, DWT gained popularity in ECG denoising [30]. In the conventional approach of ECG denoising based on DWT, either hard or soft thresholding of the DWT coefficients is performed [12]. In hard thresholding, the noisy ECG signal value smaller than a predetermined threshold value is set to zero. On the other hand, in soft thresholding, in addition to performing the operation of hard thresholding, the threshold value is subtracted frm the noisy ECG signal if the signal value is larger than the threshold one. In contrast to the hard thresholding, soft thresholding causes no discontinuities in the denoised ECG signal. Therefore, soft thresholding is preferred in practice for ECG denoising.
Figure 3: (a) Original ECG signal; (b) Denoised ECG signal using conventional EMD method.
4. DENOISING ALGORITHMS IN EMD DOMAIN
504
systematic way to decompose the data into IMFs, known as the "sifting" process.
Reported ECG signal denoising schemes in the EMD domain are soft and hard thresholding [22] and enhanced EMD method by providing windowing in the EMD domain [32]. Brief descriptions on these methods are provided below.
4.1 EMD Hard thresholding
Decomposition of ECG signals in the EMD domain provides IMFs with noise that satisfy random distribution and IMFs with signal components that does not satisfy the random distribution. With thresholding de-noising method the noise can be separated from the signal. The key issues here are detection of gross error and setting the threshold. The common criterion of gross error detection is the 3
rule [27], whose basic principle is that the absolute value of random error is mainly concentrated in the vicinity of its medium.In EMD hard thresholding, a given IMF is regarded as gross error and that is more than 3
is eliminated. The signal component is first detected by using the 3
rule, and then the random noise mean square value is computed, so the threshold,t
is identified as 3
. Afterwards, the following hard thresholding function is used to denoise the IMF,
,
|<
|
0,
|
|
,
=
)
(
c
t
t
c
c
c
T
(12)here,
T
is the thresholded IMF obtained after soft thresholding of the IMF with the previous value ofc
. After the thresholding process, the thresholded IMFs are reconstructed to obtain the denoised ECG signal.4.2 EMD Soft thresholding
Soft thresholding method also employs the 3
rule. In the soft thresholding method in the EMD domain, first the thresholdt
is identified and then a soft thresholding function is employed as follows,
,
|<
|
0,
|
|
),
|
)(|
(
=
)
(
c
t
t
c
t
c
c
sign
c
T
(13)here,
T
is the thresholded IMF obtained after soft thresholding of the IMF with the previous value ofc
.4.3 Enhanced EMD Method
The rate of information change in the QRS complex is very high compared to that of the other parts of an ECG signal so that the QRS information is mainly embedded in the first three high frequency IMFs [32]. As a consequence, in a noisy case, a desirable approach to denoise the corrupted ECG signal would be to filter out the noisy parts of the first three IMFS without discarding them completely thus preserving the QRS complex. This preservation of QRS complex is performed in [32]. First, the peak of the R wave (fiducial point) along with its nearest minima are determined from the maximum of the noisy ECG beat. Then the QRS complex is preserved by employing a time domain window in the first three IMFs. Finally, cleaner ECG signal is synthesized by adding the windowed d[n], the remaining IMFs, and the residue,
r
L[
n
]
of the EMD operation.5. DENOISING METHODS IN WAVELET DOMAIN
Discrete Wavelet Transform (DWT) analyze and express a signal as a linear combination of the sum of the product of the wavelet coefficients and mother wavelet. A family of the mother wavelet is available [17] having the energy spectrum concentrated around the low frequencies like the ECG signal as well as better resembling the QRS complex of the ECG signal. Therefore, for the analysis of an ECG signal x[n] at different scales DWT is in used in practice. In DWT, for analyzing both the low and high frequency components in x[n], it is passed through a series of low-pass and high-pass filters with different cut-off frequencies. This process results in a set of approximate (
c
a) and detail (c
d) DWT coefficients, respectively. The filtering operations in DWT result in a change in the signal resolution [28], whereas sub sampling (down sampling/up sampling) causes change of the scale. Thus, DWT decomposes the signal into approximate and detail information thereby helping in analyzing it at different frequency bands with different resolutions.505 EMD-enhanced ECG signal
~
x
[n] (EMDECG) into DWT coefficients, thresholding of the DWT coefficients, and the ECG signal reconstruction. The performance of ECG denoising in wavelet domain depends on the estimation of the threshold value,
. Several methods have been proposed for estimating
values [5]. In particular, for denoising a normally distributed Gaussian noise, Donoho and Johnstone [11] proposed the universal threshold
with orthonormal basis as given by,,
2
=
logM
(14)here,
is the standard deviation of the detailed DWT coefficients of a wavelet level and M is the length of the vector of the DWT coefficients.
Fig. 4. Wavelet hierarchy for 2 level decomposition.
5.1 Wavelet Hard Thresholding
Hard thresholding in the DWT domain zeroes out all the signal values smaller than
. As a result there appears discontinuity in the reconstructed signal. In equation form hard thresholding operation performed on a particular detailed DWT coefficientd
i on a wavelet levell
can be expressed as,
,
|<
)
(
~
|
0,
|
)
(
~
|
|,
)
(
~
|
=
)
(
~
l di
l di
di
di
X
l
l
X
l
X
l
X
(15)
where, i stands for the index of the detailed DWT coefficients at a level l. Usually hard thresholding is used for data compression purpose.
5.2 Wavelet Soft Thresholding
506
,
|<
)
(
~
|
0,
|
)
(
~
|
,
|
)
(
~
|
=
)
(
~
l di l di l didi
X
l
l
X
l
X
l
X
(16)where, i stands for the index of the detailed DWT coefficients at a level l. In contrast to hard thresholding, Soft thresholding causes no discontinuities in the resulting signal.
5.3 Wavelet Adaptive Thresholding
The denoised ECG signal can be estimated by performing a thresholding operation on
~
X
as,),
,
~
(
=
~
X
THR
X
(17)where, the THR(.) denotes a thresholding function and
denotes a threshold value.
is determined according to (14), where
values change depending on the detailed DWT coefficients of the level. Since, the approximate DWT coefficients contain the low frequency of the original ECG signal, where most energy exists, it is excluded from the intended thresholding operation [5]. Since, ECG signals are non-stationary in nature, application of hard or soft thresholding technique based on a fixed threshold value
, which is non-adaptable to signal intensities, may not improve the ECG signal degradation in noise. Therefore, adaptive thresholding is performed in the wavelet domain based on a threshold value
adapted to the detailed DWT coefficients of each level. The adaptive soft thresholding is defined as,1,2,
=
),
),
(
~
(
=
)
(
~
l
l
X
THR
l
X
d d
l (18)where,
X
d~
signifies the array of thresholded detailed DWT coefficients, l represents a wavelet level, and
l is the determined threshold value for that level.6. COMBINED EMD-WAVELET BASED METHODS
These methods have incorporated advantages of both EMD and wavelet thresholding algorithm for the actual gathering ECG signal denoising. In practice, it is not ideal with simply wavelet thresholding algorithm or EMD [13] algorithm as ECG signals are relatively weak and have strong background noise. In addition, accordance with wavelet adaptive threshold characteristics and noise features which are distributed in various IMFs after decomposition, post-processing of IMFs with corresponding wavelet threshold based de-noising will effect better than merely using single algorithms [11].
6.1 EMD-Wavelet Method
The method of denoising ECG signal employing algorithms in both EMD and wavelet domain were first presented in [15]. It utilized the adaptability of EMD to make up the indetermination when choosing wavelet function, and then used wavelet thresholding to prevent the distortion of EMD algorithm. In this method., first the ECG signal
x
[
n
]
is decomposed in the EMD domain. For a L level decomposition, the original signal x[n] can be represented as the sum of the decomposed IMFs and the resulting residuer
L[
n
]
as given by,].
[
]
[
=
]
[
1 1 =n
r
n
c
n
x
i LL
i
(19)507
[6]. Finally, complete signal reconstruction with new IMF components was performed as below,
].
[
]
[
=
]
[
1 1 =n
r
n
c
n
x
i LL
i
(20)where,
x
[
n
]
is the denoised ECG signal,c
i
[
n
]
is thei
th denoised IMF component andr
L
[
n
]
is the denoised residual signal after wavelet thresholding.6.2 Enhanced EMD Adaptive Wavelet (EEAW) Method
In [16], the authors have presented a more advanced ECG denoising scheme with noise reduction algorithms in both EMD and wavelet domain. In order to preserve the QRS information in the presence of noise, the noisy ECG signal is first enhanced in the EMD domain by a windowing operation. Then, the ECG signal with a relatively reduced noise is transformed in the wavelet domain. Finally, an adaptive thresholding scheme is employed to the wavelet coefficients prior to reconstructing a cleaner ECG signal.
The first step is windowing in the EMD domain. Unlike the EMD based conventional ECG denoising method that discards completely the initial IMFs containing the QRS complex as well as noise, the QRS complex information is preserved from the first three high frequency IMFs by reducing noise from them. In order to do so, first the QRS complex is detected from the peak of the R wave (fiducial point) along with its location. Next, EMD is applied to the noisy ECG beat to compute the sum of the first three IMFs: d[n] =
c
1[n]+c
2[n]+c
3[n]. Next, with a pre-idea of the span of the QRS complex thus obtained, we apply a time domain window
[n] to d[n] centered at the fiducial point such that the window length covers the QRS complex. The choice of the window
[n] should be sch that it offers a flat gain at the R wave and decays gradually to zero for ensuring a smooth transition with minimal distortion. The window size is adjusted according to the QRS duration that varies among different ECG signals. The effect of such a windowing operation on d[n] computed from the noisy ECG is presented in Fig. 3. By preserving the QRS complex based on the windowing in the EMD domain, the windowed d[n], the remaining IMFs, and the residue,r
L[n] of the EMD operation are employed to synthesize a cleaner ECG as below,
.
]
[
]
[
]
[
]
[
]
[
]
[
]
[
]
[
=
]
[
~
1 4 = 1 4 = 3 1 =n
r
n
c
n
d
n
n
r
n
c
n
c
n
n
x
L i L i L i L i i i
(21)508 operation.
The next step is to transform the signal at hand in the wavelet domain for further reduction of noise. The signal
~
x
[n] is expressed as,],
[
~
]
[
=
]
[
~
n
n
x
n
x
(22)where, x[n] is the original clean ECG signal, and
~
v
[n] is the additive noise remaining after the EMD operation.Wavelet transform on
~
x
[n] up to a chosen level. If W denotes a wavelet transform matrix, eqn. (22) can be written in the wavelet domain as,,
~
=
~
V
X
X
(23)where,
~
X
= W~
x
[n],~
V
= W~
v
[n] and X = Wx[n]. Finally the denoised ECG signal can be estimated byperforming a thresholding operation on
~
X
,),
,
~
(
=
~
X
THR
X
(24)where, the THR(.) denotes a thresholding function and
denotes a threshold value.Finally, an estimate of the original ECG signal is obtained
x
ˆ
[n] by using inverse wavelet transform onX
as given by,],
ˆ
[
=
]
[
~
X
IDWT
n
x
(25)where, IDWT represents an inverse DWT operation.
7. ADVANTAGES OF EMD-WAVELET BASED DENOISING
509
(a) Original clean ECG and summation d[n] of first three IMFs from clean ECG (b) Clean and Noisy ECG and summation d(n) of first three IMFs from noisy ECG.
The advantage of combined EMD-wavelet based denoising algorithm over merely EMD or DWT domain based Denoising is justified in [15]. However, the method described in [15] had some limitations in ECG signal Denoising which have been overcome in [14]. The explanation of [14] as a better Denoising method is presented below. The conventional EMD based ECG Denoising approaches neglect a number of initial IMFs containing the QRS complex as well as noise. Performing windowing operation in the EMD domain in order to reduce the noise from the initial IMFs instead of discarding them completely thus preserving the QRS complex yields a relatively cleaner ECG signal.
The rate of information change in the QRS complex is very high compared to that of the other parts of an ECG signal. An analysis of the EMD on clean and noisy ECG indicates that the QRS information is mainly embedded in the first three high frequency IMFs [32]. As a consequence, in a noisy case, a desirable approach to denoise the corrupted ECG signal y[n] in the EMD domain would be to filter out the noisy parts of the first three IMFS without discarding the IMFs completely thus preserving the QRS complex. This can be achieved by temporal processing in the EMD domain. With this motivation in mind, we analyze the characteristics of the ECG signal along with that of the sum of the first three IMFs: d[n] =
c
1[n]+c
2[n]+c
3[n] obtained from the corresponding ECG signal.Fig. 6 presents the original clean and noisy ECG signals, and the respective plots of d[n] in each case. It is revealed from this figure that the oscillatory pattern of the QRS complex, and that of the d[n] in the QRS complex region are highly similar to each other. Also, the QRS complex is bounded by the two zero-crossing points of d[n], where one zero-crossing point is on the left hand side, and the other is on the right hand side of the local minima near the fiducial point (peak of the R-wave) as vivid from Fig. 6(a).
510
windowing and finally, synthesize a cleaner ECG by a partial reconstruction scheme.
The signal thus obtained is transformed in the DWT domain. DWT has advantageous properties in preserving the energy in the presence of noise and in reconstructing the original ECG signal with a better time resolution. Although, DFT provides a signal representation in terms of amplitude and phase as a function of frequency, the DWT replaces the fixed bandwidth of DFT with one proportional to frequency, which allows better time resolution at high frequencies than the DFT. The resulting loss of frequency resolution as frequency increases is acceptable in applications involving biological signals, such as ECG. ECG signal denoising using the DWT consists of the three
successive procedures, such as, decomposition of the ECG signal
~
x
[n] enhanced in the EMD domain into DWT coefficients, thresholding of the DWT coefficients, and the reconstruction of the ECG signal.Fig. 7. First three IMFs d[n] computed from the noisy ECG (a) Before windowing operation (b) After windowing operation.
8. SIMULATION AND RESULTS
In this Section, we perform a number of simulations to evaluate our proposed method. The performance of the proposed method is compared with some of the state-of-the art methods in terms of several conventionally used metrics.
8.1 Database and other simulation details
In our simulation, we employ Physionet MIT-BIH arrhythmia database [33] for analyzing and denoising ECG signals. In this database, a single ECG signal is described by (i) a text header file (.hea), (ii) a binary file (.dat ) and (iii) a binary annotation file (.atr). Header file consists of detailed information, such as number of samples, sampling frequency, format of ECG signal, type of ECG leads and number of ECG leads, patients history, and the detailed clinical information. Each recording of the ECG signal was digitized at 360 samples per second per channel with 11-bit resolution over 10mV range. In binary data signal file, the signal is stored in 212 format, which means that each sample requires the number of leads times 12 bits to be stored, and the binary annotation file consists of beat annotations [33]. For our simulations, we consider the ECG signals numbered as - 100, 103, 104, 105, 106, 115 and 215.
511
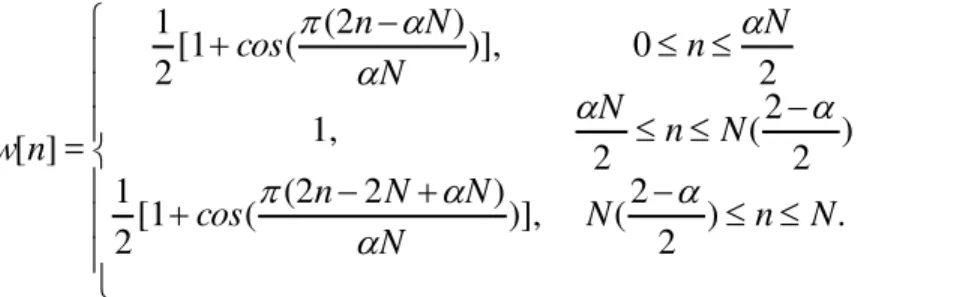
.
)
2
2
(
)],
)
2
(2
(
[1
2
1
)
2
2
(
2
1,
2
0
)],
)
(2
(
[1
2
1
=
]
[
N
n
N
N
N
N
n
cos
N
n
N
N
n
N
N
n
cos
n
w
(26)This window is also known as tapered cosine window and it can be regarded as a cosine lobe of width
2
N
that is
convolved with a rectangular window of width
)
N
2
(1
. The ratio between the cosine lobe and the constant gain part of the Tukey window is defined as,.
2
2
=
R
(27)The window size N can be chosen empirically. Typically, when a QRS complex occurs in an ECG beat, there is a 200 ms refractory period before the next one comes [24], where 200 ms corresponds to 72 samples for a sampling frequency of 360 samples/sec. In our method, we have utilized a Tukey window centered at the fiducial point (peak of the R-wave) with a span of 30 samples to accommodate the QRS complex. A 30-sample Tukey window with R=0.5 is presented in Fig. 4.
Figure 8: A Tukey window function.
It is known that symlets family of wavelets give details more accurately than that of others. Also, these wavelets show similarity with the QRS complexes and as in case of ECG signal, their energy spectra are concentrated around low frequencies [17]. Therefore, in this paper, symlet 7 is selected as the mother wavelet while performing wavelet analysis. A 2-level wavelet decomposition tree with symlet 7 bases function is exploited for the implementation of the thresholding in the DWT domain.
8.2 Performance evaluation and comparison
In this section denoising performance is analyzed and compared for EMD hard thresholding [22], EMD soft thresholding [22], enhanced EMD [32], wavelet hard thresholding [26], wavelet soft thresholding [5], wavelet adaptive thresholding [21], EMD-wavelet [15] and enhanced EMD adaptive wavelet [14] methods. The simulations were carried out in MATLAB 7.6 environment.
512
,
|
]
[
]
[
ˆ
|
|
]
[
]
[
|
10
=
]
[
2 1 = 2 1 = 10n
x
n
x
n
x
n
y
log
dB
SNR
N i N n imp
(28),
])
[
ˆ
]
[
(
1
=
2 1 =n
x
n
x
N
MSE
N n
(29)100,
]
[
])
[
ˆ
]
[
(
=
2 1 = 2 1 =
n
x
n
x
n
x
PRD
N i N n (30)where, x[n] denotes the original ECG signal, y[n] means the noisy ECG signal, and
x
ˆ
[n] denotes the reconstructed enhanced ECG signal, and N is the number of ECG samples. For a denoising method to be said better, it is desirable that the larger theSNR
imp is, the smaller theMSE
andPRD
are.Fig. 5 shows the results of the
SNR
imp [dB] for all the comparison methods using different ECG signals underconsideration at a particular input SNR level of 20 dB. This figure implies that the highest
SNR
imp [dB] is obtainedby using EEAW denoising method for all the ECG signals. Fig. 6 persents
SNR
imp [dB] at different input SNR levels in a column diagram. In this figure, for a particular denoising scheme at a specific SNR, the mean improvement is calculated by considering theSNR
imp [dB] for all the ECG signals under consideration. Over the range of inputSNR levels (20 dB to 6 dB) the other methods produce lower
SNR
imp [dB], whereas theSNR
imp [dB] for the EEAW method is higher even at lower input SNRs as expected.Figure 9: Comparison of
SNR
imp [dB] obtained by using different denoising methods in EMD and wavelet domains.513
Figure 10: Comparison of the mean
SNR
imp [dB] for different denoising methods at different input SNR levels .
Fig. 7 presents the comparison of the
MSE
results obtained by using different denoising methods in a column diagram for the same group of ECG signals as used in Fig. 5 at the same level of SNR considered. It is vivid from this table that for a particular ECG signal, EEAW method yields the smallestMSE
thus attest its capability to yield enhanced ECG signal with better quality. Fig. 8 depicts the MSE results for different input SNR levels in a 3-D area plot. At any SNR level, the mean of the MSE results obtained from the MSE of all the ECG files for a particular denoising scheme. As SNR varies from high to low, the proposed method always outperforms all the comparison methods as the mean MSE for other methods are relatively higher, particularly at a low SNR.Figure 11: Comparison of the mean
MSE
[dB] obtained by using different denoising methods in EMD and wavelet domains.514
Figure 12: Comparison of the mean
MSE
for different denoising methods at different input SNR levels.A graph presenting the percentage
PRD
(%)
results obtained by using different denoising methods are plotted in Fig. 9 for all the ECG signals at an input SNR level of 20 dB. This bar diagram clearly portrays that for any ECG signal, the other comparison methods result in a relatively higherPRD
(%)
while EEAW method is best in performance as it yields the lowestPRD
(%)
.PRD
(%)
results vs different input SNR levels are plotted in a bar diagram in Fig. 10 for all the methods under consideration. At a particular SNR level, thePRD
(%)
value for a denoising scheme is the meanPRD
(%)
values obtained by using all the ECG files. It is vivid from this figure that along the whole range of input SNR levels considered, the other methods show comparatively higherPRD
(%)
with respect to the EEAW method thus ensuring the superiority of EEAW method.
Figure 13: Comparison of the
PRD
(%)
obtained by using different denoising methods.515
Figure 14: Comparison of the mean
PRD
(%)
for different denoising methods at different input SNR levels.9. CONCLUSION
ECG signal enhancement is vital for accurate detection of cardiac arrhythmia. EMD and DWT domain based denoising methods reduce noise from ECG signals more effectively compared to conventional signal enhancing algorithms. Because of the adaptivity of EMD and DWT methods, a denoising scheme based on enhancements employed in the EMD and wavelet domains is far more effective in reducing noise. This paper analyzed reported denoising schemes in EMD and wavelet domains and verify their effectiveness in noise reduction using the MIT-BIH arrhythmia database. The comparison under several standard metrics shows that combined EMD and DWT domain based noise reduction algorithms enhance the noisy ECG signal more effectively compared to denoising schemes based on only EMD or DWT domain.
10. ACKNOWLEDGEMENT
The authors would like to express their sincere gratitude towards the authorities of the Department of Electrical and Electronic Engineering, Bangladesh University of Engineering and Technology (BUET) for providing constant support throughout this research work.
REFERENCES
[1]. E. N. Bruce, Biomedical Signal Processing and Signal Modeling. New York: Wiley, 2001. [2]. R. M. Rangayan, Biomedical Signal Analysis. IEEE Press, 2002.
[3]. M. B. Velasco, B. Weng, and K. E. Barner, “A new ECG enhancement algorithm for stress ECG tests,” Computers in Cardiology,npp. 917 –920, Sept. 2006.
[4]. H. Yan and Y. Li, “Electrocardiogram analysis based on the karhunen-loeve transform,” in Proceedings of the 3rd International Conference on Biomedical Engineering and Informatics (BMEI), 2010, vol. 2, Oct. 2010, pp. 887 –890.
[5]. M. Popescu, P. Cristea, and A. Bezerianos, “High resolution ECG filtering using adaptive bayesian wavelet
shrinkage,” Computers in Cardiology, Cleveland, Ohio, USA, vol. 2, pp. 401–404, Sept. 1998.
[6]. V. Almenar and A. Albiol, “A new adaptive scheme for ECG enhancement,” Signal Processing, vol. 75, pp. 253–263, 1999.
[7]. G. Tang and A. Qin, “ECG de-noising based on empirical mode decomposition,” in 9th International Conference for Young Computer Scientists, 2008, Feb. 2008, pp. 903 – 906.
[8]. M. Alfaouri and K. Daqrouq, “ECG signal denoising by wavelet transform thresholding,” American Journal of Applied Sciences, vol. 5 (3), pp. 276–281, 2008.
[9]. A. K. Barros, A. Mansour, and N. Ohnishi, “Removing artifacts from electrocardiographic signals using independent components analysis,” Neurocomputing, vol. 22, no. 1-3, pp. 173–186, 1998.
[10]. T. He, G. Clifford, and L. Tarassenko, “Application of ICA in removing artefacts from the ECG,” Neural Processing Letters, pp. 105–116, 2006.
[11]. M. Chawla, H. Verma, and V. Kumar, “ECG modeling and QRS detection using principal component
516
[12]. G. Clifford, L. Tarassenko, and N. Townsend, “One-pass training of optimal architecture auto-associative neural network for detecting ectopic beats,” IEE Electronic Letters, vol. 37 no. 18, pp. 1126–1127, Aug. 2001. [13]. H. Kasturiwale and C. Deshmukh, “Quality assessment of ICA for ECG signal analysis,” in Proceedings of the 2nd International Conference on Emerging Trends in Engineering and Technology (ICETET), 2009, Dec. 2009, pp. 73 –75.
[14]. R. Sameni, M. Shamsollahi, C. Jutten, and G. Clifford, “A nonlinear bayesian filtering framework for ECG denoising,” IEEE Transactions on Biomedical Engineering, vol. 54, no. 12, pp. 2172 –2185, Dec. 2007. [15]. N. Li and P. Li, “An improved algorithm based on EMD-wavelet for ECG signal de-noising,” in International
Joint Conference on Computational Sciences and Optimization, 2009, 2009, pp. 825 – 827.
[16]. M. A. Kabir and C. Shahnaz, “An ECG signal denoising method based on enhancement algorithms in EMD and
wavelet domains,” in International Technical Conference of IEEE Region 10 (TENCON), Bali, Indonesia, Nov. 2011, pp. 677 –680.
[17]. H. Liang, Q. Lin, and J. D. Z. Chen, “Application of the empirical mode decomposition to the analysis of esophageal manometric data in gastroesophageal reflux disease,” IEEE Trans. Biomed. Eng., vol. 52, no. 10, pp. 1692–1701, Oct. 2005.
[18]. Mahmoodabadi and S. Ahmadian, “ECG feature extraction based on multiresolution wavelet transform,” in Proceedings of the IEEE 27th Annual Conference on Engineering in Medicine and Biology Shanghai, China, 2005, Sept. 2005, pp. 3902–3905.
[19]. “The wavelet tutorial part iv, multiresolution analysis: The discrete wavelet transform,” 2008. [Online]. Available: www.cs.ucf.edu/courses/cap5015/WTpart4.pdf
[20]. S. Saxena, V. Kumar, and S. Hande, “QRS detection using new wavelets,” Journal of Medical Engineering and Technology, vol. 26, pp. 7–15, Nov. 2002.
[21]. P. S. addition, “Wavelet transforms and the ECG: A review,” Institute of Physics Publishing, Physiol. Meas., vol. 26, pp. 155–199, 2005.
[22]. L. Sharma, S. Dandapat, and A. Mahanta, “Multiscale wavelet energies and relative energy based denoising of
ecg signal,” in Communication Control and Computing Technologies (ICCCCT), 2010 IEEE International Conference on, oct. 2010, pp. 491 –495.
[23]. A. Elbuni, S. Kanoun, M. Elbuni, and N. Ali, “ECG parameter extraction algorithm using (DWTAE) algorithm,” in International Conference on Computer Technology and Development, 2009, 14-16, Dec. 2009, pp. 315–320.
[24]. B. Weng, M. B. Velasco, and K. E. Barner, “ECG denoising based on the empirical mode decomposition,” in 28th IEEE EMBS Annual International Conference New York City, USA, 2006, Sept. 2006, pp. 1–4.
[25]. J. Zhang, “The determination of the threshold and the decomposition order in threshold de-noising method
based on wavelet transform,” in Conference on Software Engineering Education, 2004, Feb. 2004, pp. 118–122.
[26]. D. Donoho, “De-noising by soft-thresholding,” IEEE Transaction on Information Theory, vol. 41, 3, pp. 613–627, 1995.
[27]. N. E. Huang, Z. Shen, S. R. Long, M. C. Wu, H. H. Shih, Q. Zheng, N. Yen, C. C. Tung, and H. H. Liu, “The empirical mode decomposition and the hilbert spectrum for nonlinear and nonstationary time series analysis,” Proc. Roy. Soc. Lond., vol. A 454, pp. 903–906, 1998.
[28]. “MIT-BIH arrythmia database,” Accessed on 21/05/2011. [Online]. Available http://www.physionet.org/mitdb [29]. D. Zhang, “Wavelet approach for ECG baseline wander correction and noise reduction,” 2005, pp. 1212–1215. [30]. O. Sayadi and M. Shamsollahi, “ECG denoising with adaptive bionic wavelet transform,” in 28th Annual
![Figure 5: First three IMFs d[n] computed from the noisy ECG (a) Before windowing operation (b) After windowing](https://thumb-eu.123doks.com/thumbv2/123dok_br/16476835.199527/9.918.236.683.630.1072/figure-imfs-computed-noisy-ecg-windowing-operation-windowing.webp)
![Fig. 6 presents the original clean and noisy ECG signals, and the respective plots of d[n] in each case](https://thumb-eu.123doks.com/thumbv2/123dok_br/16476835.199527/11.918.115.808.101.596/fig-presents-original-clean-noisy-signals-respective-plots.webp)
![Fig. 7. First three IMFs d[n] computed from the noisy ECG (a) Before windowing operation (b) After windowing operation.](https://thumb-eu.123doks.com/thumbv2/123dok_br/16476835.199527/12.918.240.680.317.609/fig-imfs-computed-noisy-windowing-operation-windowing-operation.webp)
![Figure 9: Comparison of SNR imp [dB] obtained by using different denoising methods in EMD and wavelet domains](https://thumb-eu.123doks.com/thumbv2/123dok_br/16476835.199527/14.918.246.684.706.995/figure-comparison-obtained-different-denoising-methods-wavelet-domains.webp)
![Figure 10: Comparison of the mean SNR imp [dB] for different denoising methods at different input SNR levels](https://thumb-eu.123doks.com/thumbv2/123dok_br/16476835.199527/15.918.237.674.110.387/figure-comparison-different-denoising-methods-different-input-levels.webp)
