The effect of an aerobic training program
on the electrical remodeling of the heart:
high-frequency components of the
signal-averaged electrocardiogram are
predictors of the maximal aerobic power
1Programa de Engenharia Biomédica, Coordenação dos Programas de
Pós-graduação de Engenharia, Universidade Federal do Rio de Janeiro, Rio de Janeiro, RJ, Brasil
2Departamento de Cardiologia, Universidade Gama Filho, and
Instituto Nacional de Cardiologia, Rio de Janeiro, RJ, Brasil M. Marocolo1, J. Nadal1
and P.R. Benchimol Barbosa2
Abstract
Increased heart rate variability (HRV) and high-frequency content of the terminal region of the ventricular activation of signal-averaged ECG (SAECG) have been reported in athletes. The present study investigates HRV and SAECG parameters as predictors of maximal aerobic power (VO2max) in athletes. HRV, SAECG and VO2max
were determined in 18 high-performance long-distance (25 ± 6 years; 17 males) runners 24 h after a training session. Clinical visits, ECG and VO2max determination were scheduled for all athletes during
thew training period. A group of 18 untrained healthy volunteers matched for age, gender, and body surface area was included as controls. SAECG was acquired in the resting supine position for 15 min and processed to extract average RR interval (Mean-RR) and root mean squared standard deviation (RMSSD) of the difference of two consecutive normal RR intervals. SAECG variables analyzed in the vector magnitude with 40-250 Hz band-pass bi-directional filtering were: total and 40-µV terminal (LAS40) duration of ventricular activation, RMS voltage of total (RMST) and of the 40-ms terminal region of ventricular activation. Linear and multivariate stepwise logistic regressions oriented by inter-group comparisons were ad-justed in significant variables in order to predict VO2max, with a
P < 0.05 considered to be significant. VO2max correlated
significant-ly (P < 0.05) with RMST (r = 0.77), Mean-RR (r = 0.62), RMSSD (r = 0.47), and LAS40 (r = -0.39). RMST was the independent predic-tor of VO2max. In athletes, HRV and high-frequency components of
the SAECG correlate with VO2max and the high-frequency content of
SAECG is an independent predictor of VO2max.
Correspondence
P.R. Benchimol Barbosa Departamento de Cardiologia Universidade Gama Filho Rua Pompeu Loureiro, 36/702 20551-030 Rio de Janeiro, RJ Brasil
Fax: +55-21-2255-1409 E-mail: [email protected]
Research partially supported by CNPq and CAPES.
Received February 7, 2006 Accepted November 13, 2006
Key words
•Long-distance runners •Signal-averaged
electrocardiogram
Introduction
Regular aerobic exercise training brings about beneficial changes in the cardiovascu-lar system, with impact on individual and community health (1-3). The cardiovascular remodeling that follows aerobic fitness, re-flected by both structural and functional changes of the heart, can be easily assessed by routine clinical examination. Mechanical remodeling following progressive upgrade in training level aiming at maximal aerobic power fitness is characterized by increased cardiac performance and a mild to moderate increase in left ventricular mass, and by increased contractile force of the cardio-myocyte in laboratory animal models (1,4-7). Mainly characterized by parasympathetic dominance, autonomic remodeling is char-acterized by decreased resting heart rate and increased heart rate variability (HRV) in-dexes. On the other hand, the electrical re-modeling that occurs with both mechanical and autonomic remodeling is characterized by a redistribution of the activation time throughout the ventricular wall, which is expressed on the surface electrocardiogram (ECG) (4-7).
The presence of high-frequency compo-nents in the terminal region of the surface ECG has been described on athletes (6,8,9). The nature and the genesis of these compo-nents on the surface ECG in athletes, how-ever, are still subject to investigation, and have been associated with both improve-ment of aerobic training level and incipient ventricular hypertrophy (6,8,9). Conven-tional methods aiming at estimating maxi-mal aerobic power consist of exercise test-ing (either field or ergospirometry) usually lasting 12 to 25 min.
The objectives of the present study were: 1) to investigate HRV parameters and high-frequency content of the signal-averaged ECG (SAECG) as predictors of maximal aerobic power in trained athletes and healthy untrained subjects, and 2) to propose a
math-ematical model based on HRV and SAECG parameters to classify both trained and un-trained healthy subjects according to maxi-mal aerobic power.
Subjects, Material and Methods
The study protocol was in accordance with the principles of the Helsinki Declara-tion and was approved by the Ethics Com-mittee in Clinical Research of the Laranjeiras National Institute of Cardiology, Rio de Ja-neiro, RJ, Brazil, and all subjects provided written informed consent before enrollment. The study population was recruited from January to July 2004 and comprised 36 sub-jects divided into two groups: 18 trained long-distance runners (athletes) and 18 healthy untrained subjects (controls). The sample size used in the present study was calculated from numerical variables as de-scribed by Smith et al. (6) and Raineri et al. (10). From reference data, the sampling pro-cedure was based on the difference of the 40-µV terminal (LAS40, ms) of at least 10 ms, with values of α = 0.05 and ß = 0.1, on the vector magnitude, filtered by a 4-pole bi-directional bandpass Butterworth filter with cut-off frequencies at 40 and 250 Hz, and using XYZ Frank orthogonal leads. The sub-jects participating in the present study were slightly younger but had similar anthropo-metric characteristics and gender distribu-tion as those in the studies used as reference in the sampling procedure (6,10). Inclusion criteria were volunteers over 18 and less than 40 years old, in good mental and physi-cal health, without a previous history of cardiovascular disease or systemic arterial hypertension. Subjects less than 18 and more than 40 years old, with a previous history of diabetes mellitus, thyroid dysfunction or liver disease, alcohol consumers, or tobacco smok-ers, or those currently taking any medicine were excluded.
Coo-per 12-min field test (Table 1), and calcu-lated by the following equation (11,12):
(Equation 1)
where D is the distance achieved in the field test, expressed in meters, and VO2max is
estimated as mL kg-1 min-1. Next, the
result-ing VO2max was divided by the constant 3.5
mL kg-1 min-1 to be converted into metabolic
equivalents (METs). Control and athlete groups were separated according to VO2max
as estimated by the Cooper test, arbitrarily defined as less than 11.5 METs for controls and more than 16.0 METs for athletes. The VO2max gap between groups was defined a
priori with the purpose of enhancing even-tual differences in SAECG parameters caused by conditioning level.
The athletes discontinued training 24 h before testing, and fasted for 4 h before signal recording. All subjects replied to a question-naire about age, health condition, use of medi-cation, and physical activities, and their height, weight, anteroposterior and laterolateral tho-racic diameters were measured with the super-vision of a primary care physician. The two groups were matched for age, gender, and body surface area calculated by a nomogram (Table 1) in order to minimize inter-group physiological and anthropometric variability (e.g., chest diameter) and to reduce the poten-tial effect of thoracic geometry on the surface ECG signals.
12-Lead surface ECG acquisition
Each subject also had a 12-lead surface ECG acquired with a CardiMax
electrocar-diograph (Fukuda Denshi, Seattle, WA,
USA) in resting supine position. ECG sig-nals were analyzed for left ventricular hy-pertrophy and assessed by the voltage-dura-tion product, as previously described (13). The voltage-duration product was considered to be abnormal if greater than 2440 mV/s,
defining left ventricular hypertrophy.
ECG acquisition and signal averaging
SAECG was acquired shortly after appli-cation of the questionnaire and physical ex-amination. Before a 15-min continuous sig-nal acquisition, the subjects remained in the supine position for 5 min for stabilization of autonomic modulation after the change from the orthostatic position, thus preventing an “autonomic memory” in the acquired sig-nals (14,15).
The ECG signals were acquired from the body surface using the modified bipolar Frank XYZ-orthogonal leads and an electro-cardiograph amplifier model AEG03 (Lynx Tecnologia Eletrônica, São Paulo, SP, Bra-zil), with 10-GΩ input impedance, 120-dB/ channel common mode rejection, and a 12-VDC power supply. Each ECG lead was amplified (gain = 1000), analogically fil-tered from 0.05 to 300 Hz by a 3rd order Butterworth filter, and converted into digital format by a data acquisition system with a 14-bit AD converter with a ±10-V dynamic range, and -1000 Hz/channel sampling fre-quency (Lynx Tecnologia). The ECG was digitized and immediately stored in the PC
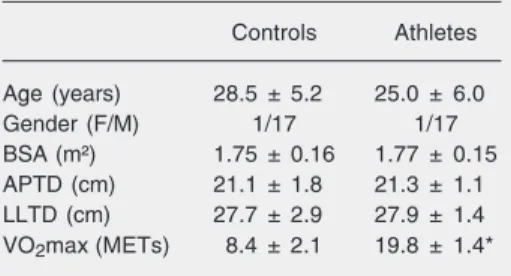
Table 1. Anthropometric and demographic char-acteristics of the subjects who participated in the study.
Controls Athletes
Age (years) 28.5 ± 5.2 25.0 ± 6.0
Gender (F/M) 1/17 1/17
BSA (m²) 1.75 ± 0.16 1.77 ± 0.15
APTD (cm) 21.1 ± 1.8 21.3 ± 1.1
LLTD (cm) 27.7 ± 2.9 27.9 ± 1.4
VO2max (METs) 8.4 ± 2.1 19.8 ± 1.4*
Data are reported as means ± SD for 18 subjects in each group. BSA = body surface area; APTD = anteroposterior thoracic diameter; LLTD = latero-lateral thoracic diameter; VO2max = estimated maximum aerobic power; MET = metabolic equivalent (mL kg min-1).
for off-line processing.
The skin was carefully prepared with a mildly abrasive pad and washed with alco-hol for ECG acquisition, and 6 self-adhesive silver/silver-chloride electrodes were at-tached to the horizontal X-lead electrodes, placed on the right and left mid-axillary lines at the fourth intercostal space. The vertical Y-lead electrodes were placed on the middle clavicle line and second intercos-tal space and cosintercos-tal border, and the sagitintercos-tal Z lead was placed anteriorly and posteriorly at the level of the 4th intercostal space just to the left of the midline. A seventh ground electrode was placed on the tenth rib on the mid-axillary line. The paired electrode-to-electrode impedance was measured and was less than 7 kΩ for all electrode pairs. ECG acquisition was carried out from 8 am to 1 pm in a quiet and air-conditioned environ-ment, with a temperature of 25ºC. Digital data were processed with pattern recogni-tion software to reject ectopic or excessively noisy beats (16,17). The coherent weighted averaging was carried out independently on each lead using a previously described and validated technique for R-wave alignment and was stopped at a final noise below 0.35 µV (16,17). The SAECG was analyzed in the time domain on the vector magnitude (Vm),
defined by:
(Equation 2)
where X, Y and Z are the averaged orthogo-nal leads after 4-pole bi-directioorthogo-nal Butter-worth filtering, with band pass ranging from 40 to 250 Hz.
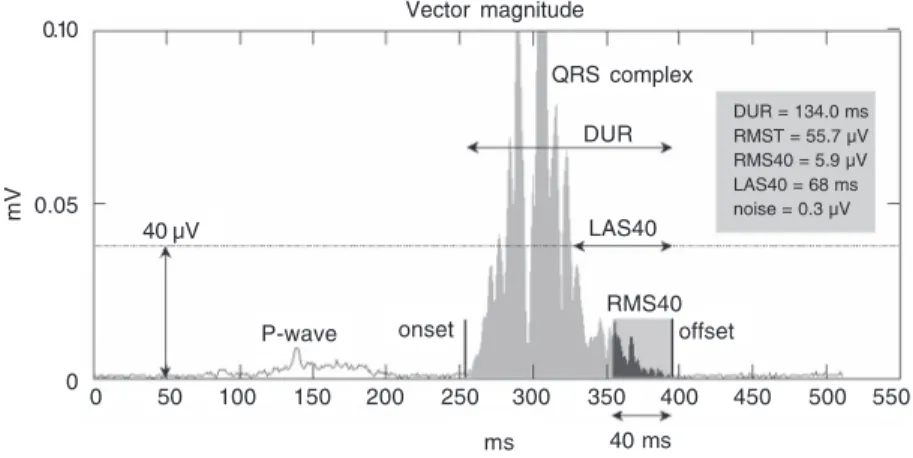
Four parameters were calculated from the vector magnitude (Figure 1): 1) duration of the signal-averaged filtered QRS com-plex (DUR, ms), 2) duration in the terminal region of ventricular activation with a mag-nitude below <40 µV (LAS40, ms), 3) the root mean squared (RMS) value of the po-tentials in the 40-ms terminal of the filtered QRS (RMS40, µV), and 4) the RMS value of the total filtered QRS (RMST, µV). Although terminal portion analysis has been used to identify the risk of ventricular arrhythmias, these parameters have been also tested as markers of cardiac fitness in athletes in gen-eral. SAECG was considered abnormal if two of three (DUR, RMS40, LAS40) param-eters were outside the normal range (18).
Heart rate variability
The raw ECG was processed simulta-neously on the X and Z leads to extract the series of normal RR intervals by rejecting ectopic or extremely noisy beats. The fol-lowing parameters were thus calculated for the analysis of HRV: Mean-RR (ms), the average duration of RR intervals; RRmin (ms), the shortest RR interval value; RRmax (ms), the largest RR interval value; RMSSD (ms), the RMS standard deviation of the difference between two consecutive normal RR intervals. During the analysis of RR interval, rejected beats per acquired ECG ranged from 0.16 to 5.22% with a mean (± SD) of 0.66 ± 0.93%.
Statistical analysis
Continuous variables are reported as mean Figure 1. Vector magnitude parameters in the time domain. Onset and offset represent the
limits of the ventricular activation, automatically detected (see text for details). For abbrevi-ations see legend to Table 2.
0.10
0.05
0
mV
DUR = 134.0 ms RMST = 55.7 µV RMS40 = 5.9 µV LAS40 = 68 ms noise = 0.3 µV
0 50 100 150 200 250 300 350 400 450 500 550
ms 40 ms
Vector magnitude
QRS complex
DUR
LAS40
RMS40 offset onset
± SD. SAECG (RMST, RMS40, DUR, LAS40) and HRV (RMSSD, mean-RR, RRmax, RRmin) parameters had their prob-ability distributions assessed. The RMST and RMS40 variables showed asymmetric probability distributions and were normal-ized by natural logarithm transformation (Lnt) (18,19). The means were compared by the unpaired Student t-test. Categorical vari-ables were compared by the Fisher exact test. Linear regression analysis using the Pearson correlation coefficient (r) was car-ried out between SAECG parameters and VO2max, as well as between HRV
param-eters and VO2max. The level of significance
was set at α = 0.05 in all tests. Data were analyzed using the Statgraphics Plus 5.1 (Manugistic Inc., Rockville, MD, USA), MS Excel 2000 (Microsoft Corporation, Redmond, WA, USA), and Epi-Info 6.04 (Center of Disease Control, Atlanta, GA, USA) software.
Mathematical model
A multivariate stepwise logistic regres-sion model was adjusted to significant HRV and SAECG variables in order to estimate VO2max (P < 0.05 in inter-group
compari-son). In the logistic model, variables with r² ≥ 0.64 and hierarchically lower signifi-cance by the Wald test were considered to be co-variates and were excluded from the mo-del (exclusion started with highest P value). The final model was achieved when all co-variates were excluded.
A binary variable Code, assuming a value of zero for controls and of one for athletes was defined as:
(Equation 3)
where P is given by:
(Equation 4)
Table 2. Signal averaged electrocardiogram and heart rate variability of control sub-jects and athletes.
Control Athletes
Signal-averaged electrocardiogram
DUR (ms) 98.40 ± 14.6 98.10 ± 20.5
Lnt (RMST) (Ln[µV]) 1.93 ± 0.14 2.16 ± 0.15*
LAS40 (ms) 31.80 ± 8.1 24.40 ± 9.5*
Lnt (RMS40) (Ln[µV]) 1.40 ± 0.21 1.73 ± 0.31*
Beats 329 ± 127 323 ± 109
Final noise (µV) 0.23 ± 0.11 0.25 ± 0.08
Heart rate variability
RRmin (ms) 734 ± 165 869 ± 152*
Mean-RR (ms) 1034 ± 160 1351 ± 241*
RRmax (ms) 881 ± 125 1127 ± 194*
RMSSD (ms) 39.70 ± 16.0 74.10 ± 36.6*
DUR = duration of the signal-averaged filtered QRS complex; Lnt (RMST) = natural logarithm transformation of root mean squared value of the total filtered QRS; LAS40 = duration of potentials below 40 µV at terminal QRS complex; Lnt (RMS40) = natural logarithm transformation of RMS value of the potentials in the 40-ms terminal of the filtered QRS; Beats = number of coherent-averaged beats; Final noise = final noise of coherent averaging; RRmin = the shortest RR interval value; Mean-RR = the average duration of RR intervals; RRmax = the largest RR interval value; RMSSD = root mean squared standard deviation.
*P < 0.05 compared to subjects (unpaired Student t-test). where K is a fitting constant and Ai the
regression constant of each Xi variable. A decision-three algorithm based on the final variables of the model was built to stratify VO2max. The threshold cut-off
lev-els of the final variables were detected by logistic regression model analysis, and were not included in the interval range as refer-ence for higher VO2max estimates.
Results
The voltage-duration product was not significantly different (1,676.1 ± 711 for athletes vs 1,325.0 ± 548.5 mV/s for con-trols) between groups. An electrical marker of left ventricular hypertrophy was detected in 3 subjects in the athlete group and in no subject in the control group (P = 0.23).
ex-correlation, however, was found between DUR and VO2max.
The prevalence of abnormal SAECG pa-rameters in the control and athlete groups was 11 and 8.3%, respectively (P = NS). Both RMS40 and LAS40 were abnormal in one athlete and in three control subjects. DUR was within the normal range in all subjects.
Mathematical model
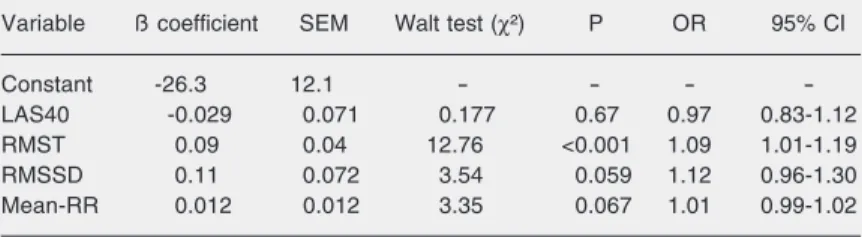
After excluding the significant co-vari-ates, the variables included in the model were: LAS40, RMST, RMSSD, and Mean-RR. The model showed 88.9% positive pre-dictive, 94.4% negative prepre-dictive, and 91.7% total predictive values, explaining 69.33% of total deviance (P < 0.001). RMST was the only independent predictor of VO2max (Table 3).
The threshold cut-off values of the vari-ables involved in the classification of the highest VO2max were (according to the
op-timal dichotomization level as computed by logistic regression model): RMST > 120.9 µV, LAS40 < 28.1 ms, Mean-RR > 1003.8 ms, and RMSSD > 30.3 ms.
The decision algorithm that best defined physical conditioning with 72.2% sensitivi-ty, 94.4% specificisensitivi-ty, and 83.3% total pre-dictive accuracy was (pseudo-code lan-guage):
IF “RMST > 120.9” THEN
IF “LAS40 < 28.1” OR “Mean-RR > 1003.8” OR “RMSSD > 30.3” THEN “Athlete” ELSE “Control”
where {IF...THEN} pairs represent condition commands in hierarchical order, and quoted parameters the condition codes; {ELSE} com-mand points to the final alternative, and {OR} command allows logical non-excluding as-sociation of condition codes. The quoted “Control” and “Athlete” refers to control and athlete groups, respectively.
cept for DUR, for equivalent numbers of coherent-averaged beats and final noise val-ues.
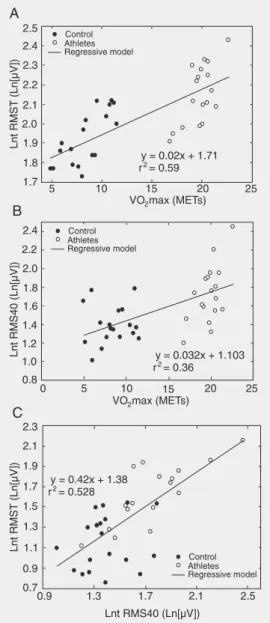
Linear correlation analysis was carried out jointly on the control and athlete groups. Positive correlations were observed between
VO2max and Lnt (RMST), and between
VO2max and Lnt (RMS40) (r = 0.77, P <
0.001; r = 0.6, P < 0.001, respectively; Fig-ure 2A and B). The correlation between LAS40 and VO2max was -0.393 (P = 0.018).
These two parameters, Lnt (RMST) and Lnt (RMS40), also showed a positive correla-tion (r = 0.718, P < 0.001; Figure 2C). No
Discussion
Aerobic training induces significant car-diovascular changes due to maximal aerobic power gain, and is reflected on both the electrical and autonomic properties of acti-vation of the heart, as respectively detected by SAECG and HRV (1,20). Although Koutlianos et al. (21) have reported a signifi-cant correlation between HRV index and VO2max, to the best of our knowledge, the
present study is the first to compare HRV parameters and high-frequency content of SAECG as predictors of VO2max in healthy
sedentary subjects and athletes, and to show that the high-frequency content of the ven-tricular activation wavefront is an independ-ent predictor of maximal oxygen consump-tion. The increase in VO2max caused by
fitness results in a direct effect on ventricu-lar mass (8,22,23) and increases ventricuventricu-lar activation voltage in the surface ECG (10,24). An increase in maximal aerobic power and myocardial mass is, therefore, expected to increase the total ventricular activation en-ergy in SAECG.
Exercise training causes a well-estab-lished autonomic remodeling, which is char-acterized by a reduction in resting heart rate and an increase in HRV, representing a shift of the autonomic modulation toward para-sympathetic over para-sympathetic dominance, as observed in healthy young and old sub-jects and in patients with ischemic heart disease (20,24). On the other hand, the dura-tion of ventricular activadura-tion may be mini-mally affected by aerobic physical condi-tioning, as shown by Jordaens et al. (25), who did not find significant difference in QRS duration among four different groups comprising athletes with ventricular tachy-cardia and three control healthy groups: bas-ketball players, cyclists and untrained con-trols. The RMS40, however, was remark-able and was greater in the control group than in the other groups (25). In the present study, in agreement with the findings of
Jordaens et al. (25), no significant difference was observed between athletes and controls regarding the duration of ventricular activa-tion, although other SAECG variables were significantly different (Table 2).
The QRS voltage-duration product de-rived from the 12-lead surface ECG has also been reported to predict left ventricular hy-pertrophy and is positively correlated with myocardial mass, as described by Okin et al. (26) and Ginefra et al. (27). On the other hand, Vacek et al. (28) applied SAECG to identify cardiac mass size and found a good correlation with echocardiography measure-ments. SAECG was shown to measure myo-cardial energy and to accurately assess left ventricular mass as well (28). In the present study, no significant difference between athletes and controls was found regarding QRS voltage-duration product (P = 0.11), and left ventricular hypertrophy was found only in three athletes and in no controls (P = 0.23). However, a significant positive correlation was found between RMST (high-frequency ventricular activation energy) and VO2max as an effect of the conditioning
level achieved. The decision algorithm based on the non-co-variate variables included in the multivariate model showed 83.3% total predictive accuracy, and provides a refer-ence for predicting VO2max in trained
ath-Table 3. Multivariate logistic model variables as predictors of maximal aerobic power.
Variable ß coefficient SEM Walt test (χ²) P OR 95% CI
Constant -26.3 12.1 - - -
-LAS40 -0.029 0.071 0.177 0.67 0.97 0.83-1.12
RMST 0.09 0.04 12.76 <0.001 1.09 1.01-1.19
RMSSD 0.11 0.072 3.54 0.059 1.12 0.96-1.30
Mean-RR 0.012 0.012 3.35 0.067 1.01 0.99-1.02
letes. Thus, a high-frequency content of SAECG seems to be able to identify the compensatory ventricular remodeling caused by aerobic training, undetectable by conven-tional electrocardiographic measurements (26). Electrophysiological, mechanical and histological remodeling of the heart, which includes re-arrangement of cardiomyocyte dimensions and orientation during mechan-ical remodeling, changes in fiber-to-fiber gap junction distribution, remodeling of po-tassium and calcium channels, and an in-crease in extracellular matrix, has been di-rectly related to aerobic training, and, indi-vidually or in general, may influence the frequency content of the electrical wavefront propagation during normal ventricular acti-vation, accounting for a very unique electri-cal environment in the trained heart of healthy athletes (7,29,30). In practice, the logistic regression model was suitably adjusted to maximal aerobic power data and further di-chotomized both groups, enabling correct subject classification.
On the other hand, increased total high-frequency content energy (RMS area) and no abnormal prolongation of the ventricular activation in athletes without structural heart disease seem to represent a physiological aspect of electrical remodeling of the heart. Moroe et al. (31,32) found an 8.5% preva-lence of abnormal SAECG in a total of 796 athletes evaluated. Athletes who performed anaerobic exercise tended to exhibit a higher incidence of abnormal SAECG, which was associated with a smaller left ventricular mass (31,32). A comparable prevalence of positive SAECG was observed in the pres-ent study (8.3%). In a general population, the prevalence of abnormal SAECG was very similar (19).
Significant differences in HRV param-eters between sedentary and aerobically con-ditioned subjects have been established (20, 21,24,33), as well as the changes in the electrical properties of ventricular activation in both SAECG (1) and surface ECG (10,25).
Thus, it is possible to speculate that regular aerobic exercise and a further increase in VO2max due to conditioning cause autonomic
as well as electrophysiological changes in the heart, which are expressed as increased, HRV indexes and high-frequency content of the ventricular activation, respectively.
In the present study, SAECG and HRV time domain parameters were able to com-pose a predictive profile, accurately classi-fying trained and untrained healthy subjects according to maximal aerobic power. Fur-ther comments on conventional methods of assessment of aerobic fitness and the role of both SAECG and HRV analysis in this set-ting are necessary. The authors acknowl-edge that both ergospirometry and in-field exercise testing are standards for the assess-ment of physical conditioning. The ergospi-rometric test usually takes 12 to 20 min to assess aerobic conditioning, involves inter-pretation of complex data, and requires both trained personnel and expensive equipment, causing this approach to be limited to pro-fessional centers. In turn, in-field exercise testing is expected to assess athletes in real training conditions, and requires appropriate tracks which are frequently limited to pro-fessional groups and associations.
Limitations of the study
In the present study, maximum oxygen consumption was estimated by the Cooper method. Although the method appropriately estimated VO2max in the protocol applied to
both groups, a direct ergospirometric assess-ment of VO2max was not carried out.
The present data were derived from a group of high-performance long distance runners, a fact that may represent a limita-tion when these data are extrapolated to other athletic modalities. This study assessed healthy subjects with very distinct maximal oxygen consumption in order to enhance the differences in high-frequency content of the ventricular activation due to the level of aerobic conditioning. A longitudinal study with untrained subjects admitted to an aero-bic training program with regular follow-up of VO2max, echocardiographic
measure-ments of cardiac structures, and periodic SAECG acquisitions will provide informa-tion on both the mechanical and electrical remodeling process during physical condi-tioning, and permit further insights into the
development of high-frequency components of the ventricular activation.
Both HRV parameters and high-fre-quency electrical content of the ventricular activation assessed during resting conditions were increased in long-distance runners as compared to untrained healthy subjects, and accurately predicted maximal aerobic power. In particular, resting root mean squared volt-age of the ventricular activation (RMST) of SAECG is an independent predictor of on-track maximal oxygen consumption. We conclude that the SAECG represents a po-tential method to predict the state of aerobic conditioning of trained athletes.
Acknowledgments
The authors wish to acknowledge the Federation of Athletism of the State of Rio de Janeiro for kindly referring trained ath-letes for the present study, and Dr. Ivan Cordovil and Dr. José Barbosa-Filho, from the Laranjeiras National Institute of Cardiol-ogy for their support.
References
1. Moore RL, Korzick DH. Cellular adaptations of the myocardium to chronic exercise. Prog Cardiovasc Dis 1995; 37: 371-396. 2. Welsh L, Kemp JG, Roberts RG. Effects of physical conditioning on
children and adolescents with asthma. Sports Med 2005; 35: 127-141.
3. Ignone G, Giordano A, Tavazzi L. Effects of a short-term training programme in post-infarct patients with residual myocardial is-chaemia. Eur Heart J 1988; 9 (Suppl M): 13-21.
4. Pelliccia A, Maron BJ, Spataro A, Proschan MA, Spirito P. The upper limit of physiologic cardiac hypertrophy in highly trained elite athletes. N Engl J Med 1991; 324: 295-301.
5. Sharma S, Maron BJ, Whyte G, Firoozi S, Elliott PM, McKenna WJ. Physiologic limits of left ventricular hypertrophy in elite junior ath-letes: relevance to differential diagnosis of athlete’s heart and hyper-trophic cardiomyopathy. J Am Coll Cardiol 2002; 40: 1431-1436. 6. Smith GS, Vacek JL, Wilson DB, Hawkins JW, Boyer TA.
Exercise-induced alterations of signal-averaged electrocardiograms in mara-thon runners. Am Heart J 1989; 118: 1198-1202.
7. Barbosa EC, Barbosa PR, Bomfim AS, da Rocha PJ, Ginefra P. Precocious repolarization in athlete electrocardiogram: ionic basis
and vectorial model. Arq Bras Cardiol 2004; 82: 103-107.
8. Warburton DE, McGavock J, Welsh RC, Haykowsky MJ, Quinney HA, Taylor D, et al. Late potentials in female triathletes before and after prolonged strenuous exercise. Can J Appl Physiol 2003; 28: 153-164.
9. Raineri AA, Traina M, Lombardo RM, Rotolo A. Relation between late potentials and echocardiographically determined left ventricular mass in healthy subjects. Am J Cardiol 1991; 67: 425-427. 10. Raineri AA, Traina M, Rotolo A, Lombardo RM. Quantitative
analy-sis of ventricular late potentials in healthy subjects. Am J Cardiol
1990; 66: 1359-1362.
11. Cooper KH. A means of assessing maximal oxygen intake. Correla-tion between field and treadmill testing. JAMA 1968; 203: 201-204. 12. Cooper KH. Testing and developing cardiovascular fitness within
the United States Air Force. J Occup Med 1968; 10: 636-639. 13. Gasperin CA, Germiniani H, Facin CR, Souza AM, Cunha CL. An
analysis of electrocardiographic criteria for determining left ventricu-lar hypertrophy. Arq Bras Cardiol 2002; 78: 59-82.
Rela-tions to aging and risk of syncope. Circulation 1990; 81: 1803-1810. 15. Ryan SM, Goldberger AL, Ruthazer R, Mietus J, Lipsitz LA. Spectral analysis of heart rate dynamics in elderly persons with postprandial hypotension. Am J Cardiol 1992; 69: 201-205.
16. Barbosa PR, Barbosa-Filho J, de Sa CA, Barbosa EC, Nadal J. Reduction of electromyographic noise in the signal-averaged elec-trocardiogram by spectral decomposition. IEEE Trans Biomed Eng
2003; 50: 114-117.
17. Barbosa PRB, Barbosa-Filho J, De Sá CAM, Nadal J. A new method for reduction of the muscular respiratory noise in signal-averaging based on the spectral analysis of the heart beat. Comput Cardiol
1999; 26: 323-326.
18. Barbosa PR, Sousa MO, Barbosa EC, Bomfim AS, Ginefra P, Nadal J. Analysis of the prevalence of ventricular late potentials in the late phase of myocardial infarction based on the site of infarction. Arq
Bras Cardiol 2002; 78: 352-363.
19. Caref EB, Turitto G, Ibrahim BB, Henkin R, El-Sherif N. Role of bandpass filters in optimizing the value of the signal-averaged elec-trocardiogram as a predictor of the results of programmed stimula-tion. Am J Cardiol 1989; 64: 16-26.
20. Levy WC, Cerqueira MD, Harp GD, Johannessen KA, Abrass IB, Schwartz RS, et al. Effect of endurance exercise training on heart rate variability at rest in healthy young and older men. Am J Cardiol
1998; 82: 1236-1241.
21. Koutlianos NA, Kouidi EJ, Metaxas TI, Deligiannis AP. Non-invasive cardiac electrophysiological indices in soccer players with mitral valve prolapse. Eur J Cardiovasc Prev Rehabil 2004; 11: 435-441. 22. Warburton DER, Welsh RC, Haykowsky MJ, Taylor DA, Humen DP,
Dzavik V. Effects of half ironman competition on the development of late potentials. Med Sci Sports Exerc 2000; 32: 1208-1213. 23. Peidro RM. Cardiologia del deporte: el corazón del deportista. Rev
Argent Cardiol 2003; 71: 126-137.
24. Blumenthal JA, Sherwood A, Babyak MA, Watkins LL, Waugh R, Georgiades A, et al. Effects of exercise and stress management training on markers of cardiovascular risk in patients with ischemic
heart disease: a randomized controlled trial. JAMA 2005; 293: 1626-1634.
25. Jordaens L, Missault L, Pelleman G, Duprez D, De Backer G, Clement DL. Comparison of athletes with life-threatening ventricular arrhythmias with two groups of healthy athletes and a group of normal control subjects. Am J Cardiol 1994; 74: 1124-1128. 26. Okin PM, Roman MJ, Devereux RB, Kligfield P. Electrocardiographic
identification of increased left ventricular mass by simple voltage-duration products. J Am Coll Cardiol 1995; 25: 417-423.
27. Ginefra P, Barbosa EC, Barbosa PR, Bomfim AS, Boghossian SH, Salgado AA, et al. Detection of incipient left ventricular hypertrophy in mild to moderate arterial hypertension with normal electrocardio-gram and echocardioelectrocardio-gram: a new use for signal-averaged electro-cardiography. Arq Bras Cardiol 2003; 81: 79-84.
28. Vacek JL, Wilson DB, Botteron GW, Dobbins J. Techniques for the determination of left ventricular mass by signal-averaged electrocar-diography. Am Heart J 1990; 120: 958-963.
29. Kemi OJ, Haram PM, Loennechen JP, Osnes JB, Skomedal T, Wisloff U, et al. Moderate vs. high exercise intensity: differential effects on aerobic fitness, cardiomyocyte contractility, and endothe-lial function. Cardiovasc Res 2005; 67: 161-172.
30. Kemi OJ, Haram PM, Wisloff U, Ellingsen O. Aerobic fitness is associated with cardiomyocyte contractile capacity and endothelial function in exercise training and detraining. Circulation 2004; 109: 2897-2904.
31. Moroe K, Kimoto K, Inoue T, Annoura M, Oku K, Arakawa K, et al. Evaluation of abnormal signal-averaged electrocardiograms in young athletes. Jpn Circ J 1995; 59: 247-256.
32. Moroe K, Hiroki T. Signal-averaged electrocardiograms in young athletes - sudden death during exercise. Nippon Rinsho 1995; 53: 477-482.