AMTD
3, 333–357, 2010Standard generation and calibration system for volatile organic compounds
P. Veres et al.
Title Page Abstract Introduction Conclusions References Tables Figures
◭ ◮
◭ ◮
Back Close Full Screen / Esc
Printer-friendly Version Interactive Discussion
Atmos. Meas. Tech. Discuss., 3, 333–357, 2010 www.atmos-meas-tech-discuss.net/3/333/2010/ © Author(s) 2010. This work is distributed under the Creative Commons Attribution 3.0 License.
Atmospheric Measurement Techniques Discussions
This discussion paper is/has been under review for the journal Atmospheric Measure-ment Techniques (AMT). Please refer to the corresponding final paper in AMT
if available.
Development and validation of a portable
gas phase standard generation and
calibration system for volatile organic
compounds
P. Veres1,2, J. B. Gilman2,3, J. M. Roberts2, W. C. Kuster2, C. Warneke2,3, I. R. Burling4, and J. de Gouw2,3
1
Department of Chemistry and Biochemistry, University of Colorado, Boulder, CO 80309, USA
2
Chemical Sciences Division, Earth System Research Laboratory, National Oceanic and Atmospheric Administration, Boulder, CO 80305, USA
3
Cooperative Institute for Research in Environmental Sciences, University of Colorado, Boulder, CO 80309, USA
4
University of Montana, Department of Chemistry, Missoula, USA
Received: 8 January 2010 – Accepted: 11 January 2010 – Published: 29 January 2010 Correspondence to: P. Veres ([email protected])
AMTD
3, 333–357, 2010Standard generation and calibration system for volatile organic compounds
P. Veres et al.
Title Page Abstract Introduction Conclusions References Tables Figures
◭ ◮
◭ ◮
Back Close Full Screen / Esc
Printer-friendly Version Interactive Discussion
Abstract
We report on the development of an accurate, portable, dynamic calibration system for volatile organic compounds (VOCs). The Mobile Organic Carbon Calibration Sys-tem (MOCCS) combines the production of gas-phase VOC standards using perme-ation or diffusion sources with quantitative total organic carbon (TOC) conversion on a
5
palladium surface to CO2 in the presence of oxygen, and the subsequent CO2
mea-surement. MOCCS was validated using three different comparisons: (1) TOC of high accuracy methane standards compared well to expected concentrations (3% relative error), (2) a gas-phase benzene standard was generated using a permeation source and measured by TOC and gas chromatography mass spectrometry (GC-MS) with
10
excellent agreement (<4% relative difference), and (3) total carbon measurement of 4 known gas phase mixtures were performed and compared to a calculated carbon content to agreement within the stated uncertainties of the standards. Measurements from laboratory biomass burning experiments of formic acid by negative-ion proton-transfer chemical-ionization mass spectrometry (NI-PT-CIMS) and formaldehyde by
15
proton transfer reaction-mass spectrometry (PTR-MS), both calibrated using MOCCS, were compared to open path Fourier transform infrared spectroscopy (OP-FTIR) to validate the MOCCS calibration and were found to compare well (R2of 0.91 and 0.99
respectively).
1 Introduction
20
Volatile organic compounds (VOCs) are emitted to the atmosphere from a variety of sources, both natural and man-made. In the atmosphere, the photo-oxidation of VOCs leads to formation of ozone and organic aerosol, which are both significant pollutants and alter radiative forcing in the Earth’s climate system. Accurate measurements of ambient VOCs in the atmosphere or laboratory using analytical techniques such as
AMTD
3, 333–357, 2010Standard generation and calibration system for volatile organic compounds
P. Veres et al.
Title Page Abstract Introduction Conclusions References Tables Figures
◭ ◮
◭ ◮
Back Close Full Screen / Esc
Printer-friendly Version Interactive Discussion
gas-chromatography (Rappengluck et al., 2006) or PTR-MS (de Gouw and Warneke, 2007) rely on the accuracy of the calibration methods used. For many VOCs, but es-pecially for “sticky” compounds that have a high affinity for metal surfaces, accurate calibration systems are not readily available. VOC standards for instrument calibration are generally produced either statically or dynamically. Static methods rely on
mix-5
tures of gases in closed containers of known volume, while dynamic processes involve mixing a continuous flow of analyte into a dilution or carrier stream. A comprehensive review of standard generation processes for VOC can be found elsewhere (Barratt, 1981; Namiesnik, 1984; Naganowska-Nowak et al., 2005)
Modern static techniques most commonly utilize mixtures of gases in treated
high-10
pressure cylinders (Apel et al., 1994, 1998; Rappengluck et al., 2006). Static tech-niques are the preferred calibration method for many field and laboratory investiga-tions due to the portability and robust nature of high-pressure gas cylinders. Standard mixtures are stable for many VOCs; however, wall losses and degradation become significant for highly polar and reactive compounds.
15
Dynamic standard generation can avoid the problem of wall losses and degradation by continuously flowing analyte into a carrier stream. This method is more suitable for polar and reactive species which would otherwise be lost to surfaces at low mixing ra-tios (Barratt, 1981). The two most commonly used techniques are standard generation through the use of diffusion cells (Thompson and Perry, 2009; Altshuller and Cohen,
20
1960; Possanzini et al., 2000; Namiesnik et al., 1981; Williams et al., 2000) and perme-ation sources (Okeeffe and Ortman, 1966). Diffusion sources are often used in place of permeation sources when the latter is unavailable or behavior of a substance in a permeation source is nonideal (i.e. degredation, low permeation rate, etc.) (Barratt, 1981). A combination of static and dynamic standard generation is also often used
25
AMTD
3, 333–357, 2010Standard generation and calibration system for volatile organic compounds
P. Veres et al.
Title Page Abstract Introduction Conclusions References Tables Figures
◭ ◮
◭ ◮
Back Close Full Screen / Esc
Printer-friendly Version Interactive Discussion
Total carbon measurement by conversion to CO2and nondispersive infrared (NDIR) sensor analysis has long been used for analysis of a range of environmental samples ranging from natural waters to bulk collected aerosol particles. Total organic carbon (TOC) measurements of gas phase nonmethane hydrocarbons using oxidative cata-lysts, followed by reduction to methane, have been used in previous work (Maris et
5
al., 2003; Roberts et al., 1998). Ambient VOC levels are frequently below the detection limits of these gas phase TOC measurement techniques, which need to account for the large concentrations of ambient CO2, methane, and carbon monoxide and make them
unsuitable for ambient analyses. The TOC technique is however particularly well suited for the analysis of calibration standards where the mass loading can be user-varied to
10
fall within a measureable range and the effects of carrier gas CO2 can be eliminated. While the technique used here is similar to TOC methods utilizing the catalytic con-version of organic carbon, we use a direct measurement of the CO2 produced in this
process as a calibration measurement.
In this work we developed a mobile organic carbon calibration system (MOCCS) for
15
the generation and absolute measurements of calibrated VOC mixtures in air that is relatively inexpensive and easy to set up. The MOCCS combines the production of standards using permeation or diffusion sources, quantitative catalytic conversion of carbon containing species to CO2, and subsequent CO2 measurement. Validation of
this technique was performed in a three-part analysis: (1) two high accuracy methane
20
standards were analyzed and compared to their known concentrations, (2) comparison of measurements by gas chromatography mass spectrometry (GC-MS) and MOCCS of a benzene standard generated using a permeation source with the system described here, and (3) several complex gravimetrically prepared VOC standards were analyzed for total carbon content.
AMTD
3, 333–357, 2010Standard generation and calibration system for volatile organic compounds
P. Veres et al.
Title Page Abstract Introduction Conclusions References Tables Figures
◭ ◮
◭ ◮
Back Close Full Screen / Esc
Printer-friendly Version Interactive Discussion
2 Experimental details
2.1 Mobile Oxidative Carbon Calibration System (MOCCS)
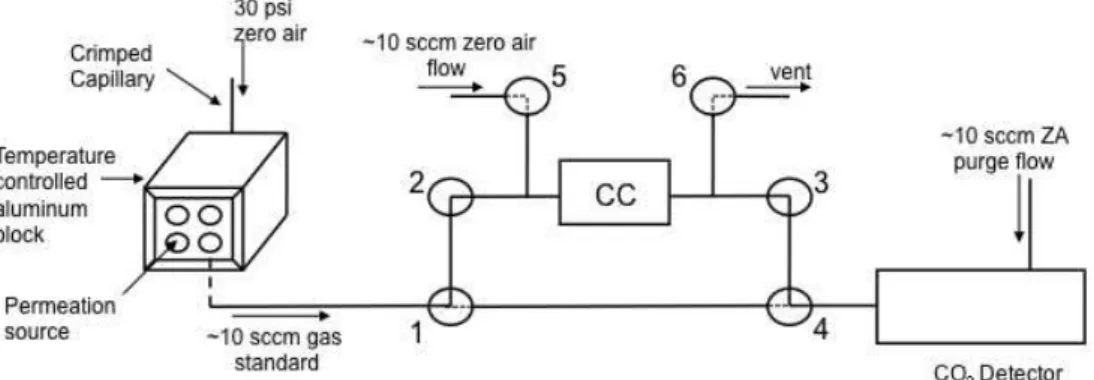
MOCCS, shown in Fig. 1, consists of 16 flow and temperature controlled permeation tube housings, a thermostated palladium catalyst at 350◦C to readily convert VOCs to CO2, and a CO2 detector (Beckman Industrial Model 870 NDIR or LI-COR LI-6252). 5
The entire assembly was mounted in a portable rack that includes a high-pressure zero air cylinder and an uninterruptable power supply. These features allow MOCCS to be temporarily removed from power for transport while providing continuous temperature control and flow over the permeation sources.
The housing was designed to hold 16 permeation sources at a controlled flow. Four
10
aluminum blocks were drilled for 1/2′′ o.d. PFA Teflon sleeves to house four perme-ation sources each. A temperature probe was inserted in the center of each block and the temperature regulated using individual controllers. Each permeation housing can be operated at a separate temperature with each block housing up to four perme-ation sources. Sections of 1/16′′o.d. stainless steel capillary tubing
∼15 cm long were 15
crimped until a flow of∼10 sccm was provided to each of the 16 channels at 30 psi.
Due to slight variations in the inlet pressure, the flow is measured for each channel at the time of calibration.
A typical permeation source calibration is based on the mass loss of the perme-ation tube and usually requires running for several weeks under stable conditions.
20
MOCCS measures real time emission rates of permeation sources after equilibrating within hours. As a result, any constant VOC source can be used thereby eliminating the necessity of obtaining certified permeation sources that can be quite costly. In this work, permeation sources were made in-house using pure compounds placed into 1/4′′ or 1/8′′Teflon permeation tubes purchased from VICI Metronics and sealed with Teflon
25
AMTD
3, 333–357, 2010Standard generation and calibration system for volatile organic compounds
P. Veres et al.
Title Page Abstract Introduction Conclusions References Tables Figures
◭ ◮
◭ ◮
Back Close Full Screen / Esc
Printer-friendly Version Interactive Discussion
The catalyst is comprised of a 3′′ length 1/4′′ o.d. stainless steel tube packed with 10% Pd on Kaowool (Johnson-Matthey, Ward Hill, MA.) and capped with a small amount of glass wool, to prevent the palladium from exiting the catalyst. A thermo-couple is attached to the midpoint of the stainless steel tubing and then wrapped in a single layer of insulated Nichrome wire. The finished catalyst is well insulated and
5
placed into an aluminum box with 1/4′′Swagelok bulkhead unions. A 24 Volt tempera-ture controller is used to supply power to the Nichrome wire and set the temperatempera-ture to 350◦C. This catalyst design is based on that used for PTR-MS background
measure-ments (de Gouw and Warneke, 2007).
The flow system was designed for the sample stream to be analyzed for both
back-10
ground CO2 in the carrier gas and total organic carbon. A schematic of the flow system is shown in Fig. 1. The system was designed to continuously cycle between background CO2 measurement and standard calibration on a user-defined timescale.
Background CO2measurements are made by flowing the carrier gas through the per-meation directly source into the CO2 analyzer bypassing the catalyst. Measuring the 15
background in this manner accounts for any CO2present in the carrier gas as well as
any potential interference from the IR absorption of VOCs. This background is sub-tracted from the total organic carbon measurement. The presence of VOCs in the carrier gas must also be corrected for by subtracting a TOC measurement of the car-rier gas (∼400 ppbv) prior to addition of a permeation source. The catalyst is kept 20
under constant flow by flushing with 10 sccm zero air when the background is being measured.
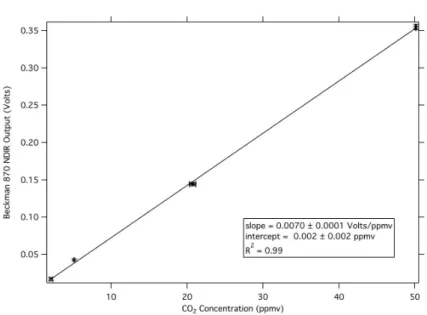
A Beckman Industrial Model 870 NDIR was used to measure the CO2concentrations for most results presented here. Four CO2standards in ultrapure air (Scott-Marin Inc.)
ranging from 2.065±0.207 ppmv up to 50.1±0.5 ppmv were used to calibrate the NDIR. 25
The results of the calibration are shown in Fig. 2. The precision in NDIR CO2 mea-surements through the calibrated concentration range was±1% of the measurement +30 ppbv. The accuracy of CO2 measurements through the 2 ppmv to 50 ppmv
AMTD
3, 333–357, 2010Standard generation and calibration system for volatile organic compounds
P. Veres et al.
Title Page Abstract Introduction Conclusions References Tables Figures
◭ ◮
◭ ◮
Back Close Full Screen / Esc
Printer-friendly Version Interactive Discussion
in both precision and accuracy were made by substitution of a LI-COR LI-6252 CO2 analyzer and will be presented later in this discussion.
This TOC technique has been previously used to calibrate standards from diffusion sources for organic acids in the development of negative-ion proton-transfer chemical-ionization mass spectrometry (NI-PT-CIMS) (Veres et al., 2008). The diffusion flow
sys-5
tem used in that particular study was identical to that described in Williams et al. (2000).
2.2 GC-MS
A custom built gas chromatograph with a quadrupole mass spectrometer detector (GC-MS) was used to independently verify the concentrations of two benzene standards generated and calibrated by the MOCCS. A detailed description of the GC-MS is
de-10
scribed by Goldan et al. (2004). The output of the benzene permeation tube was first diluted in humidified nitrogen by factors of 9.78 (±0.11)×10−4and 8.62 (±0.11)×10−4.
This was done in order to avoid overloading the GC-MS, which normally operates in the pptv to ppbv range. The GC-MS collected each sample directly from the diluted sample stream before subsequent analysis. A minimum of 10 replicate samples were analyzed
15
for each benzene concentration with an overall measurement precision of 3% or better. Benzene measured by the GC-MS was independently calibrated using more than 20 single- and multi-component VOC mixes with an overall measurement uncertainty of
±20%.
2.3 NI-PT-CIMS
20
Negative-ion proton-transfer chemical-ionization Mass Spectrometry (NI-PT-CIMS) provides gas-phase acid measurements with one-second time resolution. A detailed description of CIMS can be found elsewhere (Veres et al., 2008). Briefly, NI-PT-CIMS consists of (1) a210Po source to produce acetate ions (CH3C(O)O−) from acetic anhydride, (2) a flow tube reactor, in which CH3C(O)O− undergoes proton transfer
AMTD
3, 333–357, 2010Standard generation and calibration system for volatile organic compounds
P. Veres et al.
Title Page Abstract Introduction Conclusions References Tables Figures
◭ ◮
◭ ◮
Back Close Full Screen / Esc
Printer-friendly Version Interactive Discussion
reactions with inorganic and organic acids, (3) a collisional dissociation chamber (CDC) to decluster ions, and (4) a quadrupole mass spectrometer for the detection of both reagent and product ions.
2.4 OP-FTIR
The open path Fourier transform infrared (OP-FTIR) instrument included a Bruker
5
Matrix-M IR Cube spectrometer and a thermally stable open White cell. The White cell path length was set to 58 m. The spectral resolution was set to 0.67 cm−1 and the spectrometer acquired spectra every 1.5 s (four co-added spectra). A pressure transducer and two temperature sensors were located adjacent to the optical path and were logged on the instrument computer and used for spectral analysis. Mixing ratios
10
were obtained by multi-component fits to sections of the IR transmission spectra with a synthetic calibration non-linear least-squares method (Griffith, 1996; Yokelson et al., 2007).
2.5 PTR-MS
Proton transfer reaction-mass spectrometry (PTR-MS) utilizes proton-transfer
reac-15
tions of H3O+ to detect various atmospheric trace gases, usually as the MH+ion.
PTR-MS allows for the detection of numerous volatile organic compounds with high sensitivity (10–100 pptv) and response time (1–10 s). This technique has been used extensively in aircraft, ground-based and laboratory studies. A more complete discus-sion of the PTR-MS system used in this study can be found elsewhere (de Gouw and
20
Warneke, 2007).
2.6 Gas standards
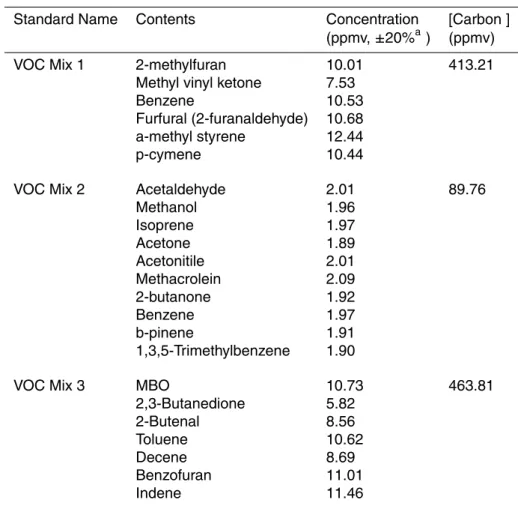
A detailed list of the standards used in this work is shown in Table 1. VOC mix 1–4 are high-pressure gas cylinder standards prepared at NOAA ESRL/CSD laboratory using gravimetric techniques. The error in each component in these laboratory-generated
AMTD
3, 333–357, 2010Standard generation and calibration system for volatile organic compounds
P. Veres et al.
Title Page Abstract Introduction Conclusions References Tables Figures
◭ ◮
◭ ◮
Back Close Full Screen / Esc
Printer-friendly Version Interactive Discussion
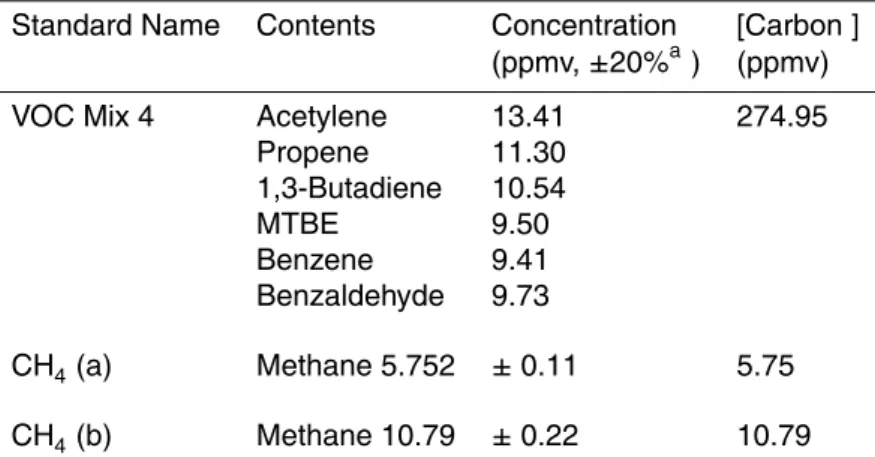
standards is estimated to be no greater than 20%. Two high accuracy methane stan-dards that were prepared gravimetrically with an uncertainty of±0.2% (Dlugokencky et
al., 2005) were borrowed from NOAA’s Global Monitoring Division (Boulder, CO) and analyzed for TOC. The stated standard concentrations of CH4 (a) and CH4 (b) were
5.75±0.11 ppmv and 10.79±0.22 ppmv respectively. A laboratory-made benzene per-5
meation source was equilibrated and calibrated by MOCCS for analysis.
3 Validation of the MOCCS
3.1 Data analysis
The results of the measurement of a benzene standard generated using the MOCCS as an example is shown in Fig. 3. Interpolated background measurements are
sub-10
tracted from the total organic carbon measurements to obtain a concentration for the source compound. Dividing the result by the number of carbons in the parent molecule (6) gives the original standard concentration on a molar basis, assuming a conversion ratio of 1:1 for the oxidation of carbon to CO2. The signal after the initial response time is then averaged to obtain an average standard concentration for each cycle. The inset
15
in Fig. 3 shows the stability of the MOCCS that had a measured precision of better than 1% over 5 days. All of the TOC measured concentrations reported here are the averages of a minimum of 10 cycles. The duration of each cycle can be readily ad-justed to allow for different time responses of the system to various compounds, which is dependent on their unique chemical properties (e.g. volatility, polarity, etc.).
20
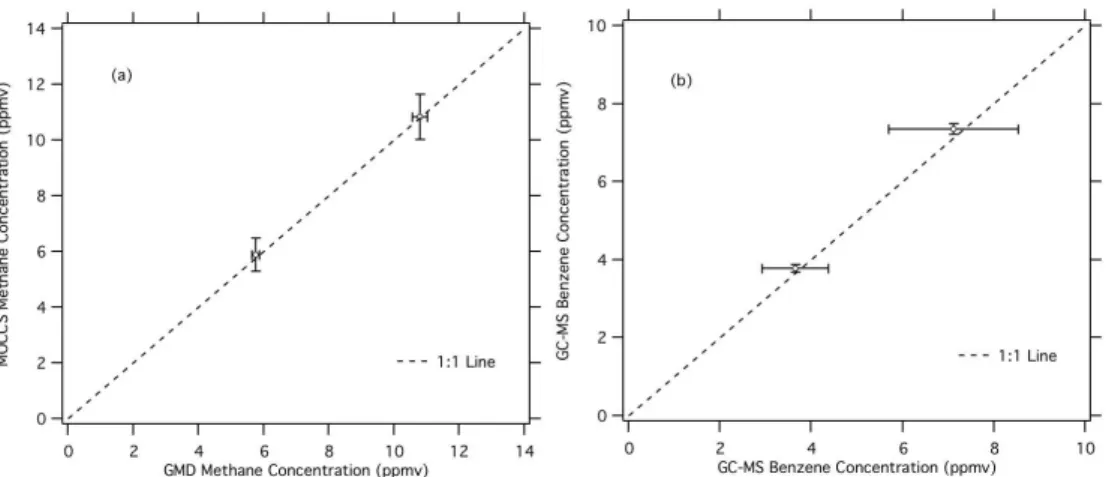
3.2 Methane conversion to CO2
The results of the two comparisons for the methane standards are shown in Fig. 4a as CH4 (a) and CH4 (b). The TOC determined methane concentration was
AMTD
3, 333–357, 2010Standard generation and calibration system for volatile organic compounds
P. Veres et al.
Title Page Abstract Introduction Conclusions References Tables Figures
◭ ◮
◭ ◮
Back Close Full Screen / Esc
Printer-friendly Version Interactive Discussion
errors in concentration between the TOC system and provided standard concentra-tion were less than 3% in both cases and the two determinaconcentra-tions agreed within the stated uncertainties.
3.3 Benzene conversion to CO2
A benzene permeation source in the MOCCS was measured using both GC-MS and
5
TOC. The results of the comparison are shown in Fig. 4b. Two permeation temper-ature settings were used to generate different concentrations, 7.36±0.14 ppmv and
3.79±0.10 ppmv as measured by TOC. The source output was diluted for analysis
with GC-MS: dilution factors of 9.78 (±0.11)×10−4and 8.62 (±0.11)×10−4were used.
GC-MS-measured benzene concentrations, after taking dilution into account, were
10
7.11±1.42 ppmv and 3.65±0.73 ppmv respectively. The relative difference between
TOC and GC-MS measurements is less than 4% for both standards measured.
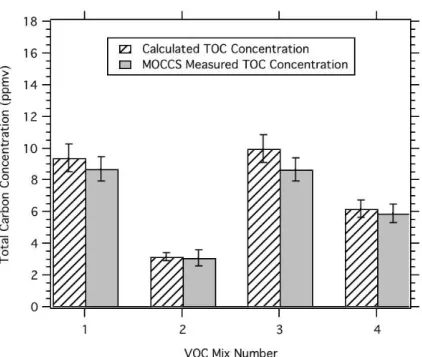
3.4 TOC of VOC standard mixtures
Results of the total carbon analysis are shown in Fig. 5 for each of the VOC mixtures available. The CO2concentration reported is the total carbon concentration of the
stan-15
dards (striped bars), also detailed in Table 1. Error in the NOAA generated standards is estimated to be about 10% based on the propagation of uncertainties in the gravimet-ric preparation method. TOC measured concentrations are shown in solid grey. Error (1σ) in the measurements shown in Fig. 4 represent the RMS of the standard deviation
from the average of multiple TOC cycles (5%), the error associated with the calibration
20
of the Beckman NDIR±4% of the measurement +400 ppbv, and error in the dilution
AMTD
3, 333–357, 2010Standard generation and calibration system for volatile organic compounds
P. Veres et al.
Title Page Abstract Introduction Conclusions References Tables Figures
◭ ◮
◭ ◮
Back Close Full Screen / Esc
Printer-friendly Version Interactive Discussion
3.5 MOCCS field calibration
MOCCS was recently used during the Smoke Understanding through Regional Fire Simulations (SMURFS) 2009 study preformed at the combustion facility at the US De-partment of Agriculture (USDA) Forest Service, Fire Sciences Laboratory (FSL) in Mis-soula, MT. A more in-depth discussion of the SMURFS 2009 study can be found in a
fu-5
ture publication (Veres et al., 2010). Briefly, emissions of controlled laboratory biomass fires were sampled directly from a stack in which the fire emissions were completely en-trained. A negative-ion proton-transfer chemical ionization mass spectrometer (NI-PT-CIMS) was calibrated for formic acid using a permeation standard that was generated and calibrated with MOCCS. A proton-transfer-reaction mass spectrometer (PTR-MS)
10
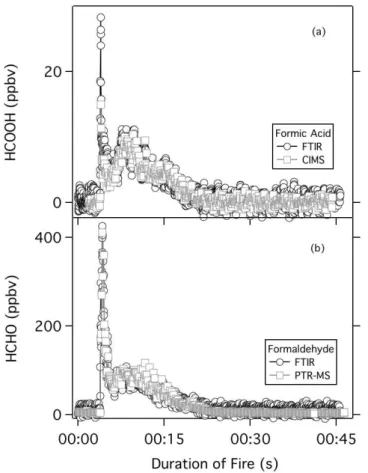
was calibrated for formaldehyde measurements using MOCCS. Simultaneous mea-surements of both formic acid and formaldehyde were made using open-path Fourier transform infrared spectrometer (OP-FTIR) and were used to validate the MOCCS cal-ibration of NI-PT-CIMS and PTR-MS. Figure 6 shows time profile for both formic acid, measured by NI-PT-CIMS and OP-FTIR, and formaldehyde, measured by PTR-MS and
15
OP-FTIR.
The results of a comparison of NI-PT-CIMS and OP-FTIR formic acid emission mea-surements from a single laboratory biomass fire are shown in Fig. 6a. A scatter plot of the data shown gives a NI-PT-CIMS/OP-FTIR formic acid ratio of 0.91±0.02 with a
correlation (R2) of 0.91. This agreement is well within the stated uncertainty of both 20
instruments. Figure 6b shows the results of a comparison of PTR-MS and OP-FTIR formaldehyde emission measurements from the same laboratory controlled biomass fire shown in Fig. 6a. The PTR-MS/OP-FTIR formaldehyde ratio is 1.06±0.02 with a
correlation (R2) of 0.99 from the corresponding scatter plot. The detection of
formalde-hyde by PTR-MS is humidity dependent (Hansel et al., 1997); however, the humidity
25
AMTD
3, 333–357, 2010Standard generation and calibration system for volatile organic compounds
P. Veres et al.
Title Page Abstract Introduction Conclusions References Tables Figures
◭ ◮
◭ ◮
Back Close Full Screen / Esc
Printer-friendly Version Interactive Discussion
The agreement between PTR-MS and OP-FTIR in this comparison is well within the estimated uncertainty of both instruments. The agreement between these two sets of independently calibrated measurements validates the use of the MOCCS for VOC standard production and calibration.
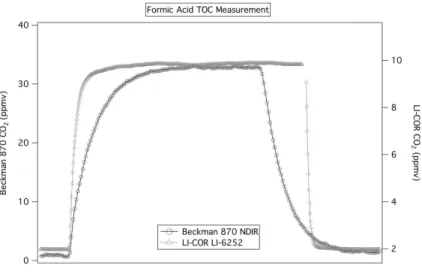
3.6 Comparison of CO2analyzers 5
A recent improvement to the MOCCS was the replacement of the Beckman model 870 NDIR CO2 analyzer with a LI-COR LI-6252 CO2 analyzer. Table 2 summarizes the
results of a comparison of the two CO2analyzers. Significant improvements in the in-strument response times and detection limits are observed with the LI-COR analyzer. Figure 7 shows the results of a comparison in formic acid response times and
detec-10
tion limits as defined by one complete MOCCS cycle. The formic acid response time, defined as the time required for a calibration signal to decay to 10% of the initial value when the source is removed, was approximately 90 s for the LI-COR compared to over 300 s for the Beckman analyzer. The detection limit for the compounds investigated in this study was determined from a signal-to-noise ratio of 2 as twice the standard
devi-15
ation in the background. The LI-COR detection limit of 5 ppbv was significantly lower than that of the Beckman analyzer, 150 ppbv. The precision in LI-COR CO2 measure-ments through the calibrated concentration range is±1% of the measurement+1 ppbv. The accuracy of LI-COR CO2measurements through the 2 ppmv to 50 ppmv
concen-tration range is ±1% of the measurement +80 ppbv. In addition to improvements in 20
precision, accuracy and detection limit, the overall error from the average of multiple TOC cycles is also reduced from 5% of the measurement to 1% when using the LI-COR analyzer. These improvements from use of the LI-LI-COR analyzer compared to the Beckman NDIR analyzer are significant and show that the accuracy of this technique is highly dependent on the type of CO2analyzer used.
AMTD
3, 333–357, 2010Standard generation and calibration system for volatile organic compounds
P. Veres et al.
Title Page Abstract Introduction Conclusions References Tables Figures
◭ ◮
◭ ◮
Back Close Full Screen / Esc
Printer-friendly Version Interactive Discussion
4 Conclusions
A portable system for the dynamic production and calibration of gas phase VOCs has been developed. We use a combination of catalytic reduction of VOCs to CO2and the subsequent measurement of the CO2 produced by an NDIR analyzer to standardize
calibration sources. We have validated the TOC measurement technique through total
5
carbon analysis of two high accuracy methane standards showing excellent agreement with 3% absolute error. MOCCS was validated further by the production and subse-quent calibration of a benzene standard by GC-MS and TOC with excellent agreement (<4% relative difference). Four laboratory prepared mixed VOC gas-phase standards
were analyzed for TOC and shown to be accurate to within 15%. The MOCCS
sys-10
tem is relatively inexpensive to develop in laboratory. It allows for dynamic generation and calibration of pure compounds, such as acids, which are not well suited for other commonly used standard generation processes. Additionally, MOCCS is particularly well suited for field deployment, as it is completely mobile. This technique represents a novel advancement in gas phase standard production and calibration for both VOCs
15
and potentially SVOCs.
Acknowledgements. The authors would like to thank Edward Dlugokencky for supplying the GMD methane standards used. We also want to thank Robert J. Yokelson for his role in the SMURFS 2009 study. This work was supported by the NOAA’s Health of the Atmosphere Pro-gram and NOAA’s Climate Goal, NSF Grant # ATM 1542457, the CIRES Innovative Research 20
Program, and DOD SERDP Grant Nos. SI-1648 and SI-1649.
References
Altshuller, A. P. and Cohen, I. R.: Application of diffusion cells to the production of known concentrations of gaseous hydrocarbons, Anal. Chem., 32, 802–810, 1960.
Apel, E. C., Calvert, J. G., and Fehsenfeld, F. C.: The nonmethane hydrocarbon intercompari-25
AMTD
3, 333–357, 2010Standard generation and calibration system for volatile organic compounds
P. Veres et al.
Title Page Abstract Introduction Conclusions References Tables Figures
◭ ◮
◭ ◮
Back Close Full Screen / Esc
Printer-friendly Version Interactive Discussion Apel, E. C., Calvert, J. G., Greenberg, J. P., Riemer, D., Zika, R., Kleindienst, T. E., Lonneman,
W. A., Fung, K., and Fujita, E.: Generation and validation of oxygenated volatile organic carbon standards for the 1995 southern oxidants study nashville intensive, J. Geophys. Res.-Atmos., 103, 22281–22294, 1998.
Barratt, R. S.: The preparation of standard gas-mixtures – a review, Analyst, 106, 817–849, 5
1981.
de Gouw, J. A. and Warneke, C.: Measurements of volatile organic compounds in the earth’s atmosphere using proton-transfer-reaction mass spectrometry, Mass Spec. Rev., 26, 223– 257, 2007.
Dlugokencky, E. J., Myers, R. C., Lang, P. M., Masarie, K. A., Crotwell, A. M., Thoning, K. W., 10
Hall, B. D., Elkins, J. W., and Steele, L. P.: Conversion of noaa atmospheric dry air CH4 mole fractions to a gravimetrically prepared standard scale, J. Geophys. Res.-Atmos., 110, D18306, doi:10.1029/2005jd006035, 2005.
Griffith, D. W. T.: Synthetic calibration and quantitative analysis of gas-phase ft-ir spectra, Appl. Spectrosc., 50, 59–70, 1996.
15
Hansel, A., Singer, W., Wisthaler, A., Schwarzmann, M., and Lindinger, W.: Energy dependen-cies of the proton transfer reactions H3O(+)+CH2O double left right arrow CH2OH++H2O, Int. J. Mass Spectrom., 167, 697–703, 1997.
Maris, C., Chung, M. Y., Lueb, R., Krischke, U., Meller, R., Fox, M. J., and Paulson, S. E.: De-velopment of instrumentation for simultaneous analysis of total non-methane organic carbon 20
and volatile organic compounds in ambient air, ISI:000185829200010, S149–S158, 2003. Naganowska-Nowak, A., Konieczka, P., Przyjazny, A., and Namiesnik, J.: Development of
tech-niques of generation of gaseous standard mixtures, CRC. Cr. Rev. Anal. Chem., 35, 31–55, doi:10.1080/10408340590947916, 2005.
Namiesnik, J., Torres, L., Kozlowski, E., and Mathieu, J.: Evaluation of the suitability of selected 25
porous polymers for preconcentation of volatile organic-compounds, J. Chromatogr., 208, 239–252, 1981.
Namiesnik, J.: Generation of standard gaseous-mixtures, J. Chromatogr., 300, 79–108, 1984. Okeeffe, A. E. and Ortman, G. C.: Primary standards for trace gas analysis, Anal. Chem., 38,
760–763, 1966. 30
AMTD
3, 333–357, 2010Standard generation and calibration system for volatile organic compounds
P. Veres et al.
Title Page Abstract Introduction Conclusions References Tables Figures
◭ ◮
◭ ◮
Back Close Full Screen / Esc
Printer-friendly Version Interactive Discussion Rappengluck, B., Apel, E., Bauerfeind, M., Bottenheim, J., Brickell, P., Cavolka, P., Cech, J.,
Gatti, L., Hakola, H., Honzak, J., Junek, R., Martin, D., Noone, C., Plass-Dulmer, C., Travers, D., and Wang, D.: The first voc intercomparison exercise within the global atmosphere watch (gaw), Atmos. Environ., 40, 7508–7527, doi:10.1016/j.atmosenv.2006.07.016, 2006.
Roberts, J. M., Bertman, S. B., Jobson, T., Niki, H., and Tanner, R.: Measurement of total non-5
methane organic carbon (c-y): Development and application at chebogue point, nova scotia, during the 1993 north atlantic regional experiment campaign, J. Geophys. Res.-Atmos., 103, 13581–13592, 1998.
Thompson, J. M. and Perry, D. B.: A new system of refillable and uniquely identifiable diff u-sion tubes for dynamically generating voc and svoc standard atmospheres at ppm and ppb 10
concentrations for calibration of field and laboratory measurements, J. Environ. Monit., 11, 1543–1544, doi:10.1039/b901954e, 2009.
Veres, P., Roberts, J. M., Warneke, C., Welsh-Bon, D., Zahniser, M., Herndon, S., Fall, R., and de Gouw, J.: Development of negative-ion proton-transfer chemical-ionization mass spec-trometry (ni-pt-cims) for the measurement of gas-phase organic acids in the atmosphere, 15
Int. J. Mass Spectrom., 274, 48–55, 2008.
Veres, P., Roberts, J. M., Burling, I. R., Warneke, C., Gouw, J. d., and Yokelson, R.: Measure-ment of gas-phase inorganic and organic acids from biomass fires by negatiove-ion proton-transfer chemical-ionization mass spectrometry (ni-pt-cims), J. Geophys. Res.-Atmos., sub-mitted, 2010.
20
Williams, J., Roberts, J. M., Bertman, S. B., Stroud, C. A., Fehsenfeld, F. C., Baumann, K., Buhr, M. P., Knapp, K., Murphy, P. C., Nowick, M., and Williams, E. J.: A method for the airborne measurement of pan, ppn, and mpan, J. Geophys. Res.-Atmos., 105, 28943–28960, 2000. Yokelson, R. J., Karl, T., Artaxo, P., Blake, D. R., Christian, T. J., Griffith, D. W. T., Guenther, A.,
and Hao, W. M.: The Tropical Forest and Fire Emissions Experiment: overview and airborne 25
AMTD
3, 333–357, 2010Standard generation and calibration system for volatile organic compounds
P. Veres et al.
Title Page Abstract Introduction Conclusions References Tables Figures
◭ ◮
◭ ◮
Back Close Full Screen / Esc
Printer-friendly Version Interactive Discussion
Table 1.Standard Gas Mixtures.
Standard Name Contents Concentration [Carbon ]
(ppmv,±20%a) (ppmv)
VOC Mix 1 2-methylfuran 10.01 413.21
Methyl vinyl ketone 7.53
Benzene 10.53
Furfural (2-furanaldehyde) 10.68 a-methyl styrene 12.44
p-cymene 10.44
VOC Mix 2 Acetaldehyde 2.01 89.76
Methanol 1.96
Isoprene 1.97
Acetone 1.89
Acetonitile 2.01
Methacrolein 2.09
2-butanone 1.92
Benzene 1.97
b-pinene 1.91
1,3,5-Trimethylbenzene 1.90
VOC Mix 3 MBO 10.73 463.81
2,3-Butanedione 5.82
2-Butenal 8.56
Toluene 10.62
Decene 8.69
Benzofuran 11.01
Indene 11.46
a
AMTD
3, 333–357, 2010Standard generation and calibration system for volatile organic compounds
P. Veres et al.
Title Page Abstract Introduction Conclusions References Tables Figures
◭ ◮
◭ ◮
Back Close Full Screen / Esc
Printer-friendly Version Interactive Discussion
Table 1.Continued.
Standard Name Contents Concentration [Carbon ] (ppmv,±20%a) (ppmv)
VOC Mix 4 Acetylene 13.41 274.95
Propene 11.30
1,3-Butadiene 10.54
MTBE 9.50
Benzene 9.41
Benzaldehyde 9.73
CH4(a) Methane 5.752 ±0.11 5.75
CH4(b) Methane 10.79 ±0.22 10.79
a
AMTD
3, 333–357, 2010Standard generation and calibration system for volatile organic compounds
P. Veres et al.
Title Page Abstract Introduction Conclusions References Tables Figures
◭ ◮
◭ ◮
Back Close Full Screen / Esc
Printer-friendly Version Interactive Discussion
Table 2.Performance of MOCCS with the Beckman Industrial Model 870 NDIR and the LI-COR LI-6252.
Beckman 870 LI-6252
Response time∗ 300 s 90 s
TOC Detection Limit 150 ppbv 5 ppbv
TOC Accuracy ±4% of the measurement ±1% of the measurement
+400 ppbv +80 ppbv
TOC Precision ±1% of the measurement ±1% of the measurement
+30 ppbv +1 ppbv
Error on replicate TOC cycles 5% 1%
∗
AMTD
3, 333–357, 2010Standard generation and calibration system for volatile organic compounds
P. Veres et al.
Title Page Abstract Introduction Conclusions References Tables Figures
◭ ◮
◭ ◮
Back Close Full Screen / Esc
Printer-friendly Version Interactive Discussion
AMTD
3, 333–357, 2010Standard generation and calibration system for volatile organic compounds
P. Veres et al.
Title Page Abstract Introduction Conclusions References Tables Figures
◭ ◮
◭ ◮
Back Close Full Screen / Esc
Printer-friendly Version Interactive Discussion
AMTD
3, 333–357, 2010Standard generation and calibration system for volatile organic compounds
P. Veres et al.
Title Page Abstract Introduction Conclusions References Tables Figures
◭ ◮
◭ ◮
Back Close Full Screen / Esc
Printer-friendly Version Interactive Discussion
AMTD
3, 333–357, 2010Standard generation and calibration system for volatile organic compounds
P. Veres et al.
Title Page Abstract Introduction Conclusions References Tables Figures
◭ ◮
◭ ◮
Back Close Full Screen / Esc
Printer-friendly Version Interactive Discussion
AMTD
3, 333–357, 2010Standard generation and calibration system for volatile organic compounds
P. Veres et al.
Title Page Abstract Introduction Conclusions References Tables Figures
◭ ◮
◭ ◮
Back Close Full Screen / Esc
Printer-friendly Version Interactive Discussion
AMTD
3, 333–357, 2010Standard generation and calibration system for volatile organic compounds
P. Veres et al.
Title Page Abstract Introduction Conclusions References Tables Figures
◭ ◮
◭ ◮
Back Close Full Screen / Esc
Printer-friendly Version Interactive Discussion
AMTD
3, 333–357, 2010Standard generation and calibration system for volatile organic compounds
P. Veres et al.
Title Page Abstract Introduction Conclusions References Tables Figures
◭ ◮
◭ ◮
Back Close Full Screen / Esc
Printer-friendly Version Interactive Discussion