ISSN 1553-3468
© 2012 R. Paranthaman et al., This open access article is distributed under a Creative Commons Attribution (CC-BY) 3.0 license
Corresponding Author: Paranthaman, R.,Technical Assistant Food Testing Laboratory Indian Institute of Crop Processing Technology, Ministry of Food Processing Industries, Govt. of India Thanjavur-613 005 (TamilNadu), India
1
Determination of Pesticide Residues
in Banana by Using High Performance Liquid
Chromatography and Gas Chromatography-Mass Spectrometry
Paranthaman, R., A. Sudha and S. Kumaravel
Food Testing Laboratory Indian Institute of Crop Processing Technology,
Ministry of Food Processing Industries,
Govt. of India Thanjavur-613 005 (TamilNadu), India
Abstract: Problem statement: The occurrence of endosulfan, carbendazim, chloropyripos in 10 banana samples in southern area of Tamilnadu, India (hill banana, karpuravalli, monthan, nendran, ney poovan, pachanadan, poovan, rasthali, red banana, robusta) was investigated. Approach: In 7 samples, Carbendazim was found at concentrations ranging from 0.002-0.11 mg kg−1. In three samples, carbendazim was not found, whereas endosulfan, chloropyripos was not detected in any sample.
Results: Analysis was carried out using HPLC-UV and samples were confirmed by GC-MS. The seven samples contained carbendazim that not exceeded the FAO/WHO codex alimentarius standards for MRLs (Maximum Residue Limit) values of carbendazim pesticide on banana (whole) is 1.0 mg kg−1. Conclusion/Recommendations: Based on the HPLC results carbendazim is finding in Hill banana (0.007 mg kg−1), Monthan (0.019 mg kg−1), Nendran (0.002 mg kg−1), Pachanadan (0.007 mg kg−1), Poovan (0.016 mg kg−1), Rasthali (0.017 mg kg−1) and Robusta (0.11 mg kg−1) and carbendazim is not finding Karpuravalli, Ney poovan and Red banana. Endosulfan, Chloropyrifos and Carbendazim in Robusta Banana sample are identified by matching their retention times and characteristic ion. TIC chromatogram for a positive Robusta Banana sample.
Key words: Gas Chromatography-Mass Spectrometry (GC-MS), commercialization conditions, important components, Gel Permeation Chromatography (GPC)
INTRODUCTION
Banana (Musa paradisiacal L.) is the fruit with the highest consumption in the Indian market. It is an excellent tropical fruit, has an agreeable flavour and a high nutritional value. The contribution to the intake of sugars, fibre, vitamins and minerals from the consumption of bananas is high, with a very low contribution to the intake of fat. It is one of the most important components of the human diet in different countries, where it is consumed in its raw form, home-cooked or processed as juice or paste. Banana should be considered to be a good source of natural antioxidant for foods and functional food source against cancer and heart disease. There are many variables that influence the chemical composition of bananas, such as methods of cultivation, fertilizers and pesticides used quality of water for irrigation, or storage and commercialization conditions. Benzimidazole fungicides are systemic pesticides, widely used in agriculture for pre- and post-harvest treatment for the control of a wide range of fruit and vegetable pathogens (Papadopoulou-Mourkidou, 1991).
Simultaneous and consecutive analytical methods for pesticide residues in large numbers of food samples using acetonitrile extraction, followed by Gel Permeation Chromatography (GPC) and mini cartridge column cleanup and then dual-column GC equipped with ECD was investigated by (Ueno et al., 2004). In the present work, a chromatographic methodology was used to identify pesticide residues in different banana samples produced in Tamilnadu. Ten banana samples were collected market, Trichy, Tamilnadu, India and were analyzed in our laboratory. The simultaneous determination of Endosulfan, carbendazim and Chlorpyrifos residues was carried out by HPLC-UV and GC-MS.
MATERIALS AND METHODS
Methodology employed for pesticide residue analysis: Extraction of pesticide residues from variety of bananas with different solvents and their detection and quantification by different analytical techniques are the major steps involved in pesticide residue analysis.
HPLC analysis: A critical review of literature showed that different solvents such as n-hexane, petroleum ether, methyl chloride and acetone or ethyl acetate have been used for extraction of pesticide residue from fruits (Coulston and Korte, 1975). Many workers used acetonitrile for extraction of pesticides from fruits instead of Methylene chloride, which is hazardous to the environment (Cook et al., 1999; Krause and August, 1983) in the present study, for the extraction of pesticide residue from banana fruit samples the et al
method was followed with little modification.
Sample preparation: Homogenize 50 g chopped sample with 100 mL acetonitrile. Add 10 g sodium chloride (= 8mL in a graduated cylinder). Homogenize 5 min. Transfer ~13 mL of acetonitrile (top) layer to 15mL graduated centrifuge tube. Add ~3g sodium sulfate (liquid level to 15 mL mark), cap, shake well to remove water. Centrifuge at high speed for 5 min. Transfer 10 mL aliquot (= 5g of sample) to a clean 15 mL tube. Evaporate to 0.5mL under clean nitrogen. Elute pesticides with 20 mL acetonitrile/toluene (3:1). Using a rotary evaporator, concentrate sample to ~2 mL. Add 2×10 mL acetone, concentrating the material to ~2mL after each addition, to make a solvent exchange to acetone. Transfer quantitatively to a clean 15 mL tube.
HPLC conditions: A Shimadzu CLASS-VP V6.13 SP2 Area% Report, Version 5.22 High performance liquid chromatography having UV/visible detector was used for identification and quantification of pesticides. Separation was performed on Luna C18 Colum. Samples were injected manually through a Rheodyne injector. Detector was connected to the computer for data processing. The working condition of HPLC was binary gradient, mobile phase was acetonitrile: water; (70:30), flow rate was 1 mL min-1, injection volume was 20 L and the wavelength of the UV/visible detector was fixed at 254 nm for the residual analysis of three pesticides chlorpyrifos carbendazim and endosulfan.
GC-MS analysis:
Sample preparation: Before the extraction process and preconcentration, the samples were made into a concentrate juice (50% w/v) in distillated water. Then, fresh juice was centrifuged at 4000 r.p.m. for 15 m and the supernatant liquid portion was filtered through a 0.45 m nylon filter. After filtration, the juice was diluted with a water-methanol mixture (1:1% v/v) and stirred by 2 h in a screw cap vial containing small
magnetic stirrer bar. The combined extracts were transferred to a separating funnel.
The filtrate solution was percolated on cartridge C18 (at a descending flow rate of 2 mL min−1). Elution was performed with 5 mL of ethyl acetate. Then, the sample was concentrated to dryness by evaporation under inert conditions at constant flow rate of the N2 gas. The final residue was dissolved in 1 mL of acetonitrile water (4: 1% v/v) at pH 4. 1 L of injection volume was used for the chromatographic system.
GC-MS conditions: GC analysis (Steven et al., 2005) was conducted on a GC Perkin-Elmer-Clarus-500 plus MS Perkin- Elmer-Clarus-500 (Column: Elite-1 (100% Dimethyl poly siloxane), 30×0.25 mm × 1µ mdf, with the following conditions: He constant flow, 1.3 mL/min; initial inlet temperature, 80°C ramped to 280-200°C/min after a 30 s delay; injection volume, 5 mL (LVI) onto a Carbofrit plug in the liner with an open purge valve (30:1 split ratio) for 24 s, closed until 3.5 min and open again (30:1) until the end of the run; oven temperature program, 75°C for 3 min, then 25°C/min ramp to 180°C followed by a 5°C/min ramp to 300°C and held for 3 min (total run time: 34.2 min). Mass detector: Turbo mass gold-Perkin Elmer Software: Turbomass 5.4.2, The MS instrument transfer line temperature was 240°C, with 230°C ion trap and 120°C manifold temperatures. MS Programme: Library used: NIST Version-Year 2005, Inlet line temperature: 200°C, Source temperature: 200°C, Electron energy: 70 eV, Mass scan: (m/z): 45-450, Total MS running time: 36 min. The individual constituents showed by GC were identified by comparing their MS with standard compounds of NIST library.
RESULTS
Both the chromatographic techniques i.e., High Performance Liquid Chromatography (HPLC) for all samples and Gas chromatography-Mass Spectrometry (GC-MS) for one sample were used for the determination of pesticides in fruit samples in the present study.
Identification and quantification by HPLC: RP-HPLC method for the identification of pesticide residues and the chromatographic separations of Retention time (Rt), Endosulfan (Rt-2.250), Chloropyrifos 3.208) and Carbendazim (Rt-5.050) and their standards have been shown in Fig. 1 and Table 1.
3 Fig. 1: Standard chromatogram of pesticides standard
Table 1: HPLC validation data for pesticides standard
Detector A (254nm)
---
Retention ESTD
PK # Time Area Height Name Concentration Units 1 2.250 17602758 1940148 ENDOSULFAN 10.000 CAL µg/µL 2 3.208 7510881 978118 CHLOROPYRIFOS 10.000 CAL µg/µL 3 5.050 3624293 167220 CARBENDAZIM 10.000 CAL µg/µL
Table 2: HPLC Validation data for Pesticides residues in Banana sample
Detector A (254 nm)
--- Sample Retention time Area Height Concentration (mg/kg)
Hill banana 5.017 2526 347 0.007
Karpuravalli Not Not Not Not
detected detected detected detected
Monthan 5.300 6952 605 0.019
Nendran 5.250 750 100 0.002
Ney poovan Not Not Not Not
detected detected detected detected
Pachanadan 5.125 2628 227 0.007
Poovan 4.992 5717 523 0.016
Rasthali 4.992 6196 511 0.017
Red banana Not Not Not Not
detected detected detected detected
Robusta 5.158 3914 317 0.11
Table 3: GC-MS Validation data for pesticides residues in robusta
banana sample
Sample Compound Mass number
analyzed name referred Result
Endosulfan 195, 241, Absent
265, 339, 406
Robusta Carbendazim 105, 132, Present
Banana 146, 159, 191
Chloropyripos 97, 125, 1 Absent
97, 314, 349
(a)
(c)
(d)
(e)
(f)
5 Fig. 3: GC-MS Chromatogram of Robusta Banana
sample
Fig. 4: GC-MS Spectrum of robusta banana sample
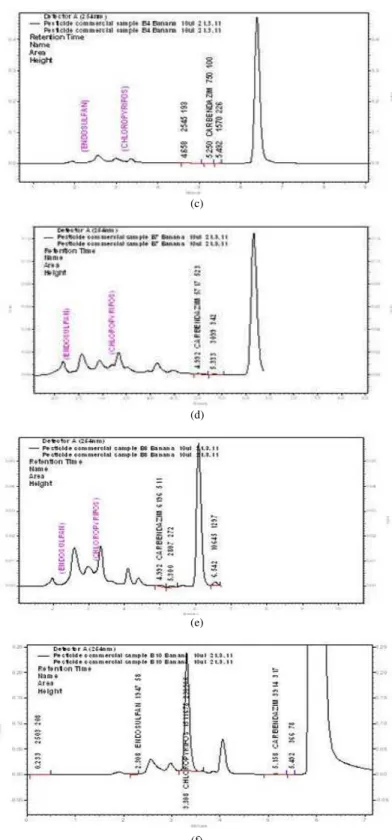
The content of each pesticide was calculated from the corresponding calibration curve and presented as the mean of five determinations as shown in Table 1. The HPLC Result based on the Retention time (Rt), Carbendazim (Rt-5.050) content in banana samples was given in Fig. 2a-f, Carbendazim was detected and the amount was below the MRL value (1 mg kg-1) in the 10 samples. Based on the the HPLC results carbendazim was found in Hill banana (0.007 mg kg−1), Monthan (0.019 mg kg−1), Nendran (0.002 mg kg−1), Pachanadan (0.007 mg kg−1), Poovan (0.016 mg kg−1), Rasthali (0.017 mg kg−1) and Robusta (0.11 mg kg−1) and carbendazim was not found Karpuravalli, Ney poovan Red banana given in Table 2.
Based on the HPLC results carbendazim was found in Hill banana (0.007 mg kg−1), Monthan (0.019 mg kg−1), Nendran (0.002 mg kg−1), Pachanadan (0.007 mg kg−1), Poovan (0.016 mg kg−1), Rasthali (0.017 mg kg−1) and Robusta (0.11 mg kg−1) and carbendazim was not found Karpuravalli, Ney poovan Red banana given in Table 2.
Gas chromatography-mass spectrometry (GC-MS):
Endosulfan, Chloropyrifos and Carbendazim in Robusta Banana sample were identified by matching their
retention times and characteristic ions with those of standards given in Table 3. A GC-MS-TIC chromatogram for a positive Robusta Banana sample is reported in Fig. 3 and 4.
DISCUSSION
The pesticides were identified by comparing its retention time with respect to technical grade reference standards. The quantitative determination was carried out with the help of a calibration curve drawn from chromatographic experiments with standard solution of pesticides. The main problem faced was resolving the pesticide peaks from possible interfering coextractives from sample matrices. For this reason, in the process of development of GC methods we were looking for high resolution of chromatographic peaks and to reach lower limits of detection. Selective and sensitive detectors, as in ECD, provided good responses even to very low concentrations. In many cases MS detection has been employed for quantitation in our work, however, we only performed MS for confirmation of peak identity.
CONCLUSION
In this study the HPLC and GCMS multiresidue method used to determine pesticides in banana samples less time and low detection limit. The results of our monitoring indicate that, among 10 samples of bananas that were examined, only seven samples contained carbendazim that not exceeded the FAO/WHO Codex Alimentarius Maximum Residue Limits (MRLs) (Codex Alimentarius Commission, 1996). In addition, the obtained results clearly indicate the actual situation of the misuse of insecticides which may affect in turn at long period the consumers health.
ACKNOWLEDGMENT
The reaches deeply thanks the Dr.K. Alagusundaram, Director, Indian Institute of Crop Processing Technology, Ministry of Food Processing Industries, Government of India, Thanjavur for Providing all the facilities and support used to carry out the work.
REFERENCES
Cook, J., M.P. Beckett, B. Reliford, W. Hammock and M. Engel, 1999. Multiresidue analysis of pesticides in fresh fruits and vegetables using procedures developed by the florida department of agriculture and consumer services. J. AOAC, 82: 1419-1435. Coulston, F. and F. Korte, 1975. EQS: Environmental
Krause, R.T. and E.M. August, 1983. Application of multiresidue method and high performance liquid chromatography for determining quinomethionate in apples and orange. J. AOAC., 66: 1018-1022. PMID: 6885686
Papadopoulou-Mourkidou, E., 1991. Post-harvest-applied agrichemicals and their residues in fresh fruits and vegetables. J. Assoc. Chem., 74: 745-765. PMID: 1783584
Steven, J., A.D. Lehotay, K.M. Hiemstra and P.V. Bodegraven, 2005. Validation of a fast and easy method for the determination of residues from 229 pesticides in fruits and vegetables using gas and liquid chromatography and mass spectrometric detection. J. AOAC Int., 88: 595-614.
Tuinstra, L.G.M.T., A.H. Roos, A.M. Matser, W.A. Traag and J.A. Rhijn, 1991. Development of a multi-residue/multi-matrix method for pesticide analysis in agricultural products. J. Chromatogr, 339: 384-386. DOI: 10.1007/BF00322353