Significant Effects of Oral Phenylbutyrate
and Vitamin D3 Adjunctive Therapy in
Pulmonary Tuberculosis: A Randomized
Controlled Trial
Akhirunnesa Mily1☯‡
, Rokeya Sultana Rekha1,2☯‡
, S. M. Mostafa Kamal3, Abu Saleh Mohammad Arifuzzaman1, Zeaur Rahim1, Lamia Khan1, Md. Ahsanul Haq1,
Khaliqu Zaman1, Peter Bergman2, Susanna Brighenti4, Gudmundur H. Gudmundsson5, Birgitta Agerberth2, Rubhana Raqib1*
1International Centre for Diarrheal Disease Research, Bangladesh (icddr,b), Mohakhali, Dhaka-1212 Bangladesh,2Department of Laboratory Medicine, Clinical Microbiology, Karolinska Institutet, Karolinska University Hospital, Stockholm, Sweden,3National Institute of the Diseases of the Chest and Hospital, Mohakhali, Dhaka, Bangladesh,4Center for Infectious Medicine, Karolinska Institutet, Karolinska University Hospital, Stockholm, Sweden,5Biomedical Center, University of Iceland, 101 Reykjavik, Iceland
☯These authors contributed equally to this work. ‡These authors are first authors on this work.
Abstract
Background
Development of new tuberculosis (TB) drugs and alternative treatment strategies are urgently required to control the global spread of TB. Previous results have shown that vita-min D3(vitD3) and 4-phenyl butyrate (PBA) are potent inducers of the host defense peptide
LL-37 that possess anti-mycobacterial effects.
Objective
To examine if oral adjunctive therapy with 5,000IU vitD3or 2x500 mg PBA or PBA+vitD3to
standard chemotherapy would lead to enhanced recovery in sputum smear-positive pulmo-nary TB patients.
Methods
Adult TB patients (n = 288) were enrolled in a randomized, double-blind, placebo-controlled trial conducted in Bangladesh. Primary endpoints included proportions of patients with a negative sputum culture at week 4 and reduction in clinical symptoms at week 8. Clinical assessments and sputum smear microscopy were performed weekly up to week 4, fort-nightly up to week 12 and at week 24; TB culture was performed at week 0, 4 and 8; con-centrations of LL-37 in cells, 25-hydroxyvitamin D3(25(OH)D3) in plasma andex vivo
bactericidal function of monocyte-derived macrophages (MDM) were determined at week 0, 4, 8, 12 and additionally at week 24 for plasma 25(OH)D3.
OPEN ACCESS
Citation:Mily A, Rekha RS, Kamal SMM, Arifuzzaman ASM, Rahim Z, Khan L, et al. (2015) Significant Effects of Oral Phenylbutyrate and Vitamin D3 Adjunctive Therapy in Pulmonary Tuberculosis: A Randomized Controlled Trial. PLoS ONE 10(9): e0138340. doi:10.1371/journal.pone.0138340
Editor:Nerges Mistry, The Foundation for Medical Research, INDIA
Received:March 29, 2015
Accepted:August 26, 2015
Published:September 22, 2015
Copyright:© 2015 Mily et al. This is an open access article distributed under the terms of theCreative Commons Attribution License, which permits unrestricted use, distribution, and reproduction in any medium, provided the original author and source are credited.
Data Availability Statement:All data underlying the findings in our study are freely available in the manuscript and supplemental files. For additional information please refer tohttp://www.icddrb.org/ policies.
Results
At week 4, 71% (46/65) of the patients in the PBA+vitD3-group (p= 0.001) and 61.3% (38/
62) in the vitD3-group (p= 0.032) were culture negative compared to 42.2% (27/64) in the
placebo-group. The odds of sputum culture being negative at week 4 was 3.42 times higher in the PBA+vitD3-group (p = 0.001) and 2.2 times higher in vitD3-group (p = 0.032)
com-pared to placebo. The concentration of LL-37 in MDM was significantly higher in the PBA-group compared to placebo at week 12 (p= 0.034). Decline in intracellularMtbgrowth in MDM was earlier in the PBA-group compared to placebo (log rank 11.38,p= 0.01).
Conclusion
Adjunct therapy with PBA+vitD3or vitD3or PBA to standard short-course therapy
demon-strated beneficial effects towards clinical recovery and holds potential for host-directed-ther-apy in the treatment of TB.
Trial Registration
clinicaltrials.govNCT01580007
Introduction
Tuberculosis (TB) is a global pandemic disease caused byMycobacterium tuberculosis(Mtb) that is responsible for almost 9 million active pulmonary TB cases worldwide and about 1.5 million died from the disease in 2013 [1]. The prevalence of multidrug-resistant TB (MDR-TB) and extensively drug-resistant TB is high and converge with the pandemics of HIV and diabe-tes, which generates further problems with a lethal combination of diseases [2–4]. Despite this scenario, TB is a preventable and curable disease, although treatment of TB is currently long and requires multiple drugs that often have side effects which may range from mild to severe and may require tailored approach to individual cases. Development of new anti-TB drug has been very slow and most available drugs were developed more than 40 years ago [5]. Thus, there is a pressing need for development of new classes of novel drugs or repurposed drugs that can shorten the duration of treatment and combat infection with both susceptible and resistant strains ofMtb.
A series ofin vitrostudies have demonstrated that the active form of vitamin D, 1,25-dihy-droxyvitamin D3or 1,25(OH)2D3, induces the gene expression of beta-defensin 2 and human
cathelicidin LL-37 [6,7]. These peptides belong to two classes of antimicrobial peptides (AMP) produced in lung epithelial cells, monocytes/macrophages and neutrophils [8] that are able to suppress the growth ofMtband modulate antimicrobial responses [9–11]. Active vitamin D, 1,25(OH)2D3also induces autophagy inMtb-infected macrophages/monocytes that can
con-trol the infection via an LL-37-dependent mechanism [12]. Accordingly, several studies have shown an association between vitamin D deficiency and an increased risk to develop active TB [13–16]. Altogether, these findings rekindled the interest of vitamin D as an adjunctive therapy to standard anti-TB treatment [17].
There is growing evidence that adjunct host-directed therapies, could serve as novel approaches to improve standard TB treatments [18–20]. We have earlier shown that treatment with sodium butyrate enhances cathelicidin expression in a colonic epithelia cell line [21] and in vivoin colonic epithelium in a rabbit model of shigellosis, which resulted in rapid clinical
design, data collection and analysis, decision to publish, or preparation of the manuscript.
Competing Interests:The authors have declared that no competing interests exist.
Abbreviations:1,25(OH)2D3, 1,25-dihydroxyvitamin
D3; 25(OH)D3, 25-Hydroxyvitamin D3; 4-FDC, 4 drug
recovery and a concomitant decline in bacterial load in stool [22]. Similarly, we have further shown that sodium 4-phenylbutyrate (PBA), a registered drug used for the treatment of urea cycle disease [23] induces LL-37 expression in a bronchial epithelial cell line andin vivoin the rabbit shigellosis model [24,25]. A synergistic effect in the induction of LL-37 has also been demonstrated between PBA and 1,25(OH)2D3[24]. In a proof-of-concept study, we showed
that supplementation with a combination of PBA and vitamin D to healthy adults enhanced LL-37 expression and intracellular killing ofMtbin macrophagesex vivo[26].
In this clinical trial, we aimed to test our hypothesis that oral adjunct therapy with PBA and/or vitD3administrated to patients with active pulmonary TB would increase LL-37
expres-sion in macrophages and other immune cells and eventually increase elimination ofMtbfrom the host. Thus, we conducted a randomized clinical trial to examine if PBA or vitD3separately
or in combination as adjunct treatment to standard chemotherapy could enhance clinical recovery in newly diagnosed sputum smear-positive pulmonary TB patients. Primary out-comes of the trial included the proportion of TB patients who became culture negative at week 4 and also assessment of clinical endpoints at week 8. Secondary outcome measures included time to sputum smear conversion, radiological changes, plasma 25(OH)D3levels, expression of
LL-37 in immune cells and killing of intracellularMtbby infected MDM.
Methods
Clinical trial study participants
Patients with newly diagnosed sputum smear-positive pulmonary TB were recruited from the National Institute of the Diseases of the Chest and Hospital (NIDCH) in Dhaka, Bangladesh, after providing written informed consent. NIDCH is a government supported research insti-tute and hospital where the majority of the patients are of low socioeconomic status. Inclusion criteria: both males and females (age18 years) with a newly diagnosed sputum smear-posi-tive TB who consented to study enrollment. Exclusion criteria: pregnancy and lactation, relapse TB, HIV infection, hypercalcaemia, regular intake of vitamin D, known concomitant chronic illness such as diabetes, cardiovascular, hepatic and renal diseases and malignancy. Patients with suspicion of prolonged drug abuse were also excluded. Information such as history of con-tact with active TB cases, duration of illness, BCG vaccination and tuberculin skin test status were recorded.
The study was approved by the Research and Ethical Review Committees at the Interna-tional Centre for Diarrheal Disease Research, Bangladesh (icddr,b). The trial was registered with ClinicalTrials.gov (registration number NCT01580007) in April 2012 whereas patient recruitment started in December 2010. The reason for not registering the clinical trial before the recruitment of the first patient was that the authors were not aware of journal requirements for prospective registration. Importantly, the delay in trial registration did not have an impact on the study design or on the analysis or presentation of the results (see attached protocol).
Study design and interventions
The study was a randomized, double blind, placebo controlled 4-arm intervention trial with adjunct therapy with PBA and/or vitD3for 2 months. TB patients received directly observed
treatment, short-course (DOTS) of a 4 fixed-dose-combination (4-FDC) drugs for 2 months followed by 2-FDC for the next 4 months. The 4-FDC consists of Rifampicin 150mg + Isoniazid 75mg + Pyrazinamide 400mg + Ethambutol 275mg/tablet while the 2-FDC consists of Rifam-picin 150mg + Isoniazid 75mg/tablet. The company EM-Partners AB (Råå, Sweden) prepared tablets containing the adjunctive study drug (4-phenylbutyrate (PBA) (Tributyrate1
(vit D3) (Vigantol oil) and placebo (Miglyol oil) were obtained from Merck KGaA in
Darm-stadt, Germany through Popular Pharmaceuticals Ltd in Bangladesh. After enrollment, patients were randomized to the following adjunct treatment arms in a 2x2 factorial design and received oral doses of either: (1) placebo PBA and placebo vitD3or (2) 500 mg twice daily of
PBA and placebo vitD3or (3) placebo PBA and 5000 IU of vitD3(Cholecalciferol) once daily
or (4) PBA combined with vitD3(PBA+vitD3).
The dose of PBA was chosen based on a recent study from our group where 500 mg PBA given twice daily to healthy volunteers proved to be the optimal oral dose to induce LL-37 and enhance mycobactericidal activity in monocyte-derived macrophages (MDM) obtained from treated individuals [26]. The dose of vitD3was selected based on our previous findings that a
weekly dose of 35,000 IU of vitD3given for 2–3 months to pregnant women in the 3rdtrimester
was found to be safe and also raised maternal 25(OH)D3concentrations in serum significantly
in most women without any adverse effects [27]. Moreover, there is evidence that daily doses up to 10,000 IU/day for several months have not lead to adverse effects of changes in serum cal-cium [28].
Randomization and blinding
Independent assistants from the Hospital pharmacy of icddr,b prepared the study medication packs (PBA and placebo tablets; with identical appearance, color and taste), and labeled these tablets with a randomization number corresponding to the computer-generated randomization sequence. Similarly, Popular Pharmaceuticals Ltd. labeled bottles for vitD3(Vigantol oil and
Miglyol placebo oil; with identical appearance, color and taste) with the provided randomiza-tion number. To control and balance for the influence of gender a computer-generated strati-fied block randomization method was used to randomize participants into four groups that would result in equal sample sizes including 4x72 = 288 patients. The randomized block proce-dure was performed as follows: (1) a block size of four was chosen at two levels: male and female, (2) possible balanced combinations with four subjects were calculated as 24 blocks and (3) blocks were randomly chosen to determine the assignment of all 288 participants. This ran-domization protocol resulted in 72 participants (36 males and 36 females) in each of the four treatment groups. Treatment allocation was concealed from patients, study investigators and staff.
Sample size
5% level of significance and 80% power the sample size would be 62 per group. Considering a loss to follow-up of 15%, the sample size in each group would be 72 with a total of 288 patients. ii) A composite clinical score: In a superiority design, with a 50% reduction of clinical scores occurring at 2 month post anti-TB treatment [30], we assume that 25% reduction will take place after one month. A sample size of 212 patients (53 in each arm) would provide 80% power to demonstrate that each treatment will result in a 25% reduction of the clinical scores after 4 weeks of adjunct therapy (from 6.5 to 4.88) with expected standard deviation of 2.3 [30] making an allowance for 15% attrition rate at 5% level of significance. The highest sample size was considered. For sputum smear conversion, the study may be underpowered.
Outcome measures
Primary outcomes of the trial included assessment of both microbiological and clinical end-points. The microbiological outcome was measured as the proportion of TB patients who became culture negative at week 4, while effect size was assessed for major clinical endpoints (cough remission, reduction in lung involvement in chest x-ray, normalization of fever and weight gain) at week 8. Secondary outcome measures included time to sputum smear conver-sion, radiological findings, concentrations of 25(OH)D3in plasma, immunological status
mea-sured as the expression of the antimicrobial peptide LL-37 in immune cells and also as killing of intracellularMtbby MDMex vivo.
Patient safety monitoring, adverse events (AE) and serious adverse
events (SAE)
A data and safety monitoring board (DSMB) was formed that conducted three meetings (before initiation of the study, interim and after completion) to review the results and to advice on the safety to continue or stop the trial after occurrence of a Serious adverse events (SAE) if any. Adverse events (AE) included hypercalcaemia (albumin adjusted plasma calcium>10.5
mg/dL), arthralgia, hepatitis/jaundice, vomiting, anemia, joint pains, body ache, abdominal pain, headache, malaise, itching, dyspepsia, vertigo, and other non-serious AEs, particularly during the first 8 weeks after start of adjunctive treatment. SAE comprised death, hospitaliza-tion or life-threatening condihospitaliza-tions. The primary safety endpoint was hypercalcaemia (corrected calcium>10.5 mg/dL).
Procedures
Clinical assessments and sputum microscopy examinations were performed weekly up to week 4, and consecutively at week 6, 8, 10, 12 and 24. Chest radiographs at NIDCH were examined at week 0, 8, 12 and 24. Sputum culture was performed at NIDCH at week 0, 4 and 8 while drug sensitivity testing was performed at icddr,b. Blood samples were collected at week 0, 4, 8, 12 and 24. Hemoglobin, erythrocyte sedimentation rate (ESR), total and differential counts were determined in the whole blood samples. Concentration of 25(OH)D3, calcium, albumin
and C-reactive protein (CRP) were measured in plasma at all time points. MDM and non-adherent lymphocytes were separated from whole blood at week 0, 4, 8 and 12 and used forin vitroexperiments.
Mtb
microscopy, culture and drug susceptibility testing
37°C and monitored for 6 to 8 weeks or until colonies were detected. Drug susceptibility tests (DST) were performed in LJ media by the minimum inhibitory concentration method [31]. DST was performed for isoniazid, rifampicin, ethambutol and streptomycin.
TB score
Clinical assessments were performed by the study doctor assisted by a nurse on scheduled visits and were used to calculate numerical clinical scores as previously described [30,32]. The clini-cal score defined as a TB score is an assessment tool developed by clinicians/ investigators to measure changes in clinical symptoms of the TB patients in an unbiased and objective manner. The TB score (S1 Table) allocated points for self-reported symptoms (cough, shortness of breath/dyspnea, chest pain, haemoptysis, anorexia), and clinical signs (fever, anemia (<11 g/
dl), tachycardia, auscultatory findings) as reported by study doctors. Weight gain was mini-mum (<8.5%) for the Bangladeshi TB patients and therefore not used in the scoring system.
The TB score was determined at week 0–4, 6, 8, 10, 12 and 24.
In addition to the TB score, chest x-ray findings were assessed and scored as previously reported [32,33]. Since chest x-ray was performed only at week 0, 8, 12 and 24 following the National TB program guidelines, a TB score including chest x-ray was determined separately for these four time points. For the chest x-ray analysis, each lung field was divided into three zones, upper, mid and lower zones. Presence of nodules, patchy or confluent consolidation and cavitation were recorded for each of the three zones. The size of nodules appearing as round or irregular were recorded in millimeters (small nodule, 1 to 2 mm; large nodules,>2 mm) and
total cavity size was recorded in centimeters. The presence of effusion was also determined and the effusion volume was estimated by visual assessment as the percentage of a given lung field. Similarly, the extent of opacification, cavitation or additional pathology was graded as the per-centage of the affected lung [33]. Finally, the total perper-centage of the lungs affected by any pathology was estimated.
Preparation of blood samples
Peripheral blood mononuclear cells (PBMC) and plasma were separated from whole blood by Ficoll-PaqueTMPLUS (GE Healthcare, Uppsala, Sweden) density gradient centrifugation. Plasma samples were stored at -20°C for molecular analysis, while isolated PBMCs were washed and resuspended in culture medium (RPMI-1640 supplemented with 10% autologous plasma, 1% L-glutamine, 1% sodium pyruvate and 1% penicillin-streptomycin (Gibco, Grand Island, NY, USA)) and plated in two separate 4-well cell culture plates (NUNC, Roskilde, Den-mark). One cell culture plate was used for mRNA isolation and analyses of LL-37 peptide, while the other plate was used for assessment ofMtbkilling mediated by patient’s MDM.
After three days incubation of PBMCs in 4-well plates, the culture supernatants containing non-adherent cells were removed and centrifuged to collect the clear supernatant or the extra-cellular fluid (ECF) of PBMCs. Flow cytometry were used to determine that>80% of
non-adherent cells in the plates were CD3+and CD19+lymphocytes while>90% of adherent cells
Assessment of LL-37 peptide and level of mRNA encoding the LL-37
peptide
LL-37 peptide levels were measured by ELISA in ICF of MDM and non-adherent lymphocytes and in ECF of PBMC. A standard curve of the ELISA was generated from synthetic LL-37 (Inno-vagen, Lund, Sweden). Polystyrene microtiter plates (Maxisorp by NUNC, Naperville, IL, USA) were coated with monoclonal anti-LL-37 (5μg/ml) [34] in carbonate buffer (15 mM sodium
car-bonate, 35 mM sodium bicarbonate and 0.02% sodium azide [pH 9.6]) and incubated overnight at 4°C. Non-specific binding was blocked after washing with 0.1% gelatin in Tris-buffered saline for 1 hour at RT. Next, patient samples and the diluted standard were added and incubated over-night at 4°C. After sequential incubations with biotinylated rabbit anti-LL-37 (1μg/mL)
(Innova-gen) and Streptavidin-alkaline phosphatase conjugate (Chemicon, Melbourne, Australia) for 2h each at RT, the reaction was developed using 4-methyl-umbelliferyl phosphate as the substrate (Molecular Probes, Leiden, The Netherlands). Fluorescence was measured at an excitation wave-length of 360 nm and emission wavewave-length of 450 nm.
mRNA was extracted from MDM and NAL using the RNeasy Mini kit as described by the manufacturer (Qiagen GmbH). mRNA was reverse-transcribed using Bio-Rad CFX 1000, (Her-cules, CA, USA) and cDNA was synthesized using Superscript III First-Strand Synthesis System (Invitrogen, Grand Island, NY, USA). The relative expression of mRNA encoding LL-37 peptide compared to the housekeeping gene 18S rRNA was measured by real-time quantitative RT-PCR using the CFX96 Real-Time PCR Detection Systems (Bio-Rad,) and the 18S rRNA-housekeeping gene kit (Applied Biosystems, Foster City, CA, USA). The sequences of forward and reverse primers for mRNA encoding the LL-37 peptide were 5´-TCACCAGAGGATTGTGACTTCAA-3´ and 5´-TGAGGGTCACTGTCCCCATAC-5´-TCACCAGAGGATTGTGACTTCAA-3´, respectively (Primer Express; Applied Biosys-tems). The results were analyzed by using a relative standard method [35].
Effector function of MDM
To determine the capacity ofMtb-infected MDM in the killing of intracellularMtb, a bacteri-cidal assay was performed as an effector function test of MDM. MDM obtained from patients at baseline, week 4, 8 and 12 were used for this experiment. MDM were seeded in culture plates and infected with virulentMtbstrain H37Rv (Tuberculosis Research Center, Chennai, India) at a multiplicity of infection (MOI) of 25:1 in culture medium without antibiotics [26] after testing 3 different ratios (10:1; 25:1 and 50:1) for an optimal MOI. After 2 hours, the culture plates were washed with warm RPMI to remove the extracellular bacteria. Infected MDM were cultured for three additional days in a medium with autologous plasma and antibiotics (peni-cillin-streptomycin, amphotericin B) (Gibco, Grand Island, NY, USA). Thereafter, the cells were lysed with 0.3% saponin-PBS followed by vigorous pipetting to collect viable intracellular Mtb. The cell lysates were cultured on Middle-Brook 7H11 agar medium (Becton Dickinson, Sparks, MD, USA) for 21–28 days at 37°C and bacterial viability was calculated by counting colony forming units (CFU). The level of MDM-mediated killing at day 0, before initiation of any intervention, served as control for all groups. A‘relative CFU count’was calculated for each time point by normalizing the data to the CFU of theMtbinoculum [11]. A cut-off of 0.1 was considered as zero because zero values are not obtained when data is normalized with inoc-ulum data; there was always a residualMtbcount.
Assessment of vitamin D, calcium and C-Reactive Peptide (CRP) in plasma
Plasma levels of 25(OH)D3was estimated by an electrochemiluminescence immunoassay
(Roche Diagnostics GmbH, Mannheim, Germany). This method is standardized against stan-dard LC-MS/MS [36] which in turn has been stanstan-dardized to the NIST stanstan-dard [37]. Results were determined using a calibration curve that was generated by a Vitamin D3CalSet (Roche).
According to the manufacturer, this assay shows 100% and 92% cross-reactivity with 25-OH vitamin D3and 25-OH vitamin D2, respectively. Commercial quality control material Elecsys
PreciControl Varia (Roche) was used as an internal quality control. The Laboratory also partic-ipates in External Quality Assurance Schemes [38,39].
Calcium and albumin were measured in plasma by two colorimetric assays, Calcium Gen.2 and ALB plus kit (Roche Diagnostics) respectively, while CRP was determined by an immuno-turbidometric method (Roche Diagnostics). All results were obtained using an automated clini-cal chemistry analyzer (Hitachi 902, Roche diagnostics). Quality control material, Precinorm U and Precipath U (for calcium and albumin) as well as Precinorm Protein and Precipath Protein (for CRP) from Roche diagnostics, were used as internal quality controls. Plasma calcium con-centrations were adjusted to plasma albumin. Normal serum calcium (albumin adjusted) range is 8.6 to 10.5 mg/dL. Hypercalcaemia was defined at serum albumin-adjusted Ca>10.5 mg/dL.
Concentration of PBA in plasma could not be measured due to lack of access to an appro-priate method.
Statistical analysis
Statistical analysis was performed using IBM SPSS Statistics 20.0 and Stata 13 (StataCorp, College Station, Texas, USA). Data not normally distributed were log transformed that included CRP, LL-37 peptide expression in MDM and lymphocytes as well as plasma 25 (OH)D3levels. A p-value of005 was considered significant. The primary analysis of the
outcomes of interest was performed by modified intention-to-treat (ITT) for up to week 12 and per-protocol analysis for week 24. Efficacy was assessed by modified ITT that excluded patients who had a negative sputum culture at baseline. Outcome variables were reported as means, with 95% confidence intervals (CI) or standard deviations when continuous, and cat-egorical variables were reported as numbers with percentages. The Chi-square test was used to compare the proportion of patients who became sputum culture negative at week 4 and 8 compared to placebo. Effect size was estimated as difference in proportion of outcome of interest (sputum culture conversion and clinical endpoints) among treatment groups and strength of effect size was examined using Odds Ratio (OR) generated by multivariable logistic regression model. In the model, placebo was used as reference. A mixed model ANCOVA was used to follow-up outcome values as dependent variable and treatment arm as independent variable, to investigate effectiveness of TB scores, leukocyte and monocyte counts, concentrations of hemoglobin, ESR, CRP, calcium, LL-37 and 25(OH)D3between
Results
Enrollment procedure and demography
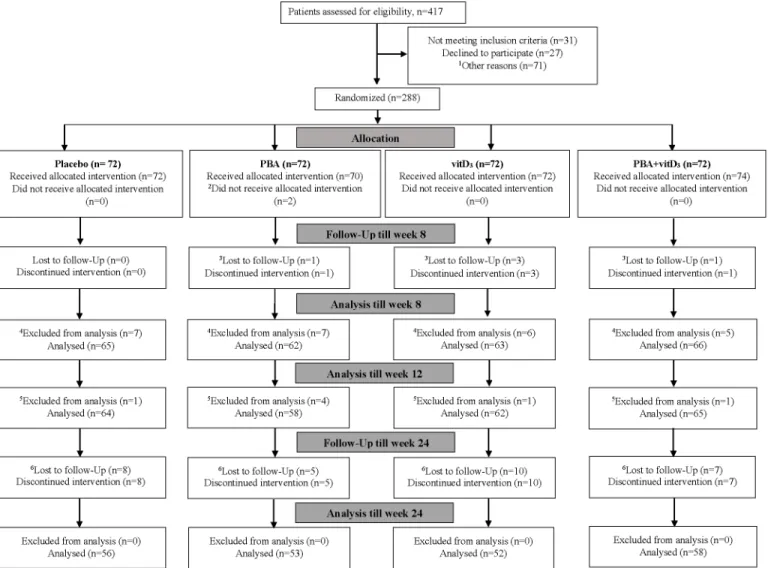
A total of n = 417 sputum smear-positive pulmonary TB patients were screened for eligibility between December 14, 2010, and December 26, 2013. Of these, n = 31 patients did not meet the inclusion criteria, n = 27 patients did not provide consent and n = 71 patients were excluded due to the various reasons described in the flowchart inFig 1. A total of n = 288 TB patients were finally enrolled in the study and randomized into the four treatment arms. Two patients in the PBA-group refused to continue in the study just after enrollment and did not receive the allocated adjunctive therapy. Five patients declined to continue in the study after 4 to 6 weeks since they migrated from Dhaka; 30 dropped out from the study after completing 12 weeks treatment. Of the 288 sputum smear positive patients, 28 patients hadMtbnegative cultures at baseline; most likely due to non-tuberculosis mycobacteria (NTM) and 7 patients
Fig 1. Consort flow diagram of patients with tuberculosis, from screening to analysis.PBA, Phenylbutyrate; vitD3, vitamin D3;1Other reasons for not
randomizing include living outside Dhaka, difficult to continue in the trial due to job- and academic activity-related problems.2At base line two participants in
the PBA-group did not receive allocation as they refused to continue in the study just after enrollment.3There were five dropouts between enrollment and
week 8, due to migration to other cities, could not be contacted or refused to continue since they moved from Dhaka to their respective village homes in the country side.4Excluded from analysis: 28 patients were culture negative at baseline, among them, 3 are included in the above 5 dropouts.5Excluded from
analysis: seven patients had multidrug resistant tuberculosis (MDR TB) unevenly distributed among the treatment arms.6There were thirty patients who
discontinued the intervention between week 12 to 24, due to migration, pilgrimage, sent to jail, could not be contacted via phone or when visits to respective homes were made, refused to come to Dhaka for follow-up visits since they moved to their village homes.
were diagnosed with MDR-TB. Thus, 7 MDR-TB cases, 28 culture negative cases (3 patients included in the dropout cases between 4–6 weeks) were excluded from the analysis for modi-fied ITT analysis (Fig 1). In total 219 patients completed the trial by the follow-up visits at week 24 and formed the per-protocol population.
Baseline characteristics
Male patients were slightly higher in numbers than female patients (ratio 1.6:1) in each group (Table 1). History of contact with active TB cases was less than 33%. About 60–74% patients were deficient in vitamin D status, and only 7–13% patients had sufficient status. An important feature in TB patients was the very low body weight at baseline with minimum increase after 2 or 6 months’therapy. No differences were found in baseline characteristics when randomized patients were compared to potentially eligible patients who declined or had to be excluded from the study (S2 Table).
Adverse events and serious adverse events
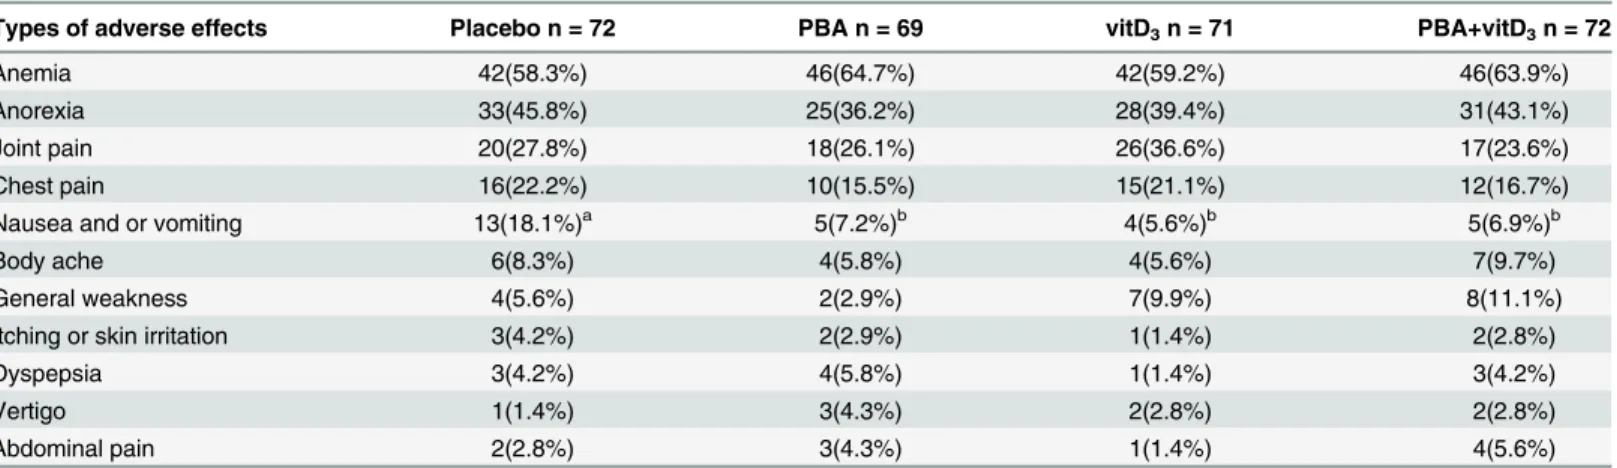
There were no differences in the occurrence and distribution of most of the AEs between the study arms (Table 2). The occurrence of vomiting was significantly lower in the PBA-, vitD3
-and PBA+vitD3- groups compared to placebo (p= 0.055, 0.022 and 0.044 respectively). The
Table 1. Baseline characteristics of patients with freshly diagnosed pulmonary tuberculosis in the four treatment groups.
Features Placebo (n = 72) PBA (n = 72) vitD3(n = 72) PBA+vitD3(n = 72)
Intention-to-treat group, n = 288
Gender (Males) (Number, %) 44(61%) 44(61%) 44(61%) 45(625%)
History of contacts (Number, %)
Male 10(22.7%) 12(27.3%) 9(20.5%) 12(26.7%)
Female 13(46.4%) 8(28.6%) 10(35.7%) 12(44.4%)
BCG given (Number, %)
Male 33(75.0%) 24(54.5%) 35(79.5%) 32(77.1%)
Female 13(46.4%) 20(71.4%) 20(71.4%) 21(77.8%)
Age, years (Mean±SD) 26.7±8.1 26.8±7.3 28.1±9.9 26.8±6.9
Weight, kg (Mean±SD)
Male 46.3±6.6 48.9±6.5 47.9±8.4 46.6±6.6
Female 39.8±7.8 37.0±5.7 38.4±7.6 39.8±7.8
Tuberculin skin test done 7(2.4%) 12(4.2%) 8(2.8%) 9(3.1%)
Duration of illness, days (Mean±SD)
Male 50.9±26.8 48.8±20.6 55.1±2 6.5 53.6±28.7
Female 51.9±23.5 53.6±19.9 51.9±26.5 47.2±22.9
ESR, mm 1sthr (Mean±SD) 60.2±34.9 56.9±32.5 54.0±31.1 56.8±33.2
Hb, gm/dl (Mean±SD) 11.6±1.6 11.5±1.7 11.3±1.9 11.7±1.8
WBC, 1x10³/cmm (Mean±SD) 10.56±2.63 9.99±2.16 10.93±2.88 11.36±3.21
Per-protocol group, n = 249
Vitamin D status# (n = 64) (n = 58) (n = 62) (n = 65)
Vitamin D nmol/L 28.1±16.2 23.8±14.8 28.0±17.5 26.8±16.3
Deficient,<30 nmol/L 40(62.5%) 41(70.7%) 46(74.2%) 39(60.0%)
Insufficient, 30–50 nmol/L 19(29.7%) 13(22.4%) 8(12.9%) 20(30.8%)
Sufficient,>50 nmol/L 5(7.8%) 4(6.9%) 8(12.9) 6(9.2%)
Data is presented as mean±standard deviation or number with percentage in parentheses. BCG,Bacillus Calmette–Guérin.; ESR, erythrocyte
sedimentation rate; Hb, hemoglobin; WBC, white blood cells. History of contacts, BCG given and Tuberculin skin test done are dichotomous variable and age, weight, duration of illness, ESR, Hb, WBC and vitamin D status are continuous variable.
most common AEs were anemia (61.9%), anorexia (41.2%), joint pain or arthralgia (28.5%) fol-lowed by chest pain (18.7%), vomiting (9.5%) and body ache (7.4%). Arthralgia increased in all study groups after initiation of anti-TB therapy and was mostly manifested at week 8 (average 54%) but declined until week 12 (average 31%). No cases of hypercalcaemia were noted in the trial. However, hypocalcaemia was common among the patients in the 4 groups ranging from 26% to 48% at baseline (Table 5) without any significant changes during the study period.
There were four cases of SAEs that included hospitalization; one patient had severe vomit-ing with breathvomit-ing difficulties, two patients experienced severe reactions of anti-TB treatment including elevated levels of serum glutamic pyruvic transaminase (SGPT), and one patient had severe loin pain due to urinary tract infection (Table 3). The patients with SAEs were advised complete rest without interrupting anti-TB therapy. None of the SAEs had any connection to the study drugs (vitD3or PBA), as reviewed by the DSMB.
Primary endpoint 1: Microbiological outcome
Excluding 28 culture negative cases and 7 MDR-TB cases, the number of patients who com-pleted week 4 was 249, which constituted the modified ITT population for analysis of primary endpoint 1. Chi-square test was applied to compare the proportion of patients between inter-vention groups and placebo. The proportion of patients being culture-negative at week 4 were higher in the PBA+vitD3-group (71%; 46/65) (p= 0.001) and the vitD3-group (64.4%; 38/62)
(p= 0.032) compared to the placebo-group (43.7%; 27/64). In the PBA-group, 46.6% (27/58) were culture-negative at week 4 (p= 0.62). The proportion of patients being culture-negative at week 8 were higher in the vitD3-group (98.4%; 61/62) (p= 0.032) and the PBA+vitD3-group
(95.4%; 62/65) (p= 0.179) compared to the placebo-group (89.1%; 57/64). In the PBA-group, 91.4% (53/58) were culture-negative at week 8 (p= 0.668).
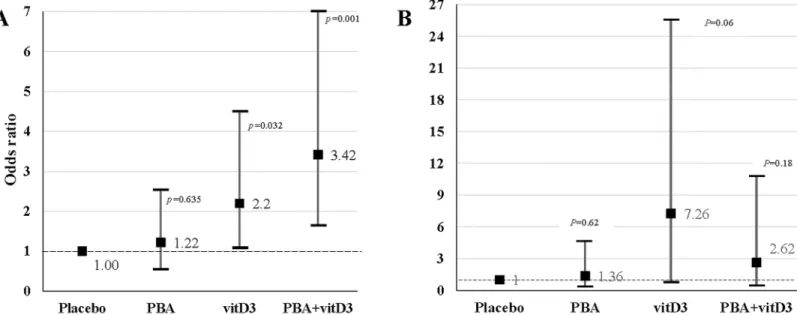
The odds ratio of sputum culture conversion was estimated by using multivariable logistic regression adjusting for age and sex. The odds of sputum culture being negative at week 4 was 3.42 times higher in the PBA+vitD3-group (95% Confidence interval (CI), 1.64–7.15,
p= 0.001), 2.20 times higher in vitD3-group (95% CI, 1.07–4.51,p= 0.032) and only 1.22 times
higher in the PBA-group (95% CI, 0.59–2.53,p= 0.587) compared to the placebo-group
Table 2. Distribution of major types of adverse effects observed during the treatment of tuberculosis by different groups at week 4 (modified inten-tion-to-treat analysis, n = 284).
Types of adverse effects Placebo n = 72 PBA n = 69 vitD3n = 71 PBA+vitD3n = 72
Anemia 42(58.3%) 46(64.7%) 42(59.2%) 46(63.9%)
Anorexia 33(45.8%) 25(36.2%) 28(39.4%) 31(43.1%)
Joint pain 20(27.8%) 18(26.1%) 26(36.6%) 17(23.6%)
Chest pain 16(22.2%) 10(15.5%) 15(21.1%) 12(16.7%)
Nausea and or vomiting 13(18.1%)a 5(7.2%)b 4(5.6%)b 5(6.9%)b
Body ache 6(8.3%) 4(5.8%) 4(5.6%) 7(9.7%)
General weakness 4(5.6%) 2(2.9%) 7(9.9%) 8(11.1%)
Itching or skin irritation 3(4.2%) 2(2.9%) 1(1.4%) 2(2.8%)
Dyspepsia 3(4.2%) 4(5.8%) 1(1.4%) 3(4.2%)
Vertigo 1(1.4%) 3(4.3%) 2(2.8%) 2(2.8%)
Abdominal pain 2(2.8%) 3(4.3%) 1(1.4%) 4(5.6%)
Note. Data is presented as numbers with percentage in parentheses. Two patients in the PBA group did not receive allocation and one dropped out from the study between 0–3 weeks. One patient in the vitD3group dropped out from the study between 0–3 weeks.
a,bDifferent superscripts in a row show signi
ficant difference between the groups. Significancep0.05.
(Fig 2A). The odds of sputum culture being negative at week 8 was 7.26 times higher in the vitD3-group (95% CI, 0.90–25.50,p= 0.062), 2.62 times higher in PBA+vitD3-group (95% CI, 0.64–10.12,p= 0.181) but only 1.36 times higher in the PBA-group (95% CI, 0.40–4.59, p= 0.625) compared to the placebo-group (Fig 2B).
Primary endpoint 2: Clinical endpoints at week 8
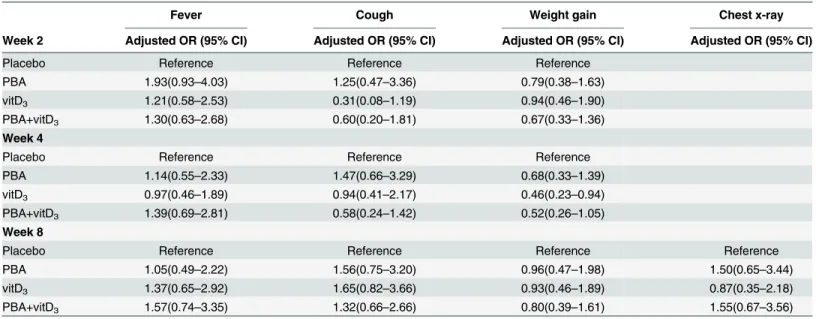
The odds ratio of major clinical endpoints was estimated by using multivariable logistic regres-sion adjusting for age and sex. There were 249 patients who completed week 8, which formed the modified ITT population for analysis of primary endpoint 2. Only patients in the PBA-group had higher recovery from fever at week 2 compared to placebo (Table 4). The odds of a significant increase in weight gain was lower in the vitD3-group (p= 0.03) and PBA+vitD3
(p= 0.066) at week 4 compared to placebo.
Secondary outcomes
Sputum smear conversion. Comparison of time to sputum smear conversion (sputum smear becoming negative) for the different intervention groups compared to placebo was
Table 3. Symptoms of patients with serious adverse events.
Patient Sex Symptoms of serious adverse events Treatment arms
001 Female Nausea, profuse vomiting, and breathing difficulties PBA+vitD3
002 Female Severe abdominal pain, nausea, vomiting, left loin pain Placebo
003 Female Body ache, vomiting, generalized weakness, elevated SGPT PBA
004 Male Nausea, vomiting and low grade fever, elevated SGPT PBA
Note. SGPT, serum glutamic pyruvic transaminase
doi:10.1371/journal.pone.0138340.t003
Fig 2. Multivariable logistic regression model was used to estimate the effect of adjunct therapy on the sputum culture conversion (culture negative) and sputum smear conversion at week 4 and 8.Points show the age- and sex-adjusted odds ratio (OR) values, and vertical lines delineate 95% confidence intervals. Adjusted OR is shown for four treatment groups (PBA, vitD3and PBA+vitD3) at week 4 and 8 vs. placebo group. (A) The odds of sputum
culture being negative at week 4 was 3.42 times higher in the PBA+vitD3-group (95% Confidence interval (CI), 1.64–7.15) and 2.20 times higher in vitD3
-group (95% CI, 1.07–4.51) compared to the placebo-group. (B) The odds of sputum culture being negative at week 8 was 7.26 times higher in the vitD3-group
performed using Log Rank test. No significant differences were obtained between the placebo and intervention groups (log rank 0.228,p= 0.973) (Fig 3).
Table 4. Odds ratio for major clinical endpoints in TB patients at various intervals after initiation of anti-TB treatment and adjunctive therapy (mod-ified intention-to-treat analysis).
Fever Cough Weight gain Chest x-ray
Week 2 Adjusted OR (95% CI) Adjusted OR (95% CI) Adjusted OR (95% CI) Adjusted OR (95% CI)
Placebo Reference Reference Reference
PBA 1.93(0.93–4.03) 1.25(0.47–3.36) 0.79(0.38–1.63)
vitD3 1.21(0.58–2.53) 0.31(0.08–1.19) 0.94(0.46–1.90)
PBA+vitD3 1.30(0.63–2.68) 0.60(0.20–1.81) 0.67(0.33–1.36)
Week 4
Placebo Reference Reference Reference
PBA 1.14(0.55–2.33) 1.47(0.66–3.29) 0.68(0.33–1.39)
vitD3 0.97(0.46–1.89) 0.94(0.41–2.17) 0.46(0.23–0.94)
PBA+vitD3 1.39(0.69–2.81) 0.58(0.24–1.42) 0.52(0.26–1.05)
Week 8
Placebo Reference Reference Reference Reference
PBA 1.05(0.49–2.22) 1.56(0.75–3.20) 0.96(0.47–1.98) 1.50(0.65–3.44)
vitD3 1.37(0.65–2.92) 1.65(0.82–3.66) 0.93(0.46–1.89) 0.87(0.35–2.18)
PBA+vitD3 1.57(0.74–3.35) 1.32(0.66–2.66) 0.80(0.39–1.61) 1.55(0.67–3.56)
Note. The decrease in fever to normal temperature, disappearance of cough, reduction of lung involvement (as judged by chest x-ray) and increase in weight at various intervals were considered as clinical endpoints.
doi:10.1371/journal.pone.0138340.t004
Fig 3. Kaplan Meier survival plot for impact of the different interventions on time to sputum smear becoming negative.The log rank analysis showed no significant differences between the placebo and the intervention groups (log rank 0.228,p= 0.973).
Vitamin D status and blood chemistry. The standard classification proposed by the Insti-tute of Medicine (IOM) was followed as sufficient vitamin D status,>50 nmol/L; insufficient
status, 30–50 nmol/L; and deficient status, below 30 nmol/L [40]. There were no differences in plasma 25(OH)D3levels between the interventions and placebo-groups at baseline when 67%
of the patients exhibited deficient status of 25(OH)D3, 24% had insufficient and 9% had
suffi-cient concentrations of 25(OH)D3(Fig 4;S3 Table). Accordingly, vitD3supplementation was
warranted in this study population. Since there were interaction effects of age, sex, history of contact and BCG status on plasma 25(OH)D3levels, these were used as covariates in the
ANCOVA model. Administration of vitD3to the TB patients in the presence or absence of
PBA (vitD3-supplemented group) from week 0 to 8, resulted in significantly elevated levels of
25(OH)D3at week 4, 8, 12 and 24 compared to the non-vitD3supplemented groups (PBA and
placebo), which remained significantly higher at week 24 (p<0.001 for all) (Fig 4). At week 8,
94%-100% patient among the vitD3-supplemented group attained sufficient vitamin D status
as opposed to 2%-14% in the non-supplemented group (S3 Table). About 63–67% of vitD3
-supplemented group and 11–15% of non-vitD3supplemented group retained the sufficient
lev-els of plasma 25(OH)D3(>50 nmol/L) at week 24.
No cases of hypercalcemia were obtained after adjunct therapy; however, prevalence of hypocalcemia was common in all groups. Hypocalcemia was defined as concentration of adjusted plasma calcium<8.6 mg/dL (Table 5). During the study period, no major effects of
adjunct therapy was observed with regards to body weight, albumin-adjusted mean plasma
Fig 4. Plasma concentration of 25-hydroxyvitamin D3at baseline, week 4, 8 and 12 after initiation of treatment in TB patients in the four
intervention arms.The groups receiving vitD3supplementation (vitD3and PBA+vitD3-groups) exhibited significantly higher concentrations of plasma
25-hydroxyvitamin D3at week 4, 8 and 12 intervals compared to placebo after initiation of therapy (p<0.000 for all).
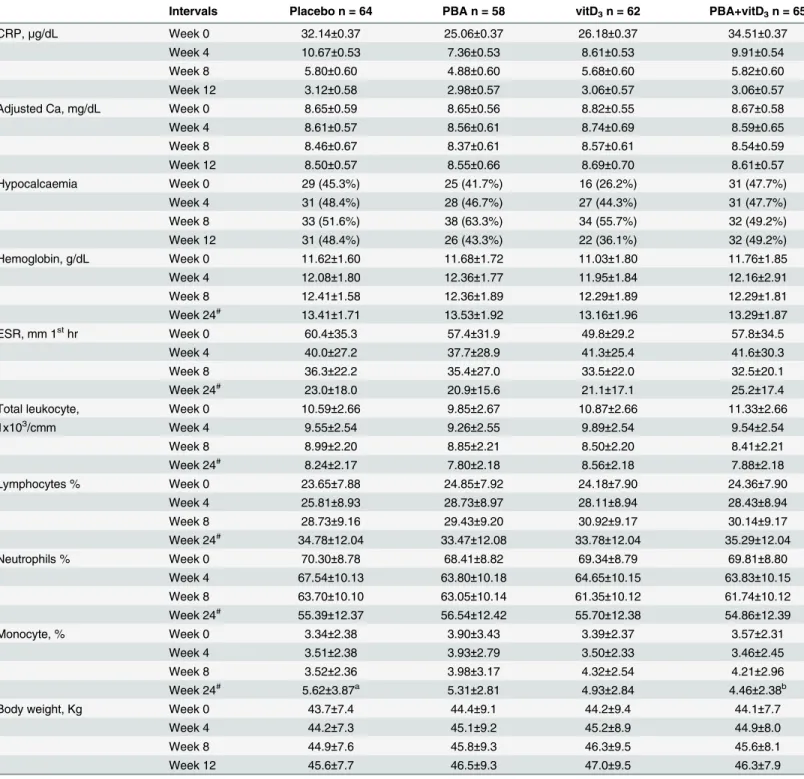
Table 5. Body weight and concentrations of blood parameters in patients with tuberculosis at various intervals after initiation of anti-TB treatment and adjunctive therapy (modified intention-to-treat analysis).
Intervals Placebo n = 64 PBA n = 58 vitD3n = 62 PBA+vitD3n = 65
CRP,μg/dL Week 0 32.14±0.37 25.06±0.37 26.18±0.37 34.51±0.37
Week 4 10.67±0.53 7.36±0.53 8.61±0.53 9.91±0.54
Week 8 5.80±0.60 4.88±0.60 5.68±0.60 5.82±0.60
Week 12 3.12±0.58 2.98±0.57 3.06±0.57 3.06±0.57
Adjusted Ca, mg/dL Week 0 8.65±0.59 8.65±0.56 8.82±0.55 8.67±0.58
Week 4 8.61±0.57 8.56±0.61 8.74±0.69 8.59±0.65
Week 8 8.46±0.67 8.37±0.61 8.57±0.61 8.54±0.59
Week 12 8.50±0.57 8.55±0.66 8.69±0.70 8.61±0.57
Hypocalcaemia Week 0 29 (45.3%) 25 (41.7%) 16 (26.2%) 31 (47.7%)
Week 4 31 (48.4%) 28 (46.7%) 27 (44.3%) 31 (47.7%)
Week 8 33 (51.6%) 38 (63.3%) 34 (55.7%) 32 (49.2%)
Week 12 31 (48.4%) 26 (43.3%) 22 (36.1%) 32 (49.2%)
Hemoglobin, g/dL Week 0 11.62±1.60 11.68±1.72 11.03±1.80 11.76±1.85
Week 4 12.08±1.80 12.36±1.77 11.95±1.84 12.16±2.91
Week 8 12.41±1.58 12.36±1.89 12.29±1.89 12.29±1.81
Week 24# 13.41±1.71 13.53±1.92 13.16±1.96 13.29±1.87
ESR, mm 1sthr Week 0 60.4±35.3 57.4±31.9 49.8±29.2 57.8±34.5
Week 4 40.0±27.2 37.7±28.9 41.3±25.4 41.6±30.3
Week 8 36.3±22.2 35.4±27.0 33.5±22.0 32.5±20.1
Week 24# 23.0±18.0 20.9±15.6 21.1±17.1 25.2±17.4
Total leukocyte, Week 0 10.59±2.66 9.85±2.67 10.87±2.66 11.33±2.66
1x10³/cmm Week 4 9.55±2.54 9.26±2.55 9.89±2.54 9.54±2.54
Week 8 8.99±2.20 8.85±2.21 8.50±2.20 8.41±2.21
Week 24# 8.24±2.17 7.80±2.18 8.56±2.18 7.88±2.18
Lymphocytes % Week 0 23.65±7.88 24.85±7.92 24.18±7.90 24.36±7.90
Week 4 25.81±8.93 28.73±8.97 28.11±8.94 28.43±8.94
Week 8 28.73±9.16 29.43±9.20 30.92±9.17 30.14±9.17
Week 24# 34.78±12.04 33.47±12.08 33.78±12.04 35.29±12.04
Neutrophils % Week 0 70.30±8.78 68.41±8.82 69.34±8.79 69.81±8.80
Week 4 67.54±10.13 63.80±10.18 64.65±10.15 63.83±10.15
Week 8 63.70±10.10 63.05±10.14 61.35±10.12 61.74±10.12
Week 24# 55.39±12.37 56.54±12.42 55.70±12.38 54.86±12.39
Monocyte, % Week 0 3.34±2.38 3.90±3.43 3.39±2.37 3.57±2.31
Week 4 3.51±2.38 3.93±2.79 3.50±2.33 3.46±2.45
Week 8 3.52±2.36 3.98±3.17 4.32±2.54 4.21±2.96
Week 24# 5.62±3.87a 5.31±2.81 4.93±2.84 4.46±2.38b
Body weight, Kg Week 0 43.7±7.4 44.4±9.1 44.2±9.4 44.1±7.7
Week 4 44.2±7.3 45.1±9.2 45.2±8.9 44.9±8.0
Week 8 44.9±7.6 45.8±9.3 46.3±9.5 45.6±8.1
Week 12 45.6±7.7 46.5±9.3 47.0±9.5 46.3±7.9
Data is presented as mean±standard deviation or numbers with percentage in parentheses. ESR, erythrocyte sedimentation rate; CRP, C-reactive protein. In a row, different superscripts show significant difference between the groups at a given time point.
#At week 24, sample size in four groups were: placebo, n = 54; PBA, n = 49, vitD
3, n = 49; PBA+vitD3, n = 54. From 13 patients, hematological reports
were not available. Hypocalcemia was defined as concentration of adjusted plasma calcium<8.5 mg/dL. Statistical analyses were done by ANCOVA adjusting for covariates. There were interaction effects of age, sex, contact history and BCG status on ESR and monocyte counts and for the rest of the data interactions were obtained with age and sex only. P is significant whenp0.05.
calcium, CRP, ESR, hemoglobin, total leukocytes and lymphocyte counts (Table 5). From 13 patients, hematological reports were not available at week 24. Four weeks after initiation of adjunct therapy, neutrophil counts were lower in the PBA and PBA+vitD3-groups compared
to the placebo-group (p= 0.06 andp= 0.058, respectively). At week 24 monocytes counts were significantly lower in the PBA+vitD3group compared to placebo (p= 0.047).
Effects of adjunct therapy on LL-37 expression in immune cells
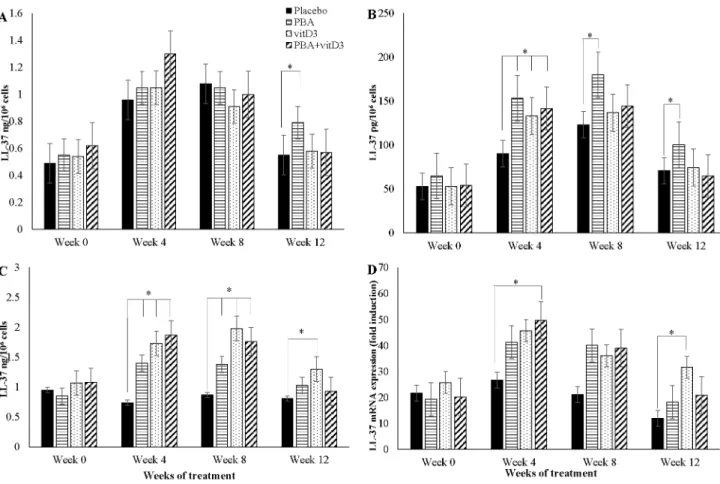
ANCOVA model was applied to compare the difference in means of LL-37 peptide/mRNA concentrations of the 3 intervention groups with that of the placebo at various time intervals. Concentration of LL-37 peptide was measured in 3 different cell types, thus analysis was per-formed for each cell type. Age, sex, contact history and BCG status were used as covariates for analyzing LL-37 peptide in lymphocytes and PBMC, and LL-37 mRNA in MDM, while only age and contact history were adjusted for LL-37 peptide in MDM.
A significant increase in LL-37 peptide concentrations in MDM was found in the PBA-group compared to placebo at week 12 (p= 0.034) (Fig 5A). In addition, LL-37 peptide concen-trations in lymphocytes from the PBA-, vitD3- and PBA+vitD3-groups were significantly
higher at week 4, 8 and 12 compared to the placebo-group (p= 0.009,p= 0.053 andp= 0.022, respectively) (Fig 5B). In PBMC, LL-37 peptide levels increased significantly in the three inter-vention arms compared to placebo at week 4 (p<0.003 for all groups) and week 8 (p<0.030 for Fig 5. Concentration of antimicrobial peptide LL-37 at baseline, week 4, 8 and 12 after initiation of treatment in TB patients in the four intervention arms: (A) in monocyte-derived-macrophages (MDM); (B) in non-adherent lymphocytes; (C) in peripheral blood mononuclear cells (PBMC); (D) relative expression of LL-37 mRNA in MDM.
all groups), while increased LL-37 peptide levels at week 12 was found in the vitD3-group only
compared to placebo,p= 0.030) (Fig 5C).
Concentration of LL-37 mRNA in MDM increased in the PBA+vitD3-group (p= 0.036) at
week-4, in the PBA-group at week 8 (p= 0.057) and in the vitD3-group at week 12 (p= 0.003)
compared to placebo (Fig 5D).
Effects of adjunct therapy on effector function of macrophages
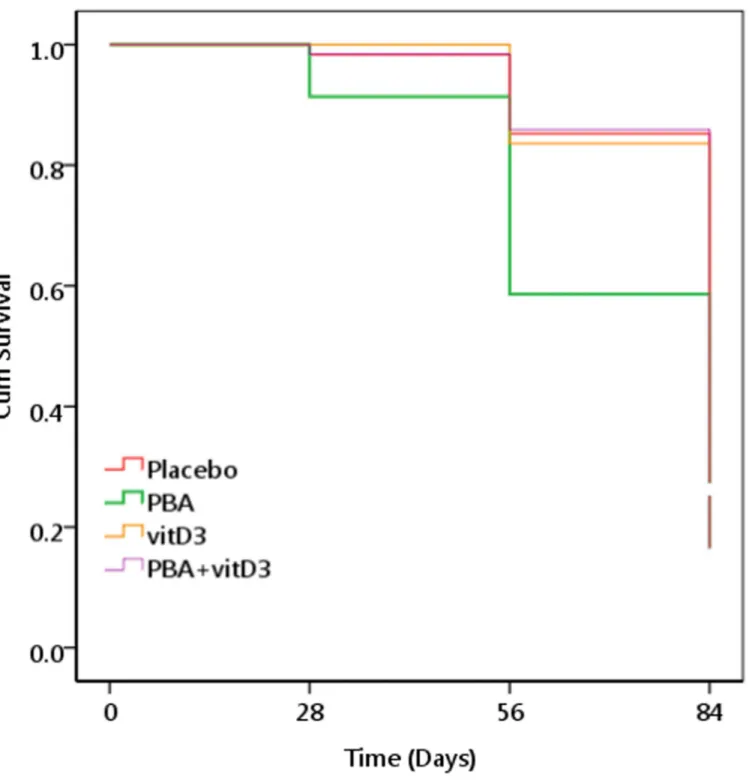
Complete sets of macrophages were obtained from 244 TB patients at week 0, 4, 8 and 12. Within each group, the capacity of MDM to kill intra-cellularMtbincreased with time after initiation of anti-TB therapy as indicated by decreased viableMtbcount over time. We compared the survival of the intracellularMtbin MDM according to intervention groups by plotting the Kaplan-Meier graph. The graph displays cumulative survival function of intracellularMtbon a linear scale by intervention. In the log rank analysis, time toMtbcounts becoming zero was compared between the placebo and the intervention groups. The PBA-group demonstrated significantly earlier decline in viableMtbcfu compared to the placebo-group (95% CI of time (days) to zero count, 65.3–74.7 vs. 76.5–82.3 respectively, log rank 11.38,p= 0.01) (Fig 6).
Exploratory analyses
The composite TB score (S1 Table) was calculated for patients at week 0, 1, 2, 3, 4, 6, 8, 10, 12 and 24 that excluded the chest x-ray score since x-ray was performed at fewer occasions. As age, sex, history of contact and BCG status had interaction effects on TB scores, we adjusted the clinical scores with these covariates using ANCOVA. The PBA-group showed a marked decline in TB score already at week 2, 4 and 8 compared to the placebo-group (p= 0.032, p= 0.006 andp= 0.026 respectively) (Fig 7A). However, at week 10 all three groups exhibited significantly lower score than the placebo-group (PBA, vitD3or PBA+vitD3vs. placebo
(p= 0.003,p= 0.042 andp= 0.036 respectively). At week 12, TB score remained significantly lower in the PBA and PBA+vitD3(p= 0.001 andp= 0.009) group compared to the placebo
(Fig 7A).
At week 0, 8, 12 and 24, the composite TB score also included chest x-ray data. The TB score data were analyzed by ANCOVA after adjusting for age and sex. The complete data set for longitudinal analysis of chest x-ray was available for 211 out of the total of 219 TB patients. Reasons for missing results included chest x-ray plates that were insufficient or unavailable to the study physician. Here, the PBA-group showed significantly lower TB score compared to the placebo-group at week-8 (p= 0.042) and week-12 (p= 0.003) (Fig 7B).
Patients were stratified into vitD3-supplemented (vitD3and PBA+vitD3) and non-vitD3
supplemented groups (PBA and placebo). The proportions of patients being culture-negative at week 4 and week 8 were higher in the vitD3-supplemented-group compared to non-vitD3
-group (week 4, 66%; 84/127 vs. 44%; 54/122; p = 0.001) (week 8, 96.9%; 123/127 vs. 90.2%; 110/ 122;p= 0.031) respectively. Moreover in the vitD3-supplemented-group, the odds of sputum
culture being negative at week 4 was 2.49 times (95% CI, 1.48–4.17,p= 0.001) and at week 8, 3.37 times (95% CI, 1.05–10.8,p= 0.041) higher compared to non-vitD3-group respectively.
However, when clinical endpoints were considered, the odds of recovery from cough at week 2 was 2.42 (95% CI, 1.05–5.58) times lower in the vitD3-supplemented-group compared to the
non-vitD3-group (p = 0.038).
Discussion
with PBA alone or in combination with vitD3to TB patients would increase the expression of
the AMP LL-37, a marker for multiple AMPs, in alveolar macrophages and pulmonary epithe-lium and eventually accelerate elimination ofMtbbacilli from the respiratory tract. Adjunct therapy with vitD3alone or in combination with PBA showed increased sputum culture Fig 6. Kaplan Meier survival graph for monocyte-derived-macrophage (MDM)-mediated killing ofMycobacterium tuberculosis (Mtb).Data are expressed as viability ofMtbin‘relative CFU (colony forming unit) counts’. A‘relative CFU count’was calculated by normalizing the data in each time point with the inoculatedMtbCFU. A cut-off of 0.1 was considered as zero. PBA-group exhibited significantly earlier decline in intracellularMtbCFU counts after MDM-mediated killing compared to the placebo-group.
conversion at week 4 and vitD3alone at week 8 compared to the placebo group. Importantly,
treatment with PBA, vitD3or the combination also resulted in reduced clinical symptoms. In
line with an improvement of the primary outcomes, treatment with PBA and vitD3also
resulted in a synergistic increased expression of LL-37 in immune cells that was paralleled with an enhanced intracellular killing ofMtbin macrophagesex vivo(Fig 6).
In similar clinical trials, the primary endpoint is usually culture conversion assessed at sev-eral time points after initiation of TB therapy. Although there are no published data on sputum culture conversion in Bangladesh, the smear conversion rate of Bangladeshi TB patients is esti-mated as fairly good ranging from 13 to 22 days (K Zaman, personal communication). Marti-neauet alhave demonstrated that the median time to sputum culture conversion was 36 days in TB patients [17]. Accordingly, week 4 was selected as the readout time point for culture con-version in this study. Indeed, significant changes in the other outcome variables were also noted already at week 4 including reduction of TB scores, significantly elevated concentration
Fig 7. Mean TB score in TB patients in the four intervention arms during the study period.Standard deviation is shown as vertical bar. Comparisons of intervention arms are made with the placebo arm with statistically significant differences being shown in asterisks. The PBA-group demonstrated significantly lower TB scores than the placebo group at week 2, 4, 8, 10 and 12. At week 10 all three intervention groups showed lower scores than the placebo group. Multivariate regression analysis was utilized for comparison of mean effect of clinical scores in the different intervention groups.
of plasma 25(OH)D3, LL-37 mRNA, LL-37 peptide in PBMC and lymphocytes in the different
intervention groups compared to the placebo. Significant changes in the same variables were also evident at week 8.
A significant effect of adjunctive therapy with PBA could be demonstrated using a compos-ite TB score including resolution of symptoms [30,41]. PBA alone was able to reduce clinical TB symptoms as early as the 2ndweek of treatment; the effect persisted until week 12 (Fig 7). Adding chest x-ray to the TB score further supported a beneficial effect of adjunct PBA treat-ment from week 8 to 12 [33]. The resolution of clinical symptoms was also reflected by reduced neutrophil counts in the PBA and PBA+vitD3treatment groups. In this study, we did not find
a decrease in the ratio of lymphocyte and monocyte as shown by Martineaue et al [17], how-ever, monocyte counts alone declined significantly after adjunct therapy with PBA+vitD3
which is also suggestive of resolution of inflammation. Importantly, our significant finding on the TB scores should be interpreted with caution since the decline in TB scores was also signifi-cant in the placebo group. It is difficult to show an adjunctive effect of immunotherapy with PBA and vitD3on top of the highly effective standard DOTS therapy. However, as our aim was
to decrease the time of standard therapy and to reduce side effects, the biological effects of PBA and vitD3may still be clinically relevant.
The role of 1,25(OH)2D3as an inducer of LL-37 expression has previously been
well-estab-lished [11]. Ourin vitrostudies have shown that PBA can induce the level of LL-37 mRNA and the production of the LL-37 peptide in both lung epithelial cells [24] and human macrophages [42]. Importantly, a synergistic effect on LL-37 expression was observed when 1,25(OH)2D3
was combined with PBA [24] as seenex vivoin the current study. A recentin vitrostudy have been shown that, PBA together with vitamin D enhance the antimicrobial and anti-inflamma-tory effects againstMtbinfection in macrophages [43]. We have also provided evidence that oral supplementation with PBA and vitD3can induce LL-37 in MDM and lymphocytes in
healthy volunteers that was linked to an improved killing of intracellularMtbby infected mac-rophagesex vivo[26]. Here we show that the PBA+vitD3and the vitD3-groups exhibited a
more rapid sputum culture conversion detected already at week 4 compared to the placebo-group. Furthermore, enhanced bactericidal capacity of MDM was significant in the PBA group. The MDM was cultured from peripheral mononuclear cells of TB patients which might behave differently compared to tissue-resident macrophages, since circulating monocytes do not always end up replenishing tissue macrophage populations [44]. Our findings may indicate that there was a synergistic effect between PBA and vitD3in elimination of bacteria from the
lungsin vivoin the early phase of the treatment, where resident macrophages and additional immune cells have a major role.
Altogether, the findings of reduced TB scores, increased LL-37 concentration in MDM and increased MDM-mediated killing ofMtbin the PBA-group, suggest an important role of AMPs, such as LL-37, in the recovery from TB disease. Remission of clinical TB symptoms is probably through resolution of inflammatory responses as well as mycobacterial clearance from the body. Besides antimicrobial functions, LL-37 exhibits immune-modulatory activities [45] including both pro- and anti-inflammatory functions. For example, local effects of LL-37 include influences on cytokine/chemokine production, macrophage development and differen-tiation toward an inflammatory M1 phenotype [46–48] and enhanced phagocytosis by macro-phages [49]. In addition, LL-37 can reduce pro-inflammatory cytokine production by down-regulation of signaling through TLR4 via binding to LPS and/or interrupt function of the TLR4 receptor complex in macrophages and dendritic cells [50–53]. Furthermore, LL-37 has been linked to receptor-mediated autophagy [42].
Bangladeshi TB patients demonstrated low vitD3status and 26–48% patients demonstrated
hypocalcaemia at baseline. Treatment with vitD3increased plasma levels of 25(OH)D3in both
vitD3and PBA+vitD3arms. However, there were no cases of hypercalcaemia, although
hypo-calcaemia persisted in patients who had low calcium at baseline. We found that the 2-month dose of vitD3used in the trial enabled almost 100% patients to attain sufficient vitamin D status
(>50 nmol/L). PBA is an FDA approved drug for urea cycle disorders [23] and a dose up to 10
g/day can be safely used for this purpose, which is about 10 fold higher compared to the dose used in the present trial (1g/day). There were no adverse events specifically linked to the PBA or vitD3intervention, the majority of the adverse events was very likely due to standard
anti-TB therapy.
The limitations of this study were that negativeMtbculture results were not examined for non-tuberculosis mycobacteria, although these patients received DOTS. The use of antibiotics (penicillin and streptomycin) in cell culture media for preventing contamination may have some effect on intracellular growth ofMtbin MDM. In line with other reports using vitD3
adjunct therapy in the treatment of TB, we also showed that the vitD3intervention did not
have an impact on time to sputum smear conversion [17,54–56]. Importantly, in contrast to our findings, none of these clinical trials showed any impact on sputum culture conversion. Only, Martineauet alshowed significantly hastened sputum culture conversion in a sub-group of patients with polymorphism in TaqI vitamin D receptor genotype with improved respon-siveness to supplementation [17]. The strengths of our study are the convenience of dosing reg-imen of adjunctive therapy that matched with 2 months’duration of 4-FDC in the standard treatment regimen of DOTS; the daily dose of vitD3(5000 IU) for 2 months (total dose 300,000
IU) significantly increased the plasma 25(OH)D3levels in TB patients that sustained for 6
months. In most TB trials, a high dose of vitamin D eg. up to 100,000 IU has typically been administrated at 3–4 occasions during standard anti-TB treatment, which has not provided any clear evidence of adjunctive treatment efficacy [54,56,57]. Importantly, the dose and/or dosing interval required for antimycobacterial therapy is not known and thus it may be insuffi-cient to give such bolus doses. It has been proposed that daily dosing could be more beneficial than bolus dosing in the treatment of respiratory diseases [58,59]. A dose of 150,000 IU of vitD3given to Indonesian patients did not result in beneficial effects on TB outcomes [54].
Two intramuscular doses of 600,000 IU of vitD3in Pakistani patients resulted in greater weight
gain and rapid radiographic clearance of the disease in the intervention group. However, con-centration of vitD3was not determined after supplementation in either study, thus it was not
clear if the clinical improvement was associated with elevated 25(OH)D3levels [55]. In a trial
in Guinea-Bissau, a total dose of 300,000 IU did not result in higher serum 25(OH)D3in the
intervention group compared to the controls [56]. Also opposed to our study, the TB patients in two of the other trials were not vitamin D insufficient or deficient at baseline (60 nmol/L), which is probably an important prerequisite to observe a positive clinical effect of vitD3
supple-mentation [54,55]. We assumed that vitamin D has to be administered in a concentrated dose (5000 IU/day) at much earlier and more frequent time points (i.e. daily for 2 months) in order to have an optimal antimycobacterial effect and to significantly shorten the duration of stan-dard anti-TB chemotherapy. Moreover, PBA was added as an additional adjunct therapeutic compound for enhanced impact.
indications that this type of host-directed therapy can be exploited to fight respiratory infec-tions by enhancing innate immunity, antimicrobial activity and modulating immune responses. Further studies are needed to understand the role of PBA and vitD3in reducing
inflammatory responses or restoring appropriate immune responses in the treatment of MDR-TB, extra-pulmonary TB as well as TB and associated co-morbidities including diabetes or HIV.
Supporting Information
S1 CONSORT Checklist. CONSORT Checklist. (DOCX)
S1 Protocol. Study Protocol. (PDF)
S1 Table. Clinical parameters used for clinical scores. (DOCX)
S2 Table. Differences between baseline characteristics when randomized patients were compared to potentially eligible patients who declined or had to be excluded from the study.
(DOCX)
S3 Table. Vitamin D (25-hydroxyvitamin D3) status of TB patients at baseline and at 8 and 24 weeks after initiation of adjunctive therapy.
(DOCX)
S1 Text. Consent. Sample informed consent form. (PDF)
S2 Text. Report. Sample case report form. (PDF)
Acknowledgments
The authors express their gratitude to the TB patients who participated in the clinical trial. The authors also express their sincere thanks to Saiful Islam, Shamim Hossain, Dr. Sabrina Jabeen and Dr Barkatullah (NIDCH) for their support in patient enrollment and collecting data. We acknowledge the kind assistance provided by the staff at the DOTS centre as well as in the National Tuberculosis Reference Laboratory at NIDCH for their efforts in the implementation of the study.
Author Contributions
Conceived and designed the experiments: RR BA GHG. Performed the experiments: AM LK RSR ZR SMMK ASMA. Analyzed the data: MAH RR. Contributed reagents/materials/analysis tools: RR BA GHG. Wrote the paper: BA GHG AM RSR KZ PB SB. Contributed overall coordi-nation of the project: ASMA.
References
2. Gandhi NR, Shah NS, Andrews JR, Vella V, Moll AP, Scott M, et al. HIV coinfection in multidrug- and extensively drug-resistant tuberculosis results in high early mortality. Am J Respir Crit Care Med. 2010; 181(1):80–6. doi:10.1164/rccm.200907-0989OCPMID:19833824.
3. Lönnroth K. The looming co-epidemic of TB-diabetes: A call to action. International Union Against Tuberculosis and Lung Disease, 2014.
4. Organization WH. Drug-resistant TB—surveillance & response. France: World Health Organization, 2014 Contract No.: WHO/HQ/TB/2014.12.
5. Wong EB, Cohen KA, Bishai WR. Rising to the challenge: new therapies for tuberculosis. Trends Micro-biol. 2013; 21(9):493–501. PMID:23764389. doi:10.1016/j.tim.2013.05.002
6. Wang TT, Nestel FP, Bourdeau V, Nagai Y, Wang Q, Liao J, et al. Cutting edge: 1,25-dihydroxyvitamin D3 is a direct inducer of antimicrobial peptide gene expression. J Immunol. 2004; 173(5):2909–12. PMID:15322146.
7. Schauber J, Dorschner RA, Yamasaki K, Brouha B, Gallo RL. Control of the innate epithelial antimicro-bial response is cell-type specific and dependent on relevant microenvironmental stimuli. Immunology. 2006; 118(4):509–19. doi:10.1111/j.1365-2567.2006.02399.xPMID:16895558; PubMed Central PMCID: PMC1782325.
8. Kai-Larsen Y, Agerberth B. The role of the multifunctional peptide LL-37 in host defense. Front Biosci. 2008; 13:3760–7. PMID:18508470.
9. Castaneda-Sanchez JI, Garcia-Perez BE, Munoz-Duarte AR, Baltierra-Uribe SL, Mejia-Lopez H, Lopez-Lopez C, et al. Defensin production by human limbo-corneal fibroblasts infected with mycobac-teria. Pathogens. 2013; 2(1):13–32. doi:10.3390/pathogens2010013PMID:25436879; PubMed Cen-tral PMCID: PMC4235707.
10. Liu PT, Stenger S, Li H, Wenzel L, Tan BH, Krutzik SR, et al. Toll-like receptor triggering of a vitamin D-mediated human antimicrobial response. Science. 2006; 311(5768):1770–3. doi:10.1126/science. 1123933PMID:16497887.
11. Liu PT, Stenger S, Tang DH, Modlin RL. Cutting edge: vitamin D-mediated human antimicrobial activity against Mycobacterium tuberculosis is dependent on the induction of cathelicidin. J Immunol. 2007; 179(4):2060–3. PMID:17675463.
12. Yuk JM, Shin DM, Lee HM, Yang CS, Jin HS, Kim KK, et al. Vitamin D3 induces autophagy in human monocytes/macrophages via cathelicidin. Cell Host Microbe. 2009; 6(3):231–43. doi:10.1016/j.chom. 2009.08.004PMID:19748465.
13. Nnoaham KE, Clarke A. Low serum vitamin D levels and tuberculosis: a systematic review and meta-analysis. Int J Epidemiol. 2008; 37(1):113–9. doi:10.1093/ije/dym247PMID:18245055.
14. Davies PD. A possible link between vitamin D deficiency and impaired host defence to Mycobacterium tuberculosis. Tubercle. 1985; 66(4):301–6. PMID:3936248.
15. Grange JM, Davies PD, Brown RC, Woodhead JS, Kardjito T. A study of vitamin D levels in Indonesian patients with untreated pulmonary tuberculosis. Tubercle. 1985; 66(3):187–91. PMID:4049530. 16. Sasidharan PK, Rajeev E, Vijayakumari V. Tuberculosis and vitamin D deficiency. J Assoc Physicians
India. 2002; 50:554–8. PMID:12164408.
17. Martineau AR, Timms PM, Bothamley GH, Hanifa Y, Islam K, Claxton AP, et al. High-dose vitamin D(3) during intensive-phase antimicrobial treatment of pulmonary tuberculosis: a double-blind randomised controlled trial. Lancet. 2011; 377(9761):242–50. doi:10.1016/S0140-6736(10)61889-2PMID: 21215445; PubMed Central PMCID: PMC4176755.
18. Zumla A, Rao M, Parida SK, Keshavjee S, Cassell G, Wallis R, et al. Inflammation and tuberculosis: host-directed therapies. J Intern Med. 2014. PMID:24717092.
19. Mayer-Barber KD, Andrade BB, Oland SD, Amaral EP, Barber DL, Gonzales J, et al. Host-directed ther-apy of tuberculosis based on interleukin-1 and type I interferon crosstalk. Nature. 2014; 511(7507):99– 103. doi:10.1038/nature13489PMID:24990750.
20. Czyz DM, Potluri LP, Jain-Gupta N, Riley SP, Martinez JJ, Steck TL, et al. Host-directed antimicrobial drugs with broad-spectrum efficacy against intracellular bacterial pathogens. MBio. 2014; 5(4): e01534–14. doi:10.1128/mBio.01534-14PMID:25073644; PubMed Central PMCID: PMC4128363. 21. Schauber J, Svanholm C, Termen S, Iffland K, Menzel T, Scheppach W, et al. Expression of the
catheli-cidin LL-37 is modulated by short chain fatty acids in colonocytes: relevance of signalling pathways. Gut. 2003; 52(5):735–41. PMID:12692061.
22. Raqib R, Sarker P, Bergman P, Ara G, Lindh M, Sack DA, et al. Improved outcome in shigellosis associ-ated with butyrate induction of an endogenous peptide antibiotic. Proc Natl Acad Sci U S A. 2006; 103 (24):9178–83. PMID:16740661.