TP53
Mutation,
SOX2
,
SOX4
and
OCT-4
Expression Levels
Thais Fernanda de Almeida Galatro1*, Miyuki Uno1,2, Sueli Mieko Oba-Shinjo1,2, AntonioNogueira Almeida1, Manoel J. Teixeira1, Se´rgio Rosemberg3, Suely Kazue N. Marie1,2
1Department of Neurology, School of Medicine, University of Sa˜o Paulo, Sa˜o Paulo, Sa˜o Paulo, Brazil,2Center of Translational Oncology, Instituto do Caˆncer do Estado de Sa˜o Paulo (ICESP), Sa˜o Paulo, Sa˜o Paulo, Brazil,3Department of Pathology, School of Medicine, University of Sa˜o Paulo, Sa˜o Paulo, Sa˜o Paulo, Brazil
Abstract
Inhibitor of DNA Binding 4 (ID4) is a member of the helix-loop-helix ID family of transcription factors, mostly present in the central nervous system during embryonic development, that has been associated withTP53mutation and activation of
SOX2. Along with other transcription factors, ID4 has been implicated in the tumorigenic process of astrocytomas, contributing to cell dedifferentiation, proliferation and chemoresistance. In this study, we aimed to characterize theID4
expression pattern in human diffusely infiltrative astrocytomas of World Health Organization (WHO) grades II to IV of malignancy (AGII-AGIV); to correlate its expression level to that of SOX2, SOX4, OCT-4 and NANOG, along with TP53
mutational status; and to correlate the results with the clinical end-point of overall survival among glioblastoma patients. Quantitative real time PCR (qRT-PCR) was performed in 130 samples of astrocytomas for relative expression, showing up-regulation of all transcription factors in tumor cases. Positive correlation was found when comparingID4relative expression of infiltrative astrocytomas withSOX2(r= 0.50;p,0.005),SOX4(r= 0.43;p,0.005) andOCT-4(r= 0.39;p,0.05). The results from TP53 coding exon analysis allowed comparisons between wild-type and mutated status only in AGII cases, demonstrating significantly higher levels ofID4,SOX2andSOX4in mutated cases (p,0.05). This pattern was maintained in secondary GBM and further confirmed by immunohistochemistry, suggesting a role for ID4, SOX2 and SOX4 in early astrocytoma tumorigenesis. Combined hyperexpression ofID4,SOX4andOCT-4conferred a much lower (6 months) median survival than did hypoexpression (18 months). Because both ID4 alone and a complex of SOX4 and OCT-4 activateSOX2
transcription, it is possible that multiple activation ofSOX2 impair the prognosis of GBM patients. These observational results of associated expression ofID4withSOX4andOCT-4may be used as a predictive factor of prognosis upon further confirmation in a larger GBM series.
Citation:Galatro TFdA, Uno M, Oba-Shinjo SM, Almeida AN, Teixeira MJ, et al. (2013) Differential Expression ofID4and Its Association withTP53Mutation,SOX2,
SOX4andOCT-4Expression Levels. PLoS ONE 8(4): e61605. doi:10.1371/journal.pone.0061605 Editor:Javier S. Castresana, University of Navarra, Spain
ReceivedSeptember 27, 2012;AcceptedMarch 11, 2013;PublishedApril 16, 2013
Copyright:ß2013 Galatro et al. This is an open-access article distributed under the terms of the Creative Commons Attribution License, which permits unrestricted use, distribution, and reproduction in any medium, provided the original author and source are credited.
Funding:This study was supported by grants from Conselho Nacional de Pesquisa (CNPq), Coordenac¸a˜o de Aperfeic¸oamento de Pessoal de Nı´vel Superior (CAPES), Fundac¸a˜o Faculdade de Medicina (FFM) and the tumor tissues bank of the Clinical Genomics Project supported by Fundac¸a˜o de Amparo a` Pesquisa do Estado de Sa˜o Paulo (FAPESP, process#04/12133-6) and the Ludwig Institute for Cancer research. The funders had no role in study design, data collection and analysis, decision to publish, or preparation of the manuscript.
Competing Interests:The authors have declared that no competing interests exist.
* E-mail: [email protected]
Introduction
Inhibitor of DNA Binding (ID) proteins (ID1–4) belong to the helix-loop-helix (HLH) superfamily of transcription factors and exert their functions through the highly conserved HLH dimer-ization domain. Due to the lack of a DNA binding domain, IDs sequester and inhibit the activity of their specific target proteins, playing important roles in cell cycle control, growth, differentia-tion, angiogenesis and tumorigenesis [1–4]. In healthy organisms,
ID expression is up-regulated in stem and progenitor cells, maintaining self-renewal capacity, pluripotency and an undiffer-entiated state. However, ID expression declines to basal values when cells differentiate towards the destined specific lineage [5], [6]. The expression of ID1–3 proteins is widespread, while the ID4 expression pattern is restricted to the developing brain, particu-larly in neural progenitor cells [7]. The overexpression of IDs in tumor cells has been suggested to induce reversion to an embryonic-like state, with high rates of proliferation, migration and neo-angiogenesis facilitating tumor formation [4].
vivo experiments, resulting in formation of high grade gliomas according to clinical and histological analysis [15]. These results may be consistent with astrocyte dedifferentiation to an immature progenitor-like state. It has also been demonstrated that ID4 protein activates SRY (sex determining region Y)-box 2 (SOX2)
transcription in GBM and glioma stem cells [16]. Similarly, SOX4 and POU class 5 homeobox 1 (OCT-4) proteins were also shown to activateSOX2transcription in glioma initiating cells [17], [18]. Along with Nanog homeobox (NANOG), these transcription factors are highly expressed in embryonic, progenitor, and tumor stem cells, in contrast to the low levels of expression that are found in differentiated cells [19–21].
This study aimed to characterize theID4expression pattern in human astrocytomas of grades II to IV of malignancy; to correlate its expression level to that of SOX2, SOX4, OCT-4and NANOG, along with TP53 mutational status; and to correlate the results with the clinical end-point of overall survival among GBM patients. In parallel, expression of the neural and brain tumor stem cell markerCD133was assessed to better evaluate the progenitor cell condition [22–23].
Materials and Methods
Tissue Samples and Ethical Statement
One hundred and thirty diffusely infiltrative astrocytomas (grades II to IV) were obtained during therapeutic surgery of patients treated by the Neurosurgery Group of the Department of Neurology at Hospital das Clı´nicas at the School of Medicine of the University of Sa˜o Paulo, in the period of 2000 to 2007. The cases were categorized according to the WHO grading system [8] by neuropathologists from the Division of Pathological Anatomy of the same institution. The studied series consisted of 26 AGII, 18 AGIII, 86 GBM, and 22 non-neoplastic (NN) brain anonymized cases from epilepsy patients subjected to temporal lobectomy. Demographic data of the studied cases is presented in Table 1, and the clinical findings are presented in Table S1. Samples were macrodissected and immediately snap-frozen in liquid nitrogen upon surgical removal. A 4mm-thick cryosection of each sample was analyzed under a light microscope after hematoxylin-eosin staining for assessment of necrotic, cellular debris and non-neoplastic areas (in tumor samples), followed by removal from the frozen block by microdissection prior to DNA and RNA extractions [24], [25]. Eighty-one GBM patients (94.2%) present-ed with onset of clinical symptoms within 3 months prior to diagnostic surgical intervention and were classified as presenting primary GBM. Five GBM patients (5.8%) presented a tumor which was resected over one year after a lower grade astrocytoma (grade II or III), and were designated as secondary GBM cases. Written informed consent was obtained from all patients according to the ethical guidelines approved by the Department of Neurology, School of Medicine, University of Sa˜o Paulo (0599/ 10).
Sample Preparation
Total RNA was extracted from frozen tissues (tumor and non-neoplastic) using an RNeasy Mini Kit (Qiagen, Hilden, Germany). Evaluation of RNA concentration and purity were carried out by measuring absorbance at 260 and 280 nm. Ratios of 260/280 measures ranging from 1.8 to 2.0 were considered satisfactory for purity standards. Denaturing agarose gel electrophoresis was used to assess the quality of the samples. A conventional reverse transcription reaction was performed to yield single-stranded cDNA. The first strand of cDNA was synthesized from 1mg of total RNA previously treated with 1 unit of DNase I (FPLC-pure,
GE Healthcare, Uppsala, Sweden) using random and oligo (dT) primers, RNase inhibitor, and SuperScript III reverse transcrip-tase according to the manufacturer’s recommendations (Life Technologies, Carlsbad, USA). The resulting cDNA was subse-quently treated with 1 unit of RNase H (GE Healthcare, Uppsala, Sweden), diluted with TE buffer, and stored at220uC until later use.
Quantitative Real Time PCR (qRT-PCR)
The relative expression level of ID4, SOX2, SOX4, OCT-4,
NANOGandCD133were analyzed by qRT-PCR, using the SYBR Green approach. Quantitative data were normalized in relation to the geometric mean of three housekeeping genes, suitable for the analysis: hypoxanthine phosphoribosyltransferase (HPRT), glucu-ronidase beta (GUSB) and TATA box binding protein (TBP), as previously demonstrated by our group [26]. The primers were designed to amplify 80–120 bp amplicons, with a melting temperature of 60uC and were synthesized by IDT (Integrated DNA Technologies, Coralville, USA) as follows (59to 39):ID4 F: TGAACAAGCAGGGCGACAG, ID4 R: CCCTCTCTAGTGCTCCTGGCT;SOX2F: AAGAGAACAC-CAATCCCATCCA, SOX2 R: AGTCCCCCAAAAA-GAAGTCCA; SOX4 F: CAGAAGGGAGGGGGAAACATA,
SOX4 R: GAATCGGCACTAAGGAGTTGGT; NANOG F: GCAAGAACTCTCCAACATCCTGA, NANOG R: CATTGC-TATTCTTCGGCCAGTT; OCT-4F: CGTGAAGCTGGA-GAAGGAGA, OCT-4R: CTTGGCAAATTGCTCGAGTT;
CD133 F: TCGGAAACTGGCAGATAGCAA, CD133 R: GTGAACGCCTTGTCCT; HPRT F: TGAGGATTTG-GAAAGGGTGT,HPRTR: GAGCACACAGAGGGCTACAA;
GUSBF: GAAAATACGTGGTTGGAGAGCTCATT,GUSBR: CCGAGTGAAGATCCCCTTTTTA; TBP F: AGGATAAGA-GAGCCACGAACCA, TBP R: CTTGCTGCCAGTCTG-GACTGT. The minimum primer concentrations necessary were determined to give the lowest threshold cycle (Ct) and maximum amplification efficiency, while minimizing non-specific amplifica-tion. Primer concentrations used were 150 nM forID4, 200 nM forHPRT,TBP,SOX2,SOX4andOCT-4, and 400 nM forGUSB,
NANOG and CD133. Standard curve was established to ensure amplification efficiency and analysis of melting curves demon-strated a single peak for all PCR products. Additionally, agarose gel electrophoresis was employed to check the size of the PCR product amplified. SYBR Green I amplification mixtures (12ml) contained 3ml of cDNA, 6ml of 2X Power SYBR Green I Master Mix (Life Technologies, Carlsbad, USA) and forward and reverse primers. PCR reactions were run on an ABI Prism 7500 sequence detector (Life Technologies, Carlsbad, USA) as follows: 2 min at
Table 1.Demographic data from patients analyzed in this study.
Total of
cases Morphologya Mean age at diagnosis(years)b Genderc
22 NN 3867.6 12 F, 10 M
26 AGII 3468.1 11 F, 15 M
18 AGIII 35612.3 7 F, 11 M
86 GBM 54613.9 28 F, 58 M
a
NN, non-neoplastic; AGII, low-grade astrocytoma; AGIII, anaplastic astrocytoma; GBM, glioblastoma.
bAge at diagnosis was calculated from date of birth to date of surgery. cM, male; F, female.
50uC, 10 min of polymerase activation at 95uC, and 40 cycles of 15 s at 95uC and 1 min at 60uC. All the reactions were performed in duplicate. The following equations were applied to calculate gene relative expression according to primer efficiency (E) in tumor samples versusthe mean of non-neoplastic tissues: 22DDCt [27] forSOX2,SOX4,OCT-4andCD133; and 1+E2DDCt[28] for
ID4andNANOG, whereDCt = Ct specific gene- geometric mean Ct of housekeeping genes and DDCt =DCt tumor – meanDCt non-neoplastic. For statistical analysis, gene expression status was scored as high or low expression in relation to the median relative expression value at each grade of astrocytoma.
DNA Extraction andTP53Mutational Analyses
DNA extraction was performed from frozen tumor tissues using All Prep DNA/RNA Mini Kit (Qiagen, Hilden, Germany), and peripheral leukocyte DNA was extracted by a salting-out procedure [29].
Whole coding TP53 exons (2 to 11) analysis was performed using the polymerase chain reaction single-strand conformation polymorphism (PCR-SSCP) assay and DNA sequencing, as previously reported [30,31].
Immunohistochemistry
For immunohistochemical detection, tissue sections were routinely processed and subjected to antigen retrieval. Briefly, slides were immersed in 10 mM citrate buffer, pH 6.0 and incubated at 122uC for 3 min using an electric pressure cooker
(BioCare Medical, Walnut Creek, USA). Specimens were then blocked and further incubated with the following antibodies raised against human ID4 (rabbit polyclonal, ab20988, Abcam, Cam-bridge, UK, 1:100), SOX2 (mouse clone 6, S1451, Sigma Aldrich, St. Louis, USA, 1:100), SOX4 (rabbit polyclonal, S7318, Sigma Aldrich, St. Louis, USA, 1:800) at 16–20uC for 16 hours. Development of the reaction was performed with a commercial kit (Novolink; Novocastra, Newcastle-upon-Tyne, UK) at room temperature, using diaminobenzidine and Harris hematoxylin for nuclear staining. Optimization using positive controls suggested by the manufacturer of each antibody (breast carcinoma for ID4 and SOX4 antibodies, and normal esophagus for SOX2), was performed in order to obtain optimal dilution. Staining intensity of tissue sections was evaluated independently by two observers (SKNM and TFAG). A semi-quantitative score system considering both intensity of staining and percentage of cells was applied as follows: for intensity of staining, 0 = negative, 1 = weak, 2 = mod-erate and 3 = strong; for cell percentage, 0 = no cells stained, 1 = 10–25%, 2 = 26–50%, 3 = 51–75% and 4 = 76–100%. Only cases with positive cell staining with scores$2 were considered as positive. Digital photomicrographs of representative fields were captured and processed using PICASA 3 (Google, Mountain View, USA).
Statistical Analysis
The statistical analysis of relative gene expression in different grades of astrocytoma was assessed using the Kolmogorov-Smirnov normality test, and the non-parametric Kruskal-Wallis
Figure 1. Expression levels of genes in diffusely infiltrative astrocytomas (AGII to GBM).Transcript levels ofID4(A),SOX2(B),SOX4(C), OCT-4(D),NANOG(E) andCD133(F) were determined in 26 low-grade astrocytomas (AGII), 18 anaplastic astrocytomas (AGIII) and 86 GBM cases relative to 22 non-neoplastic (NN) by quantitative real-time PCR. Relative expression values were calculated based on the geometric mean ofHPRT, GUSBandTBPexpression levels of each sample and non-neoplastic brain values. The following equations were applied to calculate gene relative expression according to primer efficiency (E) in tumor samplesversusthe mean of non-neoplastic tissues: 22DDCt[27] forSOX2,SOX4,OCT-4and CD133; and 1+E2DDCt[28] forID4andNANOG, whereDCt = Ct specific gene – mean Ct of housekeeping genes andDDCt =DCt tumor – meanDCt
non-neoplastic. Red dots represent the secondary GBM cases. Horizontal bars show the median of each group and the values are presented in Table 2. NANOGexpression in 15 NN and 40 GBM cases was very low and, as a result, the horizontal bar for NN does not appear in the graphic (median = 0). The difference of relative gene expressions among the groups were statistically significant (p,0.0005 forID4,SOX2,SOX4,OCT-4andNANOG; and p,0.05 forCD133,Kruskal-Wallis test). A pair-based comparison was assessed using Dunn test. Thepvalue results are shown, where ***p,0.0005, **p,0.005 and *p,0.05.
and Dunn tests. Correlation between relative gene expression values was assessed using the non-parametric Spearman-rho correlation test and the parametric Pearson’s correlation test. The Mann-Whitney test was used to compare TP53mutational status and relative gene expression. The Kaplan-Meier survival curve was analyzed using the log-rank (Mantel Cox) test and multivariate analysis using the Cox proportional hazards model. The logistic regression model included the following parameters: age at diagnosis, gender (female versus male), degree of tumor surgical resection (gross total resection (GTR) versus partial resection (PR) and gene expression status (hyper or hypoexpres-sion). Differences were considered statistically significant when
p,0.05. Calculations were performed using SPSS, version 15.0 (IBM, Armonk, USA).
Results
Relative Expression Levels in Diffusely Infiltrative Astrocytomas
Gene expression analysis by qRT-PCR forID4showed higher median expression levels in all diffusely infiltrative astrocytoma cases (AGII to GBM) relative to the NN cases, and comparison among the groups was statistically significant (Figure 1A,
p,0.0005, Kruskall-Wallis test). Although the ID4 median expression level in GBM cases was lower than in AGII and AGIII, there was a variability of these expression values, with cases presenting both higher and lower values than the other grades. Similar variability ofID4 expression was also observed in AGII and AGIII (Figure 1A). A multivariate Cox regression model (which considered age at diagnosis, gender, degree of tumor surgical resection, and ID4 expression status) showed that ID4
expression (hyper or hypoexpression) alone had no impact on patient’s prognosis. Only age at diagnosis was an independent prognostic factor (hazard ratio = 1.02, p= 0.02). SOX2, SOX4,
OCT-4,NANOG, andCD133also showed higher mRNA levels in AGII-GBM cases in comparison to NN, as shown in Figure 1B– 1F.SOX2expression levels were compared toID4levels to verify the degree of their co-expression in human diffusively infiltrative astrocytomas. Interestingly, the correlation analysis of SOX2
showed mRNA levels similar to ID4, with positive correlation found in AGII (r= 0.731;p= 0.00002), AGIII (r= 0.671;p= 0.006) and GBM (r= 0.334; p= 0.0006). Next, SOX4, OCT-4, NANOG
andCD133expression levels were also evaluated.SOX4expression
levels were similar to those ofID4, although positive correlation was only found in AGII (r= 0.568;p= 0.002) and GBM (r= 0.414;
p= 0.00009).OCT-4relative expression correlated positively with
ID4in AGIII (r= 0.551;p= 0.02) and GBM (r= 0.364;p= 0.01). In contrast to the other analyzed genes, several GBM cases exhibited very low expression levels ofNANOG, and no correlation was found betweenID4 and NANOG expression levels. ID4 and
CD133expressions did neither not correlate. An overview of the results of analyzed correlations is shown in Figure 2.
It is interesting to note that secondary GBM cases (red dots on Figure 1) exhibited a higher median expression level forID4(2.78) than did primary GBM cases (1.84). Similar results were obtained for SOX2(3.96 for secondary and 2.26 for primary GBM) and
SOX4(48.99 for secondary and 6.74 for primary). In contrast, the median of OCT-4 expression was 0.47 in secondary GBM and 2.03 in primary GBM; the median ofNANOGexpression level in secondary GBM was 0.13 while 0.35 in primary GBM, and the median ofCD133expression level was 1.28 for secondary GBM and 2.26 for primary GBM. To further investigate the factors contributing to these differences, the expression values were analyzed according toTP53mutation status.
Association betweenID4,SOX2,SOX4, andNANOGmRNA Expressions andTP53 Mutation Status
The frequency ofTP53mutation was 11.6% in GBM (10 out of 86), 16.6% in AGIII (3 out of 18) and 50% in AGII (13 out of 26), as described in our previous studies [30,31] (Table S1). Our GBM series is composed mainly by primary GBMs, which explains the low frequency ofTP53mutation and corroborates the classifica-tion based on clinical presentaclassifica-tion. The low frequency ofTP53
mutations in GBM and AGIII cases did not permit statistical analyses of the proposed parameters; however, this analysis was feasible among AGII cases. Interestingly, TP53-mutated AGII cases showed higher relative expression ofID4when compared to AGII cases with wild-type TP53 (p= 0.048) (Figure 3A). Also,
SOX2(p= 0.044),SOX4(p= 0.004) andNANOG(p= 0.025) relative expressions were higher in mutated than in wild-type TP53 in AGII cases (Figure 3B, 3C and 3E respectively). No difference was found for OCT-4 relative expression between wild-type and mutated TP53 cases (Figure 3D). Despite the fact that
TP53-mutated AGII cases displayed slightly higher relative expression of
CD133, the difference was not statistically significant (Figure 3F). No difference in expression was found regarding the different types of TP53 mutations (whether missense, nonsense or in splicing sites). Mann-Whitney test was applied for all the above statistical analysis. Moreover, no significant impact was observed in the overall survival time or in the progression free survival time in AGII cases, concerning either relative expression levels of ID4, SOX2, SOX4, OCT4, NANOG, and CD133 or TP53 mutational status (results presented Table S2). AlthoughTP53mutated AGII cases presented a median of 40 months of overall survival time compared to a median of 51 months of wild-type TP53 AGII cases, it did not reach statistical significance because of the small number of cases in each group (Figure 3, white lozenges for deceased AGII patients).
Associated expression of ID4, SOX2 and SOX4 with TP53
mutational status was further confirmed at the protein level by immunohistochemistry. The wild type TP53 AGII cases
Figure 2. Correlation betweenID4andSOX2,SOX4,OCT-4,NANOGandCD133expression levels in diffusely infiltrative astrocytomas.
Correlation was assessed in AGII (A, D, G, J, M), AGIII (B, E, H, K, N) and GBM (C, F, I, L, O) cases.ID4expression level was correlated toSOX2(A-C),SOX4 (D-F),OCT-4(G-I),NANOG(J-L) andCD133(M-O) expression levels. The significant correlations are shown in black and the non-significant in grey.r correlation coefficient assessed by Spearman-rho test, andr*by Pearson’s correlation test.
doi:10.1371/journal.pone.0061605.g002
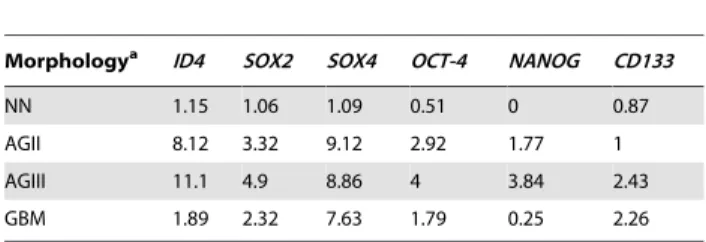
Table 2.Median of relative expression levels of the analyzed genes in astrocytomas, according to morphology.
Morphologya ID4 SOX2 SOX4 OCT-4 NANOG CD133
NN 1.15 1.06 1.09 0.51 0 0.87
AGII 8.12 3.32 9.12 2.92 1.77 1
AGIII 11.1 4.9 8.86 4 3.84 2.43
GBM 1.89 2.32 7.63 1.79 0.25 2.26
aNN, non-neoplastic; AGII, low-grade astrocytoma; AGIII, anaplastic astrocytoma; GBM, glioblastoma.
(Figure 4A–4C) showed weak or no staining for the three targets in comparison to theTP53-mutated cases (Figure 4D–4F), as did the primary GBM cases (Figure 4G–4I) when compared to the secondary GBM (Figure 4J–4L) cases.
The overview ofTP53mutation status, relative gene expression for AGII, and expression differences among AGII, AGIII, primary and secondary GBM are displayed as heatmap in Figure 5.
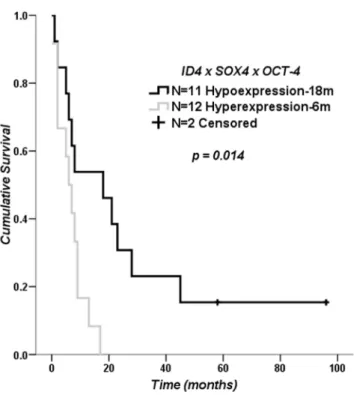
Impact ofID4,SOX4andOCT-4Expression Levels on Clinical Outcome for GBM Patients
Considering the variability of the relative expression values found in GBM cases, we evaluated the impact of up-regulation of the analyzed genes on overall patient survival. For the evaluation, conditions were determined for high and low gene expression.
Secondary GBM cases were excluded from this analysis due to the small number of cases. None of the genes had an impact on overall survival, either on their own or when grouped in pairs for the determined conditions (Figure S1). However, there was a significant difference when comparing GBM cases with high
ID4,SOX4andOCT-4expressions (median survival of 6 months) with cases with low expressions for the three genes (median survival of 18 months) (log rank p= 0.014), as shown on the Kaplan-Meier survival curve in Figure 6.
Discussion
We have demonstrated a differential expression of ID4 in human diffusely infiltrative astrocytoma cases demonstrating
Figure 3. Comparison of gene expression levels between the wild-typeTP53(WT TP53) and the mutatedTP53(Mutated TP53) in AGII cases.Higher expressions ofID4(A),SOX2(B),SOX4(C) andNANOG(E) were observed on the mutatedTP53AGII cases. No difference was found for OCT-4(D) andCD133(F) relative expression between the two groups. White lozenges represent the deceased patients. Thepvalues are: *p,0.05 and **p,0.005, Mann-Whitney test.
association withTP53mutation status, as well as toSOX2,SOX4
andOCT-4mRNA expression levels.
ID4 mRNA Levels are Elevated in Astrocytomas in Comparison to Non-neoplastic Brain Tissue
Our study demonstrated significantly higher mRNA expression levels of ID4 in astrocytomas when compared to non-neoplastic
brain tissue. Similar results have also been described for ID1–3 proteins in astrocytomas, with higher expression levels in tumors than in non-neoplastic white-matter [32]. A previous immunohis-tochemical report has shown stronger ID4 expression in GBM compared to AGII, AGIII and normal brain tissue [12]. Such association was not significant in our study, most probably due to a larger number of cases analyzed herein, and also to the
Figure 4. ID4, SOX2 and SOX4 immunohistochemistry.Representative cases of wild-typeTP53AGII (A-C), mutatedTP53AGII (D-F), primary GBM (G-I) and secondary GBM (J-L) stained for ID4, SOX2 and SOX4 are demonstrated. Both mutated AGII and secondary GBM cases showed stronger and larger number of nuclear stained cells (score 3 for intensity and$75% of positive cells) for ID4, SOX2 and SOX4. Comparatively, wild-typeTP53 AGII and primary GBM presented score 1 for intensity and,25% of positive cells. The reaction was performed in paraffin embeded tissue sections with a commercial polymer kit (Novolink; Novocastra, UK), using diaminobenzidine as developer and Harris hematoxylin for nuclear counterstaining. 2006magnification for all images.
heterogeneity inherent to GBM, here corroborated by the widespread ID4 mRNA expression among the studied GBM cases. Nevertheless, the increasedID4expression level in diffusely infiltrative astrocytoma is in accord with the tumor re-expression model of IDs [4], postulating ID4 as an additional marker of astrocytoma progression in malignancy.
A recent report [34] has shown that ID4 promoter methylation was an independent factor on patient’s prognosis, and that association of ID4 promoter methylation and MGMT
methylation status conferred significantly longer overall survival to GBM patients. We assessed the correlation between ID4
hypoexpression and the MGMT methylation status in GBM, previously reported by our group [33]. The Cox regression model showed onlyMGMT status as an independent factor for prognosis (hazard ratio = 4.684, p= 0.014), differing from the previous report. Further studies on ID4 promoter methylation are needed in the present GBM series.
Figure 5. Heatmap displaying the relative gene expressions in low-grade astrocytoma (AGII), anaplastic astrocytoma (AGIII) and GBM cases according toTP53 mutation status. TheTP53 mutated cases are represented by side dashes. The mutatedTP53AGII cases showed more elevated expression levels ofID4,SOX2,SOX4and NANOG. CD133 expressions were more heterogeneous among the cases.SOX2andSOX4showed similar expression levels toID4. Similarly, secondary GBM cases also presented higherID4,SOX2,SOX4expression levels.OCT-4,NANOGandCD133expression levels were heterogeneous among secondary GBM cases, andOCT-4presented higher mRNA levels in primary GBM.
doi:10.1371/journal.pone.0061605.g005
ID4 Hyperexpression is Driven by MutatedTP53in AGII
Here we demonstrate a significant difference inID4expression between AGII cases harboring TP53mutation versus wild-type, mutated cases showing significant increase inID4expression. Other studies in breast cancer models have demonstratedin vitro ID4 up-regulation driven by the mutated p53 protein [13], [14]. TP53
mutations, present in 50% of AGII cases, are considered one of the earliest events in astrocytoma formation [9]. The significant association shown here betweenTP53mutation andID4expression could possibly classify ID4 hyperexpression as an early event in astrocytoma formation. The analysis of AGII patients OS time in
TP53mutated and wild-type cases showed that the mutated cases had a shorter survival by eleven months in comparison to the wild-type group. Considering the low number of cases, further studies are necessary to confirm statistically this result. The great majority of
TP53mutations are missense, localized in specific gene domains (‘‘hot spots’’) that do not inactivate protein function. On the contrary, these alterations stabilize the mutated protein and enhance its oncogenic activity by increasing the transcription of target genes, recruiting other transcription factors and co-factors (recently reviewed in [35]). However, no difference of the analyzed gene expressions were found compared to the different types ofTP53
mutation in the current AGII series, and it remains to be elucidated if the cases harboring inactivating nonsense mutations present alternative activation forID4,SOX2andSOX4.
Associated Expression ofID4 withSOX2andSOX4and with MutatedTP53
SOX2also proved to be significantly augmented and correlated toID4inTP53mutated AGII cases.SOX2overexpression driven by inactivation of p53 in mouse embryonic fibroblasts has been demonstrated [36], although the mechanism remains unknown. One possible explanation is thatID4up-regulation activatesSOX2
through inhibition of a microRNA, mir-9*, which is a direct negative regulator ofSOX2, as shown in glioma cell lines [16]. Our findings of ID4 up-regulation associated toTP53mutated status and to SOX2hyperexpression in human astrocytoma specimens corroborate these previous observations in cell lines. Taken together, these data suggest thatID4 andSOX2act jointly
post-TP53mutation in promoting astrocytoma tumorigenesis. The association between SOX4 and p53 has also been reported [37], [38], with SOX4 stabilizing p53 protein and inhibiting its induction of the apoptotic pathway. In our study,SOX4expression was increased inTP53mutated cases, in a similar pattern toID4. It remains to be elucidated what role the observed association betweenSOX4and mutatedTP53plays in the process of astrocytic tumor formation.
Our results showed a significant increase inNANOGexpression in
TP53mutated AGII cases. It is known that p53 is a direct negative regulator ofNANOG[39] and that the absence of a functional p53 protein augments NANOG expression. NANOG levels did not correlate to any of the other analyzed targets, and its expression pattern in GBM cases was random, enabling us to speculate that
NANOGworks differently to contribute to astrocytoma formation.
CD133levels were not significantly different whenTP53mutated and wild-type AGII cases were compared, and GBM cases also displayed a random pattern, suggesting that CD133 also works differently in the tumorigenic process of astrocytomas.
OCT-4relative expression was not influenced byTP53mutational status and did not correlate with ID4 expression in AGII cases. However, the expression pattern of GBM cases was strikingly different: secondary GBM exhibited very lowOCT-4mRNA levels in comparison to primary GBM. Together with the positive correlation between OCT-4 and ID4 found in both AGIII and
GBM cases, these data indicate a role for this target in the most malignant grades of astrocytoma. These results prompted us to further investigate the combined expression ofID4,SOX4and OCT-4.
Impact ofID4,SOX4andOCT-4 Mutual Hyperexpression on Primary GBM Patients’ Overall Survival
The expression level variability among GBM cases was present for all analyzed genes (Figure 1), with some cases exhibiting very high mRNA levels in contrast to low levels found in others. Again, this phenomenon may be due to the extensive heterogeneity found in GBM at both the cellular and molecular levels [40], contributing to difficulties in eradicating these tumors. Thus, we believed it was necessary to ascertain whether patients bearing tumors with higher mRNA levels of the analyzed genes showed worse overall survival. When we grouped ID4, SOX4 and OCT-4 together, patients hyperexpressing these genes exhibited much lower survival time. In bladder cancers, both ID4 and SOX4 were amplified and overexpressed heterogeneously [41], similar to astrocytomas, and contributed to the variable biological and clinical behavior of the tumors. As previously mentioned, OCT-4 and SOX4 proteins form a transcription complex and induceSOX2expression, increasing the tumorigenicity of glioma cells. Although decreased survival was demonstrated in mice inoculated with GBM cells hyperexpressing
OCT-4, we observed that OCT-4 alone had no impact on our patients’ overall survival (Figure S1D). Because ID4 alone, as well as the SOX4 and OCT-4 complex, activates SOX2, and because chemoresistance is associated with bothSOX2andID4augmented expression, it is possible to speculate that multipleSOX2activation events in GBM may impair patient prognosis. SOX2 and OCT-4, are considered masters of pluripotency in embryonic stem cells [42]. This role is maintained in cancer stem cells (CSC), a subset of tumor cells regarded as possessing traits such as therapeutic resistance, tumor angiogenesis and recurrence [43]. ID4 has also shown to play an important role in CSC biology, its expression being imperative to the formation and maintenance of CSC population [44]. In GBM stem cells [45–48], ID4 has been postulated as an important target in the dedifferentiation process, as shown in thein vitroreports [15], [16]. Moreover, the re-expression of embryonic stem cells genes in tumors, including gliomas, has been associated with a more aggressive phenotype [22], [49], [50]. It is possible that this is the cause for the worse clinical end-point of overall survival among GBM patients found in our study. However, because of the low number of GBM cases (n = 25) in which this finding was demonstrated, the present result should be validated in an independent study sample containing a higher number of GBM patients.
In this scenario,ID4seems to be a promising target for further studies in order to better understand its role in tumorigenesis and its potential use in therapeutics.
Supporting Information
Figure S1 Kapplan-Meier curves of GBM patients according to relative expression levels ofID4,SOX2,SOX4,OCT-4,ID4xSOX2,
ID4xSOX4,ID4xOCT-4,SOX4xOCT-4(TIF). (TIF)
Table S1 Clinical data of patients in the study (Excel). (XLS)
Table S2 Low-grade astrocytoma patients’ survival time analysis (Word).
Acknowledgments
We sincerely thank the doctors and residents of the Discipline of Neurosurgery of the Department of Neurology at Hospital das Clı´nicas of School of Medicine, University of Sa˜o Paulo, for the therapeutic and diagnostic procedures of all patients included in this study, and the doctors and technicians at the Division of Pathological Anatomy of the same institution for the WHO grade classification of tumor samples and tissue
section processing. We also thank the Psychiatry Institute for the logistic help in the surgical therapy.
Author Contributions
Conceived and designed the experiments: TFdAG SMOS SKNM. Performed the experiments: TFdAG MU. Analyzed the data: TFdAG MU SMOS SKNM. Contributed reagents/materials/analysis tools: ANA MJT SR SKNM. Wrote the paper: TFdAG SKNM.
References
1. Benezra R, Davis RL, Lassar A, Tapscott S, Thayer M, et al. (1990) Id: a negative regulator of helix-loop-helix DNA binding proteins. Control of terminal myogenic differentiation. Ann N Y Acad Sci 599: 1–11.
2. Benezra R, Davis RL, Lockshon D, Turner DL, Weintraub H (1990) The protein Id: a negative regulator of helix-loop-helix DNA binding proteins. Cell 61: 49–59.
3. Iavarone A, Lasorella A (2004) Id proteins in neural cancer. Cancer Lett 204: 189–196.
4. Perk J, Iavarone A, Benezra R (2005) Id family of helix-loop-helix proteins in cancer. Nat rev Cancer 5: 603–614.
5. Iavarone A, Lasorella A (2006) ID proteins as targets in cancer and tools in neurobiology. Trends Mol Med 12: 588–594.
6. Norton JD (2000) ID helix-loop-helix proteins in cell growth, differentiation and tumorigenesis. J Cell Sci 113: 3897–3905.
7. Yun K, Mantani A, Garel S, Rubenstein J, Israel MA (2004) Id4 regulates neural progenitor proliferation and differentiation in vivo. Development 131: 5441– 5448.
8. Louis DN, Ohgaki H, Wiestler OD, Cavenee WK, Burger PC, et al. (2007) The 2007 WHO classification of tumours of the central nervous system. Acta Neuropathol 114: 97–109.
9. Ohgaki H, Kleihues P (2011) Genetic profile of astrocytic and oligodendroglial gliomas. Brain Tumor Pathol 28: 177–183.
10. Ohgaki H, Kleihues P (2013) The Definition of Primary and Secondary Glioblastoma. Clin Cancer Res 19: 764–772.
11. Kuzontkoski PM, Mulligan-Kehoe MJ, Harris BT, Israel MA (2010) Inhibitor of DNA binding-4 promotes angiogenesis and growth of glioblastoma multiforme by elevating matrix GLA levels. Oncogene 29: 3793–3802.
12. Zeng W, Rushing EJ, Hartmann DP, Azumi N (2010) Increased inhibitor of differentiation 4 (id4) expression in glioblastoma: a tissue microarray study. J Cancer 1: 1–5.
13. Dell’Orso S, Ganci F, Strano S, Blandino G, Fontemaggi G (2010) ID4: a new player in the cancer arena. Oncotarget 1: 48–58.
14. Fontemaggi G, Dell’Orso S, Trisciuoglio D, Shay T, Melucci E, et al. (2009) The execution of the transcriptional axis mutant p53, E2F1 and ID4 promotes tumor neo-angiogenesis. Nat Struct Mol Biol 16: 1086–1093.
15. Jeon H-M, Jin X, Lee J-S, Oh S-Y, Sohn Y-W, et al. (2008) Inhibitor of differentiation 4 drives brain tumor-initiating cell genesis through cyclin E and notch signaling. Genes Dev 22: 2028–2033.
16. Jeon H-M, Sohn Y-W, Oh S-Y, Oh S-Y, Kim S-H, et al. (2011) ID4 imparts chemoresistance and cancer stemness to glioma cells by derepressing miR-9*-mediated suppression of SOX2. Cancer Res 71: 3410–3421.
17. Ikushima H, Todo T, Ino Y, Takahashi M, Saito N, et al. (2011) Glioma-initiating cells retain their tumorigenicity through integration of the Sox axis and Oct4 protein. J Biol Chem 286: 41434–41441.
18. Lin B, Madan A, Yoon J-G, Fang X, Yan X, et al. (2010) Massively parallel signature sequencing and bioinformatics analysis identifies up-regulation of TGFBI and SOX4 in human glioblastoma. PLoS ONE 5: e10210. 19. Boiani M, Scho¨ler HR (2005) Regulatory networks in embryo-derived
pluripotent stem cells. Nat Rev Mol Cell Biol 6: 872–884.
20. Chambers I, Tomlinson SR (2009) The transcriptional foundation of pluripotency. Development 136: 2311–2322.
21. Qu Q, Shi Y (2009) Neural stem cells in the developing and adult brains. J Cell Physiol 221: 5–9.
22. Holmberg J, He X, Peredo I, Orrego A, Hesselager G, et al. (2011) Activation of neural and pluripotent stem cell signatures correlates with increased malignancy in human glioma. PLoS One 6: e18454.
23. Ma Y-H, Mentlein R, Knerlich F, Kruse M-L, Mehdorn HM, et al. (2008) Expression of stem cell markers in human astrocytomas of different WHO grades. J Neurooncol 86: 31–45.
24. Marie SKN, Okamoto OK, Uno M, Hasegawa APG, Oba-Shinjo SM, et al. (2008) Maternal embryonic leucine zipper kinase transcript abundance correlates with malignancy grade in human astrocytomas. Int J Cancer 122: 807–815.
25. Oba-Shinjo SM, Bengtson MH, Winnischofer SMB, Colin C, Vedoy CG, et al. (2005) Identification of novel differentially expressed genes in human astrocytomas by cDNA representational difference analysis. Mol Brain Res 140: 25–33.
26. Valente V, Teixeira SA, Neder L, Okamoto OK, Oba-Shinjo SM, et al. (2009) Selection of suitable housekeeping genes for expression analysis in glioblastoma using quantitative RT-PCR. BMC Mol Biol 10: 17.
27. Livak KJ, Schmittgen TD (2001) Analysis of relative gene expression data using real-time quantitative PCR and the 2(-Delta Delta C(T)) Method 25: 402–408. 28. Pfaffl MW (2001) A new mathematical model for relative quantification in
real-time RT-PCR. Nucleic Acids Res 29: e45.
29. Miller SA, Dykes DD, Polesky HF (1988) A simple salting out procedure for extracting DNA from human nucleated cells. Nucleic Acids Res 16: 1215. 30. Uno M, Oba-Shinjo SM, De Aguiar PH, Leite CC, Rosemberg S, et al. (2005)
Detection of somatic TP53 splice site mutations in diffuse astrocytomas. Cancer Lett 224: 321–327.
31. Uno M, Oba-Shinjo SM, Wakamatsu A, Huang N, Ferreira Alves VA, et al. (2006) Association of TP53 mutation, p53 overexpression, and p53 codon 72 polymorphism with susceptibility to apoptosis in adult patients with diffuse astrocytomas. Int J Biol Markers 21: 50–57.
32. Vandeputte DAA, Troost D, Leenstra S, Ijlst-Keizers H, Ramkema M, et al. (2002) Expression and distribution of id helix-loop-helix proteins in human astrocytic tumors. Glia 38: 329–338.
33. Uno M, Oba-Shinjo SM, Camargo AA, Moura RP, Aguiar PH de, et al. (2011) Correlation of MGMT promoter methylation status with gene and protein expression levels in glioblastoma. Clinics 66: 1747–1755.
34. Martini M, Cenci T, D’Alessandris GQ, Cesarini V, Cocomazzi A, et al. (2012) Epigenetic silencing of Id4 identifies a glioblastoma subgroup with a better prognosis as a consequence of an inhibition of angiogenesis. Cancer. doi:10.1002/cncr.27821.
35. Freed-Pastor WA, Prives C (2012) Mutant p53: one name, many proteins. Genes Dev 26: 1268–1286.
36. Kawamura T, Suzuki J, Wang YV, Menendez S, Morera LB, et al. (2009) Linking the p53 tumour suppressor pathway to somatic cell reprogramming. Nature 460: 1140–1144.
37. Hur W, Rhim H, Jung CK, Kim JD, Bae SH, et al. (2010) SOX4 overexpression regulates the p53-mediated apoptosis in hepatocellular carcinoma: clinical implication and functional analysis in vitro. Carcinogenesis 31: 1298–1307. 38. Pan X, Zhao J, Zhang W-N, Li H-Y, Mu R, et al. (2009) Induction of SOX4 by
DNA damage is critical for p53 stabilization and function. Proc Natl Acad Sci USA 106: 3788–3793.
39. Lin T, Chao C, Saito S, Mazur SJ, Murphy ME, et al. (2005) p53 induces differentiation of mouse embryonic stem cells by suppressing Nanog expression. Nat Cell Biol 7: 165–171.
40. Bonavia R, Inda M-M, Cavenee WK, Furnari FB (2011) Heterogeneity maintenance in glioblastoma: a social network. Canxer Res 71: 4055–4060. 41. Wu Q, Hoffmann MJ, Hartmann FH, Schulz WA (2005) Amplification and
overexpression of the ID4 gene at 6p22.3 in bladder cancer. Mol Cancer 4: 16. 42. Mallanna SK, Rizzino A (2012) Systems biology provides new insights into the molecular mechanisms that control the fate of embryonic stem cells. J Cell Physiol 227: 27–34.
43. Sampieri K, Fodde R (2012) Cancer stem cells and metastasis. Semin Cancer Biol 22: 187–193.
44. Park S-J, Kim R-J, Nam J-S (2011) Inhibitor of DNA-binding 4 contributes to the maintenance and expansion of cancer stem cells in 4T1 mouse mammary cancer cell line. Lab Anim Res 27: 333–338.
45. Singh SK, Clarke ID, Terasaki M, Bonn VE, Hawkins C, et al. (2003) Identification of a cancer stem cell in human brain tumors. Cancer Res 63: 5821–5828.
46. Singh SK, Hawkins C, Clarke ID, Squire JA, Bayani J, et al. (2004) Identification of human brain tumour initiating cells. Nature 432: 396–401. 47. Yuan X, Curtin J, Xiong Y, Liu G, Waschsmann-Hogiu S, et al. (2004) Isolation
of cancer stem cells from adult glioblastoma multiforme. Oncogene 23: 9392– 9400.
48. Galli R, Binda E, Orfanelli U, Cipelletti B, Gritti A, et al. (2004) Isolation and characterization of tumorigenic, stem-like neural precursors from human glioblastoma. Cancer Res 64: 7011–7021.
49. Ben-Porath I, Thomson MW, Carey VJ, Ge R, Bell GW, et al. (2008) An embryonic stem cell-like gene expression signature in poorly differentiated aggressive human tumors. Nat Genet 40: 499–507.