KEYWORDS
Saccharum spp.
Genetic divergence
Mahalanobis’s D2 statistics
Cluster distance
Hybridization
ABSTRACT
Genetic divergence among the twenty four sugarcane genotypes collected from various sugarcane research institutions of northern India were tested in a randomized complete block design with three replicates during the cropping seasons 2013 - 14. The assessment of the genetic diversity was based on the eighteen cane yield and quality characters. The results of the study indicated that, the genotypes were grouped into five clusters based on the genetic distance using Mahalanobis's statistics. Higher inter-cluster distance was recorded between cluster II and V (89.668) indicating high genetic diversity among these two clusters. Thus, exploitation of genotypes within these two clusters as parents for crossing could produce good sugarcane segregants. The lowest intra cluster distance was reported in the cluster III (14.897) revealed that clones are identical and can not to be used as parents in crossing that results hybrid not desirable for the characters studied. A critical analysis of cluster means for different traits indicated that cluster I was desirable for cane yield, CCS (t/ha), single cane weight, stalk diameter, germination (%), cluster II was better for juice extraction percentage, cluster III for better juice purity percent, brix (%), sucrose (%) and CCS (%) for 12 months and cluster V was the best source for NMC (000/ha), stalk length with other good cane and sugar yield traits. The average D2 values among clones ranged from 29.998 (CoH 08262) to 69.791 (CoPb 09214). The maximum genetic distance was noted between clone CoPb 09214 and Co 10039 (97.842) which was followed by clone CoPb 09214 & Co 10036 (96.609), CoPb 09214 & CoS 8436 (92.964) and clone CoH 09264 & Co 10036 (90.091). It is suggested that genotypes with high index for specific characters that fall into different clusters could be intercrossed to generate good number of sugarcane progenies having greater potentiality for breeding purpose by virtue of their desirable characters.
All the article published by Journal of Experimental Biology and Agricultural Sciences is licensed under a Creative Commons Attribution-NonCommercial 4.0 International License Based on a work at www.jebas.org.
Gulzar S Sanghera*, Kumar R, Tyagi V, Thind K S and Sharma B
Punjab Agricultural University, Regional Research Station, Kapurthala -144 601, Punjab, India
Received – February 13, 2015; Revision – March 07, 2015; Accepted – March 08, 2015 Available Online – April 25, 2015
DOI: http://dx.doi.org/10.18006/2015.3(2).184.190
GENETIC DIVERGENCE AMONG ELITE SUGARCANE CLONES (
Saccharum
officinarum
L.) BASED ON CANE YIELD AND QUALITY TRAITS FROM
NORTHERN INDIA
E-mail: [email protected] (Gulzar S Sanghera)
Peer review under responsibility of Journal of Experimental Biology and Agricultural Sciences.
* Corresponding author
Journal of Experimental Biology and Agricultural Sciences, April - 2015; Volume – 3(2)
Journal of Experimental Biology and Agricultural Sciences
http://www.jebas.org
ISSN No. 2320 – 8694
1 Introduction
Sugarcane (Saccharum spp. complex) is an important industrial crop of tropical and subtropical regions of the world and is cultivated in about 90 countries around the globe for its high concentrations of sugar and recently for the production of ethanol as a source of bio-fuel (Andreoli & De Souza 2007). Present day sugarcane varieties are complex hybrids derived from the inter-specific crosses involving Saccharum officinarum L. (2n = 80) and S. spontaneum L. (2n = 40 - 128) species (Srivastava & Gupta 2008). Sugarcane is the raw material for the sugar industry. Cane juice is used for the manufacturing of gur, shaker, sugar and cane tops are used as fodder. The by- products of the sugar industry are beggas, molasses, filter-cake,wax etc. (Kang et al., 2013). The percentage of sucrose varies from 12-18% depending of the variety of cane, its maturity, condition of soil, climate and agricultural practices followed by the growers (Singh 1981; Singh & Bains 1986; Singh & Singh 2002). Considerable difficulties have been encountered in the improvement of sugarcane through hybridization due to narrow base of variation available. Thus progress in breeding of sugarcane, a highly polyploidy with chromosome number in somatic cells (2n) ranging from 80-124 in cultivated and 48-150 in wild types (Prasanna et al., 2005; Garcia et al., 2006). In sugarcane frequently aneuploid is impeded by its narrow gene pool, complex genome, poor fertility, caused by genetic recombination as well as long breeding selection cycle (Singh, 1981). The choice of the variety is one of the most important factors in sugarcane breeding and production. Different varieties have different yield potentials, pest and disease resistance and are bred for different ecological and economic conditions (Atkin et al., 2009; Sanghera et al., 2014). Therefore, the establishment of the adequate variety to be grown in a given region is of paramount importance. Normally, the choice of parental lines in sugarcane breeding programs has been defined on the basis of agronomic characters and pedigree records, using biparental crosses or polycrosses between elite genotypes. The lack of genealogy data and the inadequate identification of some genotypes may impair an accurate estimation of the genetic diversity among sugarcane accessions. In addition, the continuous selection for the same traits such as sucrose content in breeding programs has caused a reduction in genetic diversity, limiting further advances in sugarcane breeding (Creste et al., 2010). Through the estimates of genotypic and phenotypic correlations among yield components has paved the basis for selection of superior genotypes from the diverse breeding populations, thereby establishing appropriate plant attributes for selection to improve the yield and quality status of sugarcane varieties. Genetic diversity that arise due to geographical separation or due to genetic barriers to cross ability or due to different patterns of evolution be measured following D2 statistics that measure group distance based on multiple characters (Mahalanobis 1928) and it has become one of the important technique to assess genetic divergence on the basis of multiple traits. With the help of this technique, one can easily predict
genotypes which have high index scores and fell into different clusters can be crossed to have maximum variability of good combinations of characters. Rao (1952) suggested the application of these techniques for the assessment of genetic diversity in plant breeding. Divergence analysis is being a powerful tool in quantifying the degree of divergence at genotypic level based on phenotypic observations in different crops. The objective of this study was to establish genetic diversity within a collection of selected sugarcane clones with important contrasting features under subtropical conditions, identified in breeding programs in north- western India, a region that includes extensive cold areas with few agronomic activities to identify contrasting parental candidates for future breeding programme.
2 Materials and Methods
Twenty four sugarcane elite genotypes received from different research institutions of northern India viz. Co 09022, Co 10036, Co 10037, Co 10039 (SBI, RS Karnal), CoH 08262, CoH 08263, CoH 08264, CoH 09264, CoH 10262, CoH 10263 (HAU, RS, Uchani), CoPb 09214, CoPb 08217, CoPb 10181, CoPb 10182, CoPb 10183, CoPb 10211 (PAU, RS, Kpurthala & Faridkot) CoLk 09204 (IISR, Lucknow), CoS 08234, CoS 08235, CoS 09232, CoS 767, CoS 8436 (UPCSR, Shahajahanpur) and CoPant 97222, CoPant 10221( GB PUAT, Pantnagar) were tested during the plant cane season of 2013 - 2014 in a randomized complete block design with three replicates at PAU, Regional Research Station, Kapurthala for 18 different growth, cane yield component and quality traits. The experimental plot contained six rows each of 6 meters long with 90 cm as inter-row spacing. Twelve healthy buds were planted per running meter length. The standard cultural practices such as irrigation, fertilization and pesticide application were carried out as per recommendations to get ideal crop stand. Data were recorded on growth parameters viz. germination percentage after 45 days, number of millable canes (NMC) at 10 months (000/ha), no. of shoots (000/ha) after 120 days and no. of tillers at (000/ha) 240 days on plot basis from each replication and each treatment. Five guarded canes from each replication (15 guarded canes from each in total varieties) were randomly selected for recording data at 10 months age of crop on brix (%) juice at 10 months, sucrose (%) juice at 10 months, purity (%) juice at 10 months, commercial cane sugar (CCS %) at 10 months. Finally, the crop was harvested manually at 12 months of age and again, five guarded canes from each replication (15 guarded canes from each in total varieties) were randomly selected for recording data on stalk length (cm), stalk diameter (cm), single cane weight (kg), Brix (%) juice 10 months, sucrose or Pol (%) juice at 10 months, purity (%) juice at 10 months, commercial cane sugar (CCS %) at 10 months, Brix (%) at 12 months, sucrose (%) at 12 months, purity (%) at 12 months, CCS (%) at 12 months, extraction ( %) at 12 month., Cane yield per plot at harvest was weighed using digital weighing balance and converted to cane yield (t/ha).
185 Gulzar et al
The CCS % and CCS (t/ha) were calculated as:
CCS (%) = 0.292 x Pol % juice ((0.035 x Purity %)-1) / Purity % X 100
CCS (t/ha) = CCS (%) x Cane yield (t/ha)
Statistical Analysis
The data collected for various characters were analyzed for analysis of variance, estimation of standard error and critical difference by standard analysis of variance technique as given by Steel & Torrie, (1980). Test of significance for difference between characters means was carried out by referring to the F- table given by Snedecor & Cochran (1967). To measure the extent of diversity, the idea of D2 statistics was used to measure group distance based on multiple characters, as developed by Mahalanobis (1928) using SPSS software (Statistical Package for Social Studies). Genetic divergence among the studied
genotypes based on statistical differences were used for genotypes classification in different clusters, results of inter and intra clusters D2 values between clusters, as well as mean of intra-clusters D2 values of different clusters were described.
3 Results and Discussion
Analysis of variance revealed the significant differences among the clones studied indicating the sufficient genetic variation among the clones for all the traits studied except germination percentage (Table 1). Coefficient of variability ranged from 3.69 to 16.20, which indicated the consistency of the experimental conditions. Based on magnitude of D2 values worked out for all possible pairs of genotype studied, 24 genotypes were grouped into five clusters based on statistical differences. This was based on the fact that genotypes within a
specific cluster usually have the smaller D2
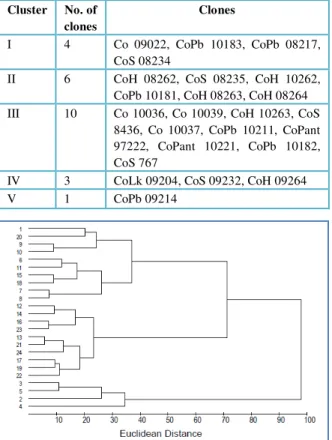
values (Table 2) among themselves when compared to those belonging to different clusters on distance ranges (tree shown in Figure 1).
Table 2 Grouping of genotypes into six clusters based on D2 values
Cluster No. of clones
Clones
I 4 Co 09022, CoPb 10183, CoPb 08217,
CoS 08234
II 6 CoH 08262, CoS 08235, CoH 10262,
CoPb 10181, CoH 08263, CoH 08264
III 10 Co 10036, Co 10039, CoH 10263, CoS
8436, Co 10037, CoPb 10211, CoPant 97222, CoPant 10221, CoPb 10182, CoS 767
IV 3 CoLk 09204, CoS 09232, CoH 09264
V 1 CoPb 09214
Figure 1 Dendrogram of 24 different sugarcane based upon mean of 18 cane yield and quality and morphological variables
Punia et al. (1983) found that number of tillers at 240 days and NMC contributed maximoum towards the high genetic
divergence, followed by cane weight, cane yield, brix, sucrose content and percentage purity of commercial cane. The results indicated that cluster V, IV and I were found to contain one (CoPb 09214), three (CoLk 09204, CoS 09232, CoH 09264) and four clones (Co 09022, CoPb 10183, CoPb 08217, CoS 08234) respectively (Table 2). On the contrary, clusters II and III were the largest groups, containing six and ten genotypes each, respectively. Kashif & Khan (2007) reported that Metroglyph scatter diagram shows four groups from 14 genotypes of sugarcane. The clustering pattern showed that varieties developed from same institution were noticed to have fallen into two different clusters. Further, it can also be seen from the cluster that the varieties in cluster III belong to different breeding stations and possible reason could be the narrow genetic base of clones used in the hybridization and limited traits explored for selection for north western zone of country.
Table 3 Number of clones in clusters and average intra and inter-cluster distances
Cluster No. of clones
I II III IV V
I 4 19.658 25.969 54.436 34.214 55.118
II 6 16.110 35.401 42.382 65.954
III 10 14.897 68.002 89.668
IV 3 20.918 30.772
V 1 0.000
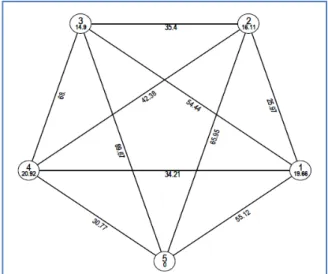
from which they were derived or due to the selection pressure applied on some characters to evolve these varieties. Singh & Bains (1986) reported that characters constellation that might be associated with a particular region in nature could lose their individuality under selection and human interference. The average of inter-cluster D2 values (Table 3) ranged from 25.969 (between cluster I and II) to 89.668 (between cluster II and V) and the maximum statistical value was found between cluster II and V (Fig 2).
The lower inter-cluster value was noticed between cluster I and II (25.969). Higher estimate of inter-cluster between cluster II and V indicated wide genetic diversity between these two groups. Thus, genotypes with high index for specific character that fall into different clusters could be intercrossed to have maximum hybrid vigor and good number of useful segregants.
Fig 2 Cluster analysis for 24 different clones
Atkin et al. (2009) have also documented the impact of depth of pedigree and inclusion of historical data on the estimation of additive variance and breeding values in a sugarcane breeding program. Lower inter-cluster distance was noticed between cluster I and II that might indicate the close relationship and likelihood between genotypes groups within these clusters. Further, the results indicated that the intra-cluster value was zero in cluster V (CoPb 09214), since it contained only one genotype. The highest intra-cluster value was recorded by cluster IV at 20.918, followed by cluster I and II with 19.658 and 16.110 D2 value, respectively. Cluster III consists of Co 10036, Co 10039, CoH 10263, CoS 8436, Co 10037, CoPb 10211, CoPant 97222, CoPant 10221, CoPb 10182, CoS 767. The intra cluster distance was 14.897 revealed that these cultivars were uniform enough not to be used as parents hybrid breeding to yield desirable results for the characters studied. The most divergent cluster was IV that included CoLk 09204, CoS 09232, CoH 09264. It is suggested that one parent may selected from each of these two clusters to produce a hybrid having desirable results for the eighteen characters studied. The most divergent cluster was V (89.668) fallowed by cluster no IV (68.002).
The crosses of cultivars in cluster III with cultivars in clusters IV and V may result into promising combinations. The critical analysis of clusters means among different traits indicated that cluster I was desirable for cane yield, CCS (t/ha) single cane weight, stalk diameter, germination (%), cluster II was better for juice extraction percentage, cluster III for better juice purity percent, brix (%), sucrose (%) and CCS (%) for 12 months and cluster V was the best source for NMC (000/ha), stalk length with other good cane and sugar yield traits (Table 4). Silva et al. (2005) reported that brix value and juice contents contributed the highest in genetic divergence among 129 genotypes and concluded that brix value and juice contents were more favorable for genetic diversity study in sugarcane. Nair et al. (1998) found that cane weight was significantly added to genetic diversity among sugarcane genotypes. Sajjad & Khan (2009) reported that cane weight contributed 0.38 to divergence and appeared three times in first ranking. Nair et al. (1998) found that cane height contributed the highest to genetic divergence and cane weight was significantly added to genetic diversity among sugarcane genotypes. It is therefore suggested that genotypes in clusters I and III will show greater potentiality as breeding stocks by virtue of the corresponding desirable characters and the inter-cluster distance and be used in future breeding for identification of desirable transgressive clones.
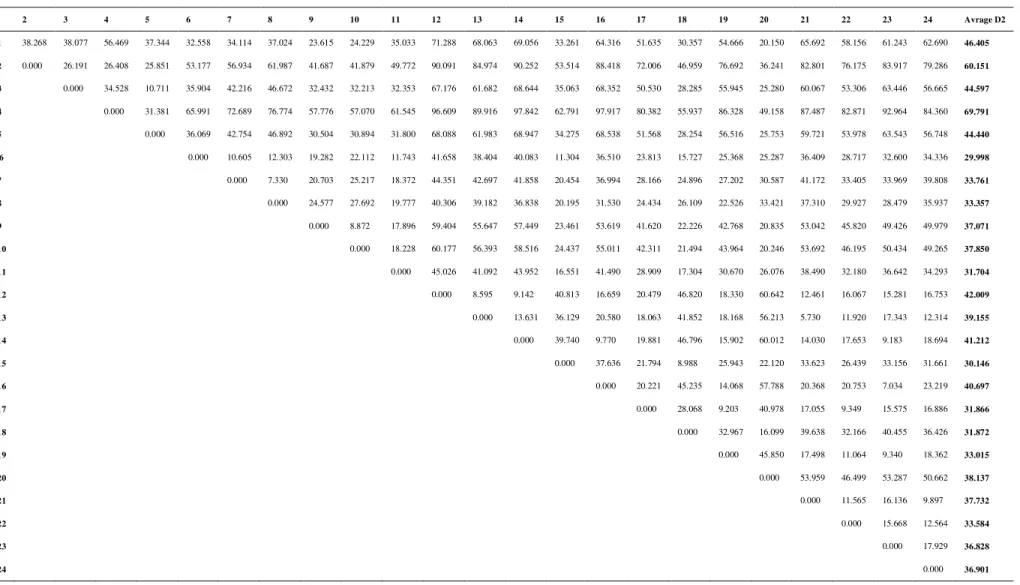
These results are in agreement with earlier reports (Singh & Singh 2002; Prasanna et al., 2005). Data from different clones were subjected to measure clear distinguish ability by a difference of at least one character in different possible pairs of 24 clones. The mean values for 18 cane yield and quality characters were subjected to dissimilarity analysis. The dissimilarity matrix Table 5 and on the basis of matrix dendrogram constructed (Figure 1). Using this diversity, all 24 clones were found to differ from each other. The genetic distance between clone CoH 10263 and clone CoS 8436 was the least (7.03). The maximum genetic distance was noted between clone CoPb 09214 and Co 10039 (97.842) followed by clone CoPb 09214 and Co 10036 (96.609), CoPb 09214 and CoS 8436 (92.964) and clone CoH 09264 and Co 10036 (90.091) (Table 5). Dendrogram resulting from cluster analysis of 24 clones could be primarily divided into five major groups. The average D2 values among clones ranged from 29.998 (CoH 08262) to 69.791 (CoPb 09214). The diversity patterns of the clones revealed a large amount of diversity that did not allow a clear-cut distinction between groups. Yadav & Singh (2010) also observed similar diversity pattern in maize inbred lines. From present study, it is concluded that hybridization of genotypes from two distant clusters is likely to yield desirable recombinants. Hybridization between genetically distant genotypes for exploiting hybrid vigour was frequently suggested in other crops species by Vivekananda & Subramanian (1993). Therefore, two important considerations for future breeding are the selection of parents from genetically distant parents and selection of particular sugarcane genotypes based on higher variability among the progenies. Present investigation has brought out the following important considerations in the north western zone sugarcane varietal
187 Gulzar et al
development programme. Maximum inter-cluster between cluster II and V indicated higher genetic diversity between these two groups. Thus, hybridization of these two groups could result in transgressive recombinants for agronomically important traits. Intra-cluster D2 value was found low at 14.897 in cluster III and 16.110 in cluster II. This might indicate the close relationship between genotypes within these two clusters should not be selected for further breeding program among themselves. However, it is suggested that genotypes with high index for specific character that fall into different clusters could be intercrossed to generate good number of sugarcane progenies having greater potentiality for breeding purpose by virtue of their desirable characters.
Conflict of interest
The authors declare no conflict of interest.
References
Chandel AK, da Silva SS, Carvalhoa W, Singh OV (2011) Sugarcane bagasse and leaves: foreseeable biomass of biofuel and bio-products. Journal of Chemical Technology and Biotechnology. DOI 10.1002/jctb.2742
Atkin FC, Dieters MJ, Stringer JK (2009) Impact of depth of pedigree and inclusion of
historical data on the estimation of additive variance and breeding values in a sugarcane breeding program. Theoretical and Applied Genetics 119: 555-565.
Creste S, Pinto LR, Xavie, MA, Landell MGA (2010) Sugarcane Breeding Method and Genetic Mapping, In: Sugar Cane Bioethanol: R&D for productivity and sustainability, L.A.B. Cortez (Ed.) pp: 353-357.
Garcia AAF, Kido EA, Meza AN, Souza HMB, Pinto LR, Pastina MM, Leite CS, Silva JAG Da, Ulian EC, Figueira AVO, Souza AP (2006) Development of an Integrated Genetic Map of a Sugarcane (Saccharum spp.) Commercial Cross, based on a Maximum-Likelihood Approach for Estimation of Linkage and Linkage Phases. Theoretical and Applied Genetics 112: 298-314.
Kang SA, Noor M, Khan FA, Saeed F (2013) Divergence analysis and association of some economical characters of sugarcane (Saccharum officinarum L.). Journal of Plant Breeding and Genetics. 1: 01-06.
Kashif M, Khan FA (2007) Divergence in sugarcane (Saccharum officinarum L.) based on yield and quality traits. Pakistan Journal of Botany 39: 1559-1563.
Mahalanobis PC (1928) A statistical study at Chinese head measurement. Journal of the Asiatic Society of Bengal 25: 301-377.
Nair NV, Balakrishnan R, Sreenivasan TV (1998) Variability for quantitative traits in exotic hybrid germplasm of sugarcane. Genetic Resources and Crop Evolution 45: 459-463.
Prasanna K, Ashok M, Parasannajeit M (2005) Genetic divergence in sugarcane. Indian Sugar Journal 53: 33-38.
Punia MS, Chaudhary BS, Hooda RS (1983) Genetic divergence in sugarcane. Journal of Agricultural Sciences 53: 434-436.
Rao CR (1952) Advanced biometrical methods in biometric research. John Wiley and Sons Inc. New York. pp 357-363. Sajjad M, Khan FA (2009)Genetic diversity among sugarcane cultivars in Pakistan. American-Eurasian Journal of Agricultural & Environmental Sciences 6: 730-736.
Sanghera GS, Tyagi V, Kumar R, Thind KS, Sharma B (2014) Quality parameters and their association with cane yield in sugarcane under subtropical conditions. In: Proceedings of National Symposium on Crop Improvement for Inclusive Sustainable Development held at Punjab Agricultural University, Ludhiana during November 7-9, 2014. pp. 796-798.
Silva CM, Vidigal MCG Filho, PSV, Scapim CA, Daros E, Silverio L (2005) Genetic diversity among sugarcane clones (Saccharum spp.). Acta Scientiarum Agronomy 27: 315-319.
Singh RB (1981) The relative importance affecting genetic divergence. Indian Journal of Genetics and Plant Breeding 41: 237-245.
Singh P, Singh VP (2002) Genetic divergence in sugarcane germplasm. Indian Journal of Agricultural Sciences 72: 252-253.
Singh RB, Bains SS (1986) Genetic divergence for ginning out tern and its component in upland cotton (Gossypium hirsutum
L) varieties obtained from different geographical locations. Indian Journal of Genetics and Plant Breeding 26: 262-268.
Snedecor GW, Cochran (1967) Statistical Methods. Oxford and IBH publication Co., New Delhi.
Srivastava S, Gupta OS (2008) Inter simple sequence repeat profile as a genetic marker system in Sugarcane. Sugar Tech 10: 48-52.
Steel RGD, Torrie JH (1980) Principles and Procedures of Statistics. McGraw Hill Book
Vivekananda P, Subramanian S (1993) Genetic divergence in rainfed rice. Oryza 30: 60-62.
Yadav VK, Singh IS, 2010. Comparative evaluation of maize inbred lines (Zea mays L.) according to DUS testing using morphological, physiological and molecular markers. Agricultural Sciences 1: 131-142
Table 1 Mean squares of 18 cane yield and quality traits based on analysis of variances in sugarcane.
1 2 3 4 5 6 7 8 9 10 11 12 13 14 15 16 17 18
Grand Mean 43.33 89.59 110.55 104.54 224.0 2.37 1.05 16.10 14.06 86.86 9.65 17.56 15.54 88.11 10.73 53.43 10.43 98.00
Treat MSS 24.02 400.09* 2328.62* 1563.69* 35.09* 0.09* 0.06* 2.15* 3.86* 21.65* 2.52* 2.22* 3.36* 18.43* 2.12* 31.8*3 17.49* 2221.71*
ErrMSS 15.69 24.140 18.46 14.79 10.08 0.02 0.01 0.74 0.81 4.03 0.45 0.76 1.01 3.54 0.61 11.44 1.078 47.85
F Ratio 1.53 16.57 126.13 105.68 3.48 4.54 8.16 2.88 4.73 5.36 5.50 2.89 3.31 5.199 3.48 2.78 16.22 46.42
Germination (%) 45 days, 2 NMC (000/ha), 3 No. of shoots (000/ha) 120 days, 4 No of tillers (000/ha) 240 days, 5 Stalk length (cm), 6 Stalk diameter (cm), 7. Single cane we ight (kg), 8 Brix (%) 10 months, 9 Sucrose (%) 10 months, 10 Purity (%) 10 months, 11 CCS (%) 10 months, 12 Brix (%) 12 months, 13 Sucrose (%) 12 months, 14 Purity (%) 12 months, 15 CCS (%) 12 months, 16 Extraction
(% 12) months, 17 CCS (t/ha) and 18. Cane yield (t/ha).
Table 4 Mean intra-clusters values for 18 cane yield and quality traits in sugarcane.
Cluster 1 2 3 4 5 6 7 8 9 10 11 12 13 14 15 16 17 18
I 46.85 96.90 116.97 110.63 2.28 2.51 1.18 15.75 13.71 86.27 9.37 17.78 15.59 86.53 10.67 54.80 12.82 120.45
II 43.79 88.16 108.70 104.50 2.16 2.49 1.09 15.89 13.86 86.87 9.51 17.21 15.30 88.78 10.61 55.93 11.12 105.21
III 42.06 83.34 95.84 91.67 2.18 2.31 0.96 16.59 14.69 88.17 10.15 18.05 16.14 89.17 11.21 51.67 8.84 79.13
IV 42.02 96.67 139.24 127.11 2.44 2.29 1.16 15.15 12.60 82.97 8.45 16.59 14.13 84.95 9.59 53.99 10.80 112.36
V 43.23 110.39 157.10 141.39 2.54 2.08 1.01 16.87 14.81 87.83 10.22 16.87 15.07 89.27 10.47 49.13 11.54 110.65
Germination (%) 45 days, 2 NMC (000/ha), 3 No. of shoots (000/ha) 120 days, 4 No of tillers (000/ha) 240 days, 5 Stalk length (cm), 6 Stalk diameter (cm), 7. Single cane weight (kg), 8 Brix (%) 10 months, 9 Sucrose (%) 10 months, 10 Purity (%) 10 months, 11 CCS (%) 10 months, 12 Brix (%) 12 months, 13 Sucrose (%) 12 mont hs, 14 Purity (%) 12 months, 15 CCS (%) 12 months, 16 Extraction (% 12) months, 17 CCS (t/ha) and 18. Cane yield (t/ha).
Table 5 Pair-wise dissimilarity matrix of 24 clones based upon morphological variable in sugarcane.
2 3 4 5 6 7 8 9 10 11 12 13 14 15 16 17 18 19 20 21 22 23 24 Avrage D2
1 38.268 38.077 56.469 37.344 32.558 34.114 37.024 23.615 24.229 35.033 71.288 68.063 69.056 33.261 64.316 51.635 30.357 54.666 20.150 65.692 58.156 61.243 62.690 46.405
2 0.000 26.191 26.408 25.851 53.177 56.934 61.987 41.687 41.879 49.772 90.091 84.974 90.252 53.514 88.418 72.006 46.959 76.692 36.241 82.801 76.175 83.917 79.286 60.151
3 0.000 34.528 10.711 35.904 42.216 46.672 32.432 32.213 32.353 67.176 61.682 68.644 35.063 68.352 50.530 28.285 55.945 25.280 60.067 53.306 63.446 56.665 44.597
4 0.000 31.381 65.991 72.689 76.774 57.776 57.070 61.545 96.609 89.916 97.842 62.791 97.917 80.382 55.937 86.328 49.158 87.487 82.871 92.964 84.360 69.791
5 0.000 36.069 42.754 46.892 30.504 30.894 31.800 68.088 61.983 68.947 34.275 68.538 51.568 28.254 56.516 25.753 59.721 53.978 63.543 56.748 44.440
6 0.000 10.605 12.303 19.282 22.112 11.743 41.658 38.404 40.083 11.304 36.510 23.813 15.727 25.368 25.287 36.409 28.717 32.600 34.336 29.998
7 0.000 7.330 20.703 25.217 18.372 44.351 42.697 41.858 20.454 36.994 28.166 24.896 27.202 30.587 41.172 33.405 33.969 39.808 33.761
8 0.000 24.577 27.692 19.777 40.306 39.182 36.838 20.195 31.530 24.434 26.109 22.526 33.421 37.310 29.927 28.479 35.937 33.357
9 0.000 8.872 17.896 59.404 55.647 57.449 23.461 53.619 41.620 22.226 42.768 20.835 53.042 45.820 49.426 49.979 37.071
10 0.000 18.228 60.177 56.393 58.516 24.437 55.011 42.311 21.494 43.964 20.246 53.692 46.195 50.434 49.265 37.850
11 0.000 45.026 41.092 43.952 16.551 41.490 28.909 17.304 30.670 26.076 38.490 32.180 36.642 34.293 31.704
12 0.000 8.595 9.142 40.813 16.659 20.479 46.820 18.330 60.642 12.461 16.067 15.281 16.753 42.009
13 0.000 13.631 36.129 20.580 18.063 41.852 18.168 56.213 5.730 11.920 17.343 12.314 39.155
14 0.000 39.740 9.770 19.881 46.796 15.902 60.012 14.030 17.653 9.183 18.694 41.212
15 0.000 37.636 21.794 8.988 25.943 22.120 33.623 26.439 33.156 31.661 30.146
16 0.000 20.221 45.235 14.068 57.788 20.368 20.753 7.034 23.219 40.697
17 0.000 28.068 9.203 40.978 17.055 9.349 15.575 16.886 31.866
18 0.000 32.967 16.099 39.638 32.166 40.455 36.426 31.872
19 0.000 45.850 17.498 11.064 9.340 18.362 33.015
20 0.000 53.959 46.499 53.287 50.662 38.137
21 0.000 11.565 16.136 9.897 37.732
22 0.000 15.668 12.564 33.584
23 0.000 17.929 36.828
24 0.000 36.901