GENETIC DIVERGENCE ANALYSIS FOR CERTAIN YIELD AND QUALITY TRAITS
IN RICE (ORYZA SATIVA L.) GROWN IN IRRIGATED SALINE LOW LAND OF
ANNAMALAINAGAR, SOUTH INDIA
SABESAN Thayumanavan*, SARAVANAN Kannapiran and ANANDAN Annamalai
Genetics and Plant Breeding, Department of Agricultural Botany, Faculty of Agriculture, Annamalai University, Annamalainagar – 608 002, Tamilnadu, India. Tel. +91 -4144 -238451 (ext. 296)
Fax: 91 - 4144 – 238080 E-mail. [email protected]
Manuscript received: July 17, 2008; Reviewed: October 19, 2009; Accepted for publication: October 27, 2009
ABSTRACT
Genetic diversity among twenty six genotypes of rice genotypes from four states of South Eastern Region of India was evaluated using Mahalanobis D2 statistic. The experimental materials were evaluated during Samba season
(August-December) 2005 and 2006 at the Plant Breeding Farm (11o 24’ N latitude and 79o 44’ E longitude, + 5.79 m MSL),
Annamalai University, Annamalainagar, Tamilnadu, South India. Based on 12 morphological and quality characters namely, days to first flower, productive tillers per plant, panicle length (cm), number of grains per panicle, 1000 grain weight (g), grain length (mm), grain breadth (mm), grain L/B ratio, kernel length (mm), kernel breadth (mm), kernel L/B ratio and grain yield per plant (g) these genotypes were grouped into 13 clusters. Cluster I with seven genotypes was the largest cluster followed by Cluster V with four genotypes. Clusters IV, VII, VIII, X, XI, XII and XIII were mono genotypic clusters. Genotypes from more than one place of origin were grouped in one cluster, and genotypes from one state were grouped in more than one cluster. Geographical origin was not found to be a good parameter of genetic divergence. Clusters VI, III, and XII exhibited high values for most of the characters. The intra cluster distance was maximum (D = 100.90) in cluster I. The maximum inter cluster distance (D2 = 8235.56) was recorded
406
Journal of Central European Agriculture Vol 10 (2009) No 4SABESAN Thayumanavan, SARAVANAN Kannapiran and ANANDAN Annamalai
INTRODUCTION
Success of hybridization and subsequent selection of desirable segregants depends largely on the selection of parents with high genetic variability for different characters. The more diverse the parents, within overall limits of fitness, greater are the chances of obtaining higher amount of heterotic expression in F1s and broad
spectrum of variability in segregating generations [18]. The use of Mahalanobis D2 statistic for estimating
genetic divergence has been emphasized by Shukla et al. (2006) [17] and Sarawgi and Rita Binse [15]. Hence, the present investigation was carried out in the saline lowland of Annamalainagar to ascertain the value and magnitude of genetic diversity of 26 rice genotypes and to select suitable genotypes for further utilization in breeding programme.
MATERIAL AND METHODS
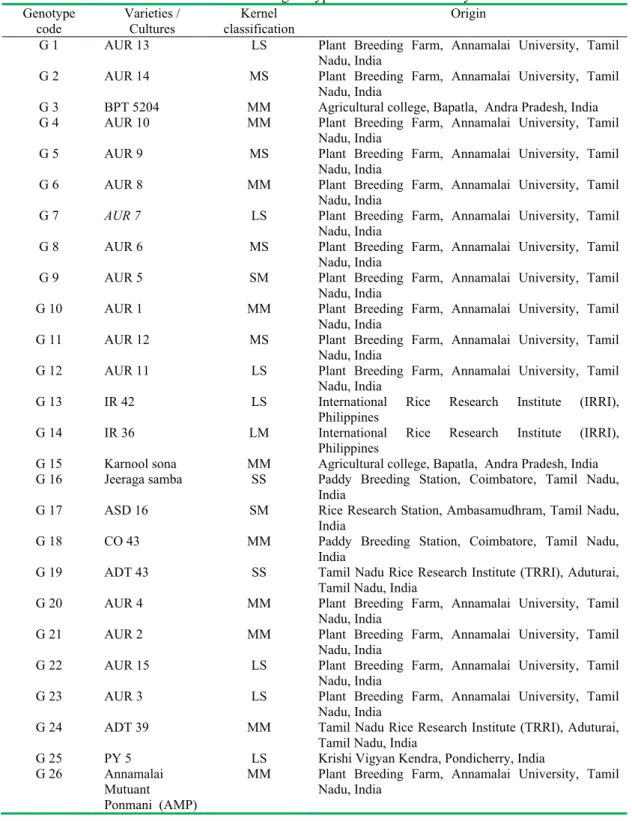
The experimental material comprised of 26 genotypes (Table 1) which include fifteen mutant genotypes (AUR 1 to 15), ten high yielding varieties along with a traditional variety Jeeraga samba were evaluated during Samba season (August-December) 2005 and 2006 at the Plant Breeding Farm (11o 24’ N latitude and 79o 44’
E longitude, + 5.79 m MSL), Annamalai University, Annamalainagar, Tamilnadu, South India. Seeds of the 26 genotypes were sown in raised nursery bed on 7th
August in each year. The seedlings were transplanted to the main field at the rate of one seedling per hill, after 25 days, with a spacing of 20 cm x 15 cm. The experiment was arranged in a randomized complete-block design with three replications, in four-row plots of 3 m length. The recommended agronomical practices and plant protection measures were followed to ensure a normal crop. Observations were recorded on five randomly selected plants in each replication from the two centre rows. Twelve productive and quality characters viz. days to first flower, productive tillers per plant, panicle length (cm), number of grains per panicle, 1000 grain weight (g), grain length (mm), grain breadth (mm), grain L/B ratio, kernel length (mm), kernel breadth (mm), kernel L/B ratio and grain yield per plant (g) were recorded. The data from the two years were pooled in the analysis. Mahalanobis D2 analysis [15] was used to
estimate genetic divergence among the 26 genotypes. Grouping of genotypes into clusters was carried out following Tocher’s methods [11]. Mean values of the variables, calculated based on measurements on plants from blocks and years for each genotype, were used in the cluster analysis.
RESULTS AND DISCUSSION
The analysis of variance revealed a significant difference among the 26 genotypes for all the twelve characters indicating the existence of high genetic variability among the genotypes for all the traits. The D2 values of
the genotypes ranged from 101.51to 8235.56 indicating that the material was quite diverse. Based on genetic distance, the twenty six genotypes were grouped into thirteen clusters.
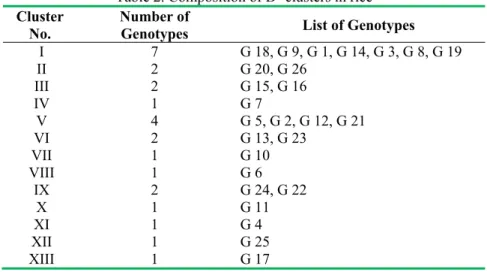
Cluster I, the largest cluster, comprised seven genotypes, followed by cluster V with four genotypes (Table 2). The clusters II, III, VI and IX comprised two genotypes each. The clusters IV, VII, VIII, X, XI, XII and XIII were monogenotypic clusters. The clustering pattern revealed that the genotypes from different sources clustered together indication that there was no association between eco geographical distribution of genotypes and genetic divergence. The possible reason for grouping of genotypes of different states in one cluster could be the free exchange of germplasm among the breeders of different regions, or unidirectional selection practiced by breeder in tailoring the promising cultivars for different regions [19]. Similar findings were reported by Chaturvedi and Maurya (2005) [2] and Sabesan (2008) [14]. This indicated that, in general, selection has been towards the same goal in the different centers of origin of these genotypes and yet, there is sufficient genetic variability, which distinctly differentiates them into 13 clusters. On the other hand, our study has also revealed that genotypes from the same centre of origin were distributed in different clusters, which may be due to differential adaptation to varied agro-ecosystems [3, 16].
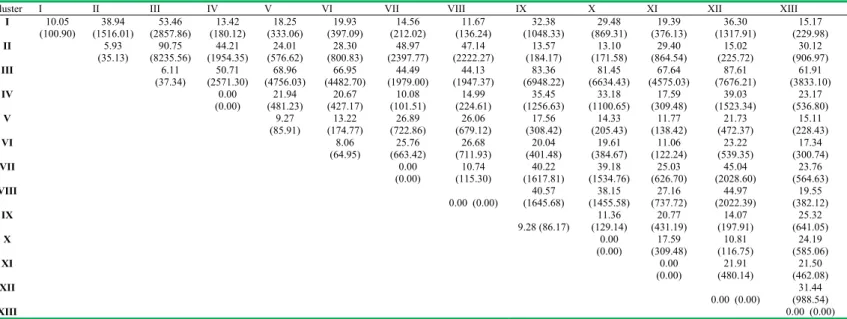
The relative divergence of each from other cluster i.e., inter-cluster distance, indicated greater divergence between cluster II and cluster III (D2 = 8235.56), the former was
characterized by genotypes with heavier grains and latter by low thousand grain weight (Table 3). It was followed by cluster III and cluster XII (D2 = 7676.21) with cluster
III having least thousand grain weight and cluster XII, a monogenotypic cluster, was characterized by longer kernels with earliness in flowering. Clusters III and IX (D2 = 6948.22) were the next divergent clusters in which
Table 1. List of genotypes selected for D2 analysis Genotype
code Varieties / Cultures classification Kernel Origin
G 1 AUR 13 LS Plant Breeding Farm, Annamalai University, Tamil Nadu, India
G 2 AUR 14 MS Plant Breeding Farm, Annamalai University, Tamil Nadu, India
G 3 BPT 5204 MM Agricultural college, Bapatla, Andra Pradesh, India G 4 AUR 10 MM Plant Breeding Farm, Annamalai University, Tamil
Nadu, India
G 5 AUR 9 MS Plant Breeding Farm, Annamalai University, Tamil Nadu, India
G 6 AUR 8 MM Plant Breeding Farm, Annamalai University, Tamil Nadu, India
G 7 AUR 7 LS Plant Breeding Farm, Annamalai University, Tamil Nadu, India
G 8 AUR 6 MS Plant Breeding Farm, Annamalai University, Tamil Nadu, India
G 9 AUR 5 SM Plant Breeding Farm, Annamalai University, Tamil Nadu, India
G 10 AUR 1 MM Plant Breeding Farm, Annamalai University, Tamil Nadu, India
G 11 AUR 12 MS Plant Breeding Farm, Annamalai University, Tamil Nadu, India
G 12 AUR 11 LS Plant Breeding Farm, Annamalai University, Tamil Nadu, India
G 13 IR 42 LS International Rice Research Institute (IRRI), Philippines
G 14 IR 36 LM International Rice Research Institute (IRRI), Philippines
G 15 Karnool sona MM Agricultural college, Bapatla, Andra Pradesh, India G 16 Jeeraga samba SS Paddy Breeding Station, Coimbatore, Tamil Nadu,
India
G 17 ASD 16 SM Rice Research Station, Ambasamudhram, Tamil Nadu, India
G 18 CO 43 MM Paddy Breeding Station, Coimbatore, Tamil Nadu, India
G 19 ADT 43 SS Tamil Nadu Rice Research Institute (TRRI), Aduturai, Tamil Nadu, India
G 20 AUR 4 MM Plant Breeding Farm, Annamalai University, Tamil Nadu, India
G 21 AUR 2 MM Plant Breeding Farm, Annamalai University, Tamil Nadu, India
G 22 AUR 15 LS Plant Breeding Farm, Annamalai University, Tamil Nadu, India
G 23 AUR 3 LS Plant Breeding Farm, Annamalai University, Tamil Nadu, India
G 24 ADT 39 MM Tamil Nadu Rice Research Institute (TRRI), Aduturai, Tamil Nadu, India
G 25 PY 5 LS Krishi Vigyan Kendra, Pondicherry, India G 26 Annamalai
Mutuant Ponmani (AMP)
408
Journal of Central European Agriculture Vol 10 (2009) No 4SABESAN Thayumanavan, SARAVANAN Kannapiran and ANANDAN Annamalai
Table 2. Composition of D2 clusters in rice Cluster
No. Number of Genotypes List of Genotypes
I 7 G 18, G 9, G 1, G 14, G 3, G 8, G 19
II 2 G 20, G 26
III 2 G 15, G 16
IV 1 G 7
V 4 G 5, G 2, G 12, G 21
VI 2 G 13, G 23
VII 1 G 10
VIII 1 G 6
IX 2 G 24, G 22
X 1 G 11
XI 1 G 4
XII 1 G 25
XIII 1 G 17
followed by cluster VII and VIII (D2 = 115.30). The lines
belonging to these clusters were relatively closer to each other, in comparison to lines grouped in other clusters. Such analysis was meant to avoid selection of parents from genetically homogeneous clusters, and to maintain a relatively broad genetic base.
The largest intra-cluster distance was recorded for cluster I (10.05) followed by clusters IX (9.28) and VI (9.27); the lines included in clusters I, VI and IX were relatively more diverse than those in the other clusters. Heterosis is generally attributed to genetic divergence among the parental lines involved in the crosses. Nevertheless, the genetic divergence for the maximum expression of the heterotic effect has a limit [6, 1].
The cluster mean values showed a wide range of variation for all the traits under study (Table 4). Cluster VI was characterized with high mean values for productive tillers per plant, panicle length, number of grains per panicle, grain length, grain L/B ratio, kernel length and kernel L/B ratio. Cluster III exhibited a low mean for thousand grain weight, grain breadth and kernel breadth. Cluster II had high mean for thousand grain weight. The values for number of grains per panicle, grain length and kernel length were comparatively high in clusters I, V and IX. The single genotypic clusters were quite different from the other clusters by either highest or lowest value for a particular character. The monogenotypic cluster XII had high mean for grain yield per plant and also had early flowering and formed a separate cluster [14].
In all the combinations of intercluster distances each character is ranked on the basis of intercluster distances. Rank 1 is given to the character having highest mean difference and rank p is given to the character having lowest mean difference, where p is the numbers of
characters. Percentage contribution of each character is calculated on the basis of occurrence of these ranks. With 42.71 per cent contribution, the number of grains per panicle and with 25.62 per cent contribution of days to first flower were the major force of discrimination among the genotypes tested (Table 3). Similar findings were made by Karthikeyan (2002) [4] and Sabesan and Saravanan (2008) [14] for number of grains per panicle and days to first flower respectively. Kernel breadth had the minimum (0.63 per cent) contribution to the total divergence. The characters viz. panicle length (6.94 per cent), grain yield per plant (6.19 per cent) and thousand grain weight (5.95 per cent) also contributed towards the genetic divergence. Similar results were reported by Senapati and Sarkar (2005) [16] for panicle length and grain yield per plant and Karthikeyan (2002) [4] for thousand grain weight.
ANAL
YSIS FOR CER
TAIN
YIELD
AND QUALITY
TRAITS IN RICE (OR
YZA
SA
TIV
A L.) GROWN IN
IRRIGA
TED SALINE LOW LAND OF
ANNAMALAINAGAR, SOUTH INDIA
. Agric.
(2009) 10:4,
405-410
(100.90) (1516.01) (2857.86) (180.12) (333.06) (397.09) (212.02) (136.24) (1048.33) (869.31) (376.13) (1317.91) (229.98)
II 5.93
(35.13) (8235.56) 90.75 (1954.35) 44.21 (576.62) 24.01 (800.83) 28.30 (2397.77) 48.97 (2222.27) 47.14 (184.17) 13.57 (171.58) 13.10 (864.54) 29.40 (225.72) 15.02 (906.97) 30.12
III 6.11
(37.34) (2571.30) 50.71 (4756.03) 68.96 (4482.70) 66.95 (1979.00) 44.49 (1947.37) 44.13 (6948.22) 83.36 (6634.43) 81.45 (4575.03) 67.64 (7676.21) 87.61 (3833.10) 61.91
IV 0.00
(0.00) (481.23) 21.94 (427.17) 20.67 (101.51) 10.08 (224.61) 14.99 (1256.63) 35.45 (1100.65) 33.18 (309.48) 17.59 (1523.34) 39.03 (536.80) 23.17
V 9.27
(85.91) (174.77) 13.22 (722.86) 26.89 (679.12) 26.06 (308.42) 17.56 (205.43) 14.33 (138.42) 11.77 (472.37) 21.73 (228.43) 15.11
VI 8.06
(64.95) (663.42) 25.76 (711.93) 26.68 (401.48) 20.04 (384.67) 19.61 (122.24) 11.06 (539.35) 23.22 (300.74) 17.34
VII 0.00
(0.00) (115.30) 10.74 (1617.81) 40.22 (1534.76) 39.18 (626.70) 25.03 (2028.60) 45.04 (564.63) 23.76
VIII
0.00 (0.00) (1645.68) 40.57 (1455.58) 38.15 (737.72) 27.16 (2022.39) 44.97 (382.12) 19.55
IX
9.28 (86.17) (129.14) 11.36 (431.19) 20.77 (197.91) 14.07 (641.05) 25.32
X 0.00
(0.00) (309.48) 17.59 (116.75) 10.81 (585.06) 24.19
XI 0.00
(0.00) (480.14) 21.91 (462.08) 21.50
XII
0.00 (0.00) (988.54) 31.44
XIII 0.00 (0.00)
Table 4. Mean performance of clusters and character contribution with respect to different characters
Cluster DF (days) PT PL
(cm) GPP TGW (g) (mm) GL (mm) GB GLBR KL (mm) (mm) KB KLBR GYD (g)
I 87.04 14.62 21.92 152.46 19.10 8.05 2.45 3.34 6.01 2.13 2.85 20.40
II 86.00 15.50 27.25 138.50 23.22 7.95 2.27 3.51 5.95 2.07 2.88 22.48
III 88.17 21.00 23.67 162.33 11.50 6.68 2.09 3.41 4.78 1.91 2.65 22.82
IV 84.33 17.33 18.67 88.67 18.03 8.87 2.17 4.09 6.87 1.97 3.49 15.80
V 83.92 16.58 22.67 132.67 20.13 8.16 2.20 3.71 6.16 2.00 3.08 19.73
VI 88.09 21.84 29.00 184.84 21.77 8.92 2.17 4.11 6.92 1.97 3.51 22.85
VII 80.00 14.67 24.67 175.33 18.73 8.00 2.23 3.59 6.00 2.03 2.96 15.83
VIII 85.67 16.00 18.00 101.00 19.13 8.43 2.67 3.16 6.43 2.47 2.60 18.80
IX 84.33 19.00 22.47 170.33 20.19 8.15 2.29 3.56 6.15 2.05 3.01 23.58
X 82.00 12.33 22.00 74.67 22.07 8.03 2.17 3.70 6.03 1.97 3.06 15.23
410
Journal of Central European Agriculture Vol 10 (2009) No 4SABESAN Thayumanavan, SARAVANAN Kannapiran and ANANDAN Annamalai
REFERENCES
[1] Arunachalam, V., Bandyopadhyay, A. Limit to genetic divergence for occurrence of heterosis: Experimental evidence from crop plant. Indian J. Genet. (1984) 44: 548–554.
[2] Chaturvedi, H.P., Maurya, D.M. Genetic divergence analysis in rice (Oryza sativa L.). Adv. Plant Sci. (2005) 18(1): 349-353.
[3] Kandamoorthy, S., Govindarasu, R. Genetic divergence in extra early rice (Oryza sativa L.) under two culture systems. Indian J. Genet. (2005) 65(1): 43-44.
[4] Karthikeyan, T. Studies on genetic divergence and genotype x environment interaction in rice. M.Sc. (Ag.) Thesis, Annamalai Univ., Annamalai nagar, India. 2002.
[5] Mahalanobis, P.C. On the generalized distance in statistics. Proc. Nat. Inst. Sci., India (1936) 2: 49-55.
[6] Moll, R.H., Lonnquist, J.H., Johnson, E.C. The relation of heterosis and genetic divergence in maize. Genetics (1965) 52: 139–144.
[7] Murty, B.R., Arunachalam, V. The nature of genetic diversity in relation to breeding system in crop plant. Indian J. Genet. (1966) 26: 188–198.
[8] Pankaj, K.S., Murli, N.M., Dipak, K.H., Verma, M.R. Genetic divergence in lowland rice of north eastern region of India. Comm. in Biometry and Crop Sci. (2006) 1(1): 35-40.
[9] Qian, Y.W., He, K.M. Utilization of exotic rice germplasm resources in Guang-dong province. Crop Genet. Resour. (1991) 2: 36–37.
[10] Rama, T. Heterosis and inbreeding depression in
rice. IRRI Newsletter (1992) 17(5): 7.
[11] Rao, C.R. Advanced statistical method in biometrical Research. John Wiley and Sons Inc., New York, 1952.
[12] Rao, T.P., Gomathinayagam, P. Genetic diversity in semi dry rice under different environments. Madras Agr. J. (1997) 84: 314–317.
[14] Sabesan, T., Saravanan, K. Genetic divergence analysis in rice (Oryza sativa L.). Paper presented in Golden Jubilee Commemorative National seminar on “Fifty years of Indian Agriculture: Problems, Prospects and Future thrusts”, Annamalai University, Tamilnadu, India. 20-21 March, 2008. pp 14.
[15] Sarawgi, A.K., Rita Bisne. Studies on genetic divergence of aromatic rice germplasm for agro morphological and quality characters. Oryza (2007) 44(1): 74-76.
[16] Senapati, B.K., Sarkar, G. Genetic divergence in tall indica rice (Oryza sativa L.) under rainfed saline soil of Sundarban. Oryza (2005) 42(1): 70-72.
[17] Shukla, V., Singh, S., Singh, H., Pradhan, S.K. Multivariate analysis in tropical japonica “New plant type” rice (Oryza sativa L.) Oryza (2006) 43(3): 203-207.
[18] Singh, R.S., Bains, S.S. Genetic divergence for ginning out turn and its components in upland cotton (G. hirsutum L.) varieties. Indian J. Genet. (1968) 28: 262– 268.