www.atmos-chem-phys.net/9/8735/2009/ © Author(s) 2009. This work is distributed under the Creative Commons Attribution 3.0 License.
Chemistry
and Physics
On the capability of IASI measurements to inform about
CO surface emissions
A. Fortems-Cheiney1, F. Chevallier1, I. Pison1, P. Bousquet1, C. Carouge1,*, C. Clerbaux2, P.-F. Coheur3, M. George2, D. Hurtmans3, and S. Szopa1
1Laboratoire des Sciences du Climat et de l’Environnement, CEA-CNRS-UVSQ, Gif-sur-Yvette, France 2UPMC Univ Paris 06, CNRS UMR8190, LATMOS/IPSL, Paris, France
3Spectroscopie de l’atmosph`ere, Chimie Quantique et Photophysique, Universit´e Libre de Bruxelles, Brussels, Belgium *now at: Division of Engineering and Applied Sciences, Harvard University, Cambridge, Massachusetts, USA
Received: 20 February 2009 – Published in Atmos. Chem. Phys. Discuss.: 20 March 2009 Revised: 7 October 2009 – Accepted: 14 October 2009 – Published: 16 November 2009
Abstract. Between July and November 2008, simultaneous observations were conducted by several orbiting instruments that monitor carbon monoxide in the atmosphere, among them the Infrared Atmospheric Sounding Instrument (IASI) and Measurements Of Pollution In The Troposphere (MO-PITT). In this paper, the concentration retrievals at about 700 hPa from these two instruments are successively used in a variational Bayesian system to infer the global distribu-tion of CO emissions. Starting from a global emission budget of 479 Tg for the considered period, the posterior estimate of CO emissions using IASI retrievals gives a total of 643 Tg, which is in close agreement with the budget calculated with version 3 of the MOPITT data (649 Tg). The regional totals are also broadly consistent between the two inversions. Even though our theoretical error budget indicates that IASI con-strains the emissions slightly less than MOPITT, because of lesser sensitivity in the lower troposphere, these first results indicate that IASI may play a major role in the quantification of the emissions of CO.
1 Introduction
The launch of a weather satellite, like METOP, generates new information flows about the atmosphere and the Earth surface with applications beyond Numerical Weather Pre-diction. The exploitation of such data usually leads to feeding them to data assimilation systems, where they
co-Correspondence to:F. Chevallier ([email protected])
exist with other data of different origin (Hollingsworth et al., 2008). Ensuring the consistency of these systems in spite of the heterogeneous data flows is an important chal-lenge for the satellite products since their definition varies for each instrument (Rodgers et al., 2003). Since the be-ginning of this century, several instruments have provided information about the atmospheric concentrations of car-bon monoxide CO, a key molecule to inform about the im-pact of human activities on the evolution of the composition of the atmosphere: MOPITT (Deeter et al., 2003), Atmo-spheric Chemistry Experiment-FTS (ACE-FTS) (Clerbaux et al., 2005), Tropospheric Emission Spectrometer (TES) (Luo et al., 2007), SCanning Imaging Absorption spectroMeter for Atmospheric ChartograpHY (SCIAMACHY) (Buchwitz et al., 2007) and IASI. Many subjective choices may induce in-consistencies (or biases) between these high-level products, like for the selection of the auxiliary datasets that help the concentration retrievals. This may explain why the estima-tion of the surface emissions of CO, which is a major appli-cation of these data, has actually been limited to MOPITT so far (Arellano et al., 2004; P´etron et al., 2004; Allen et al., 2004; Heald et al., 2004; Pfister et al., 2004; Turquety et al., 2007; Clerbaux et al., 2008; Chevallier et al., 2009).
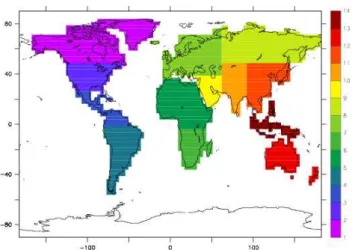
Fig. 1. Partition of the continents into 13 regions (1=North ican Boreal, 2=USA, 3=South American Tropical, 4=South Amer-ican Temperate, 5=Northern Africa, 6=Southern Africa, 7=Europe, 8=Eurasian Boreal, 9=Middle East, 10=South Asia, 11=South East Asia, 12=Australia, 13=Indonesia). This partition is used to synthe-size the results of the grid-point inversion.
by a simplified chemistry module (Chevallier et al., 2009). This multi-species system includes the simplified chemistry-transport model (CTM) LMDz-SACS and its adjoint (Pison et al., 2009), optimizing the four main reactive species of the methane oxidation chain (CH4, CO, formaldehyde HCHO and OH). Data and methods are described in the next sec-tion. The results are shown in Sect. 2.4 and discussed in the last section.
2 Method and data
2.1 Inversion system
The data assimilation system follows the work initiated by Chevallier et al. (2005) for CO2. As described in Cheval-lier et al. (2009), it seeks an optimal solution for global CO sources that is statistically consistent, in a Bayesian sense, with both the observed atmospheric concentrations and the available a priori information about the sources. The solu-tion is found by the iterative minimizasolu-tion of a cost funcsolu-tion
Jdefined as:
J (x)=(x−xb)TB−1(x−xb)+(H(x)−y)TR−1(H(x)−y) (1)
His the CTM LMDz-SACS described in the next section
coupled with the averaging kernels of the satellite retrievals. xbare the prior fluxes described in Sect. 2.3 with error
statis-tics defined by the covariance matrixB. yare the observa-tions of Section 2.4, the error statistics of which are repre-sented by the covariance matrixR. The state vectorx con-sists of the following variables:
In this study, the June–November 2008 period is processed at once. However, the first month (June) will not be con-sidered in the following because the inversion system hardly distinguishes errors in the fluxes from errors in initial con-centrations for the first couple of weeks.
The M1QN3 limited-memory quasi-Newton software de-veloped by Gilbert and Lemar´echal (1989) is our minimizer. Fifteen iterations are needed to reduce the norm of the gradi-ent ofJ by a 20-fold factor.
This inversion system follows statistical principles and a full probability distribution function (pdf) of the posterior CO emissions could in principle be inferred. With Gaussian prior and Gaussian observation uncertainties (fully described byBandR), the posterior pdf follows a multivariate Gaus-sian law. To limit the computational burden, the inversion system focuses on the solution with the largest probability. However, the width of the pdf is an important indicator of the reliability of the inferred emissions. Our approach for de-termining the posterior uncertainty consists in performing an ensemble of inversions (Chevallier et al., 2007). The mem-bers of the ensemble differ by the prior emissions and by the observations: the ensemble of prior emissions follows the er-ror statistics given by B and the ensemble of observations follows the statistics given byR. Doing that, the ensemble of inverted emissions follows the theoretical posterior error statistics (see Sect. 3.1).
2.2 Chemistry-transport model
Fig. 2.The number of “super observations” for IASI and for MO-PITT in each of the regions of Fig. 1.
assumption is to model only the production and the loss of CH4, HCHO, CO and H2and to consider all other reactions as instantaneous. In order to save computing time in the iter-ative inversion system, LMDZ-SACS uses a number of fields pre-computed from LMDZ-INCA for the transport (e.g., at-mospheric mass fluxes) and for the chemistry (e.g., reaction yields).
2.3 Prior emissions
The prior information provided to the inversion system mainly combines two datasets: version 3 of the Emission Database for Global Atmospheric Research (EDGAR3) in-ventory valid for 1995 for the fossil fuel emissions (Olivier and Berdowski , 2001) and version 2 of the Global Fire and Emission database (GFED-v2; Van der Werf et al., 2006) valid for 2006 for biomass burning. No effort is made here to adapt the 1995 EDGAR3 inventory or the 2006 GFED-v2 data to year 2008 in the prior (the adaptation is done by the inversion system based on the concentration observations). It should be reminded that since 1995 or even 2000, global eco-nomic growth, in particular in Asia, has modified the ampli-tude of the fossil fuel emissions (Ohara et al., 2007). Emis-sions of other species, like the biogenic ones, are those usu-ally used in the LMDZ-INCA model and described in Fol-berth et al. (2006). The error standard deviations assigned to the prior emissions in the matrixBare set to 100% of the maximum value of the emission time series during the cor-responding year for each grid point, as in Chevallier et al. (2009). This choice of a relatively large value has been made to relax the constraint to the prior emissions. This was found especially important for highly seasonal emissions such as fires. Additional tests are reported in the following using a value of 400%.
Fig. 3. Reduction of the CO emissions uncertainty based on the IASI retrievals, in %, for 8-day mean grid point CO surface emis-sions.
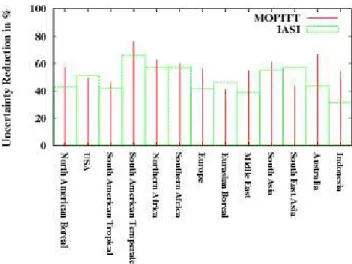
Fig. 4.Comparison of the uncertainty reduction obtained using ei-ther IASI or MOPITT retrievals in the 13 aggregation regions, in %.
2.4 Observation data
2.4.1 IASI CO retrievals
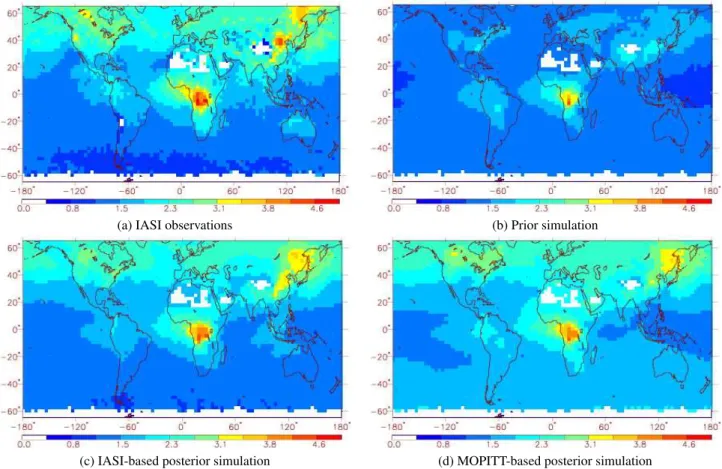
(a) IASI observations (b) Prior simulation
(c) IASI-based posterior simulation (d) MOPITT-based posterior simulation
Fig. 5.Mean CO partial columns, in 1017mol.cm−2, for July 2008 in(a)the IASI retrievals for the level closest to 700 hPa,(b)the prior simulation,(c)the IASI-based posterior simulation and(d)the MOPITT-based posterior simulation. The simulations all take the individual IASI averaging kernels corresponding to (a) into account. Abscissa and ordinate report the longitudes and latitudes.
code based on optimal estimation. The retrieved profiles are defined on a vertical grid of 19 standard levels (from 0.5 km to 18.5 km) and are provided with individual averaging ker-nels. CO total column products obtained by this processing algorithm have been validated against other spaceborne ther-mal infrared measurements (George et al., 2009), including MOPITT. In the continuity of our previous developments for MOPITT (Chevallier et al., 2009), only the layer closest to 700 hPa is used here (see next paragraph). Most cloudy situ-ations are filtered out before the concentration retrieval. Less reliable retrievals have been identified for latitudes within 25◦from the poles, at nightime, and at locations with surface emissivity greater than 0.98 (icy surface) or lower than 0.93 (over desert). Those data are excluded from the inversion. 2.4.2 MOPITT CO retrievals
The MOPITT instrument has been flown onboard the NASA EOS-Terra satellite, on another low sun-synchronous orbit that crosses the equator at 10:30 and 22:30 LST. The spa-tial resolution of its observations is about 22 km at nadir. Its 640-km swath is smaller than for IASI and three days worth of measurements are needed to achieve global
(a) MOPITT observations (b) Prior simulation
(c) MOPITT-based posterior simulation (d) IASI-based posterior simulation
Fig. 6.Mean CO concentrations, in parts per million, for July 2008 in(a)the MOPITT retrievals for the 700 hPa pressure level,(b)the prior simulation,(c)the MOPITT-based posterior simulation and(d)the IASI-based posterior simulation. The simulations all take the individual MOPITT averaging kernels corresponding to (a) into account. Abscissa and ordinate report the longitudes and latitudes.
2.4.3 Data processing
Both IASI and MOPITT retrievals are averaged on the CTM resolution (2.5◦×3.75◦) at the orbit level in order to reduce the effect of correlated errors between neighbour-ing observations in the inversion system. About 830 000 IASI “super-observations” remain in the 6-month inversion against 545 000 “super-observations” for MOPITT, that has a lower spatial coverage. The number of observations is pre-sented in Fig. 2 according to the 13 continental regions of Fig. 1. In comparison, an observing system that would pro-vide one “super-observation” per day on each CTM grid box between 65◦N and 65◦S during the same period would have about 913 500 “super-observations”, which is not much more than the IASI data used here.
As described by Emmons et al. (2004), by Turquety et al. (2009) and by George et al. (2009), and in order to properly compare MOPITT and IASI retrievalsywith the CTM out-putsyCTM, the corresponding averaging kernel matrixAis used to create a profiley˜:
˜
y=AyCTM+(I−A)yb (2)
withIthe identity matrix andybthe prior concentrations used
in the MOPITT (in parts per million) and IASI (in mol.cm−2) retrievals.
The averaging kernels inform about the sensitivity of the retrievals to the true CO profile, with the remainder of the information coming from the a priori profileyb. They are valuable indicators of the vertical resolution of the products (Deeter et al., 2003). In both IASI and MOPITT products, a single prior concentration profile is used for all soundings, while an averaging kernel is provided with each profile.
The errors are assigned in the inversion system as a com-bination of the retrieval error reported in the MOPITT and IASI datasets, and of the CTM errors arbitrarily set to 50% of the retrieval values, without correlation.
3 Results
3.1 Uncertainty reduction
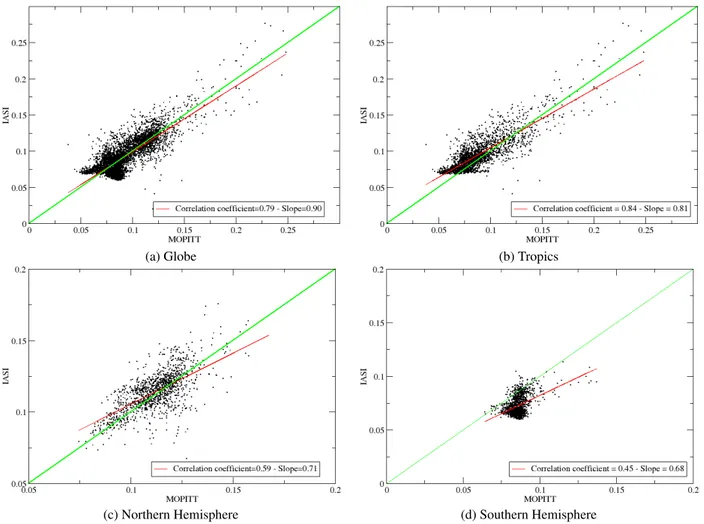
(a) Globe (b) Tropics
(c) Northern Hemisphere (d) Southern Hemisphere
Fig. 7.Scatter plot of the individual IASI concentration retrievals, in parts per million, vs. the MOPITT ones for August 2008 at the level closest to 700 hPa. The correlation coefficient and the regression slope are reported. The bisector appears in green. Note that since the two concentration products have different averaging kernels, full agreement is not expected.
Table 1.CO emission budgets from July to November 2008 before andafterthe inversions, in Tg. The posterior-minus-prior increments are also given in % of the prior emissions.
prior (Tg) IASI based IASI MOPITT based MOPITT posterior (Tg) increments(%) posterior (Tg) increments(%)
North Am Boreal 4 16 +300% 22 +450%
USA 46 41 −11% 48 +4%
South Am Trop 10 16 +60% 7 −30%
South Am Temp 49 85 +73% 94 +92%
Northern Africa 31 54 +74% 50 +61%
Southern Africa 67 137 +105% 125 +87%
Europe 44 51 +16% 64 +45%
Eurasian Boreal 10 21 +110% 29 +190%
Middle East 9 15 +67% 29 +222%
South Asia 32 31 −3% 29 −9%
South East Asia 57 103 +80% 93 +63%
Indonesia 93 41 −57% 9 −93%
Australia 13 24 +85% 41 +215%
standard deviation andσathe theoretical posterior error
stan-dard deviation (see Sect. 2.1). It is larger than 20% in the emission regions and reaches 50% in some isolated pixels.
The uncertainty reductions on the emissions aggregated in the 13 continental regions of Fig. 1 are shown in Fig. 4. In the inversion with IASI retrievals, the uncertainty reduction is maximal in the South American Temperate region (66%) and minimal in Indonesia (32%). For instance, significant reductions are seen in Europe (42%), the USA (52%) and the two African regions (57% for both).
The uncertainty reduction with IASI is higher than with MOPITT for two regions (Eurasian Boreal and South East Asia) and similar or smaller by only a few percentage points in most other regions. The largest differences in favor of MOPITT are the less-emitting regions (Australia, Indonesia, Middle East and North American Boreal). As a sensitivity test, the error standard deviation assigned to the prior fluxes has been set to 400% against 100% (see Sect. 2.3). The im-pact on uncertainty is found to be small, with differences in the reduction of a few percents only (not shown).
The reasons for the differences between the uncertainty reductions of IASI and MOPITT are twofold. First, the av-eraging kernels exhibit significant variability depending on location and time, through variability of the atmospheric temperature profile, surface pressure and temperature, etc. (Deeter et al., 2003). In general, the maximum sensitivities for IASI are observed between 6 and 10 km (Turquety et al., 2004) whereas MOPITT averaging kernels peak between 4 and 7 km. Second, the number of IASI “super observations” is larger than for MOPITT, as seen in Fig. 2, except over Northern Africa. When IASI and MOPITT provide a similar number of retrievals (e.g., in the Middle East or in Australia), the difference in uncertainty reduction is driven by the differ-ence in averaging kernels, giving an advantage to MOPITT, whose averaging kernels peak at lower altitudes.
3.2 IASI and MOPITT CO concentrations
As can be seen in Fig. 5a and Fig. 6a for July 2008, MO-PITT and IASI agree in the concentration patterns reason-ably well, with high CO concentrations over Central Africa and East Asia, respectively associated with biomass burning and urban pollution.
The observed IASI (a), prior simulation (b) and IASI posterior simulation (c) CO concentrations are displayed in Fig. 5 for July 2008. The first-guess concentrations fit the IASI data rather well in the Southern hemisphere. In the Northern hemisphere, an underestimation by about 60% is seen, and even more over Alaska and East Asia (120%). A similar feature is seen with MOPITT (Fig. 6). These dis-crepancies are significantly reduced after the inversion. The model does not exactly fit the observations since the analysis is pulled both towards the observations and towards the prior. The MOPITT inversion is verified against the IASI con-centrations and vice versa with each time the appropriate
averaging kernel and space-time location. Comparing both Fig. 5c and d and Fig. 6c and d, we can see that the IASI posterior concentrations are smaller than the MOPITT pos-terior concentrations in the Southern Hemisphere, larger in the plumes over Africa and East Asia (in particular when us-ing the MOPITT averagus-ing kernels that peak lower in the atmosphere than for IASI) and rather similar elsewhere. A summary of the differences between both satellite products is shown in Fig. 7 for the Northern hemisphere, the Southern hemisphere, the Tropics and the whole globe. The patterns of the two retrieval products are consistent to a large extent with a global correlation coefficient of 0.79. Among the three latitudes bands, the highest correlation (at 0.84) is found in the Tropics (between 30◦S and 30◦N). IASI tends to pro-vide values within a smaller range than MOPITT: the slope varies between 0.68 in the Southern Hemisphere and 0.81 in the Tropics. For the whole globe, the slope reaches 0.90. These differences are consistent with the study by George et al. (2009) who compared the two level-2 satellite products. 3.3 Emissions
The total posterior CO emissions from July to November 2008 are shown in Table 1. Overall, both inversions lead to an increase of the CO emissions compared to the correspond-ing prior, with respectively +35% with MOPITT and +34% with IASI for the whole Earth. Both inversions yield analysis increments (posterior minus prior) of the same sign, except for the USA and the South American Tropical region, where the increments do not exceed a few Tg anyway. An impor-tant increase is observed in Southern Africa, a region which is affected by biomass burning (+87% with MOPITT and +105% with IASI) and for South East Asia (+63% with MO-PITT and +80% with IASI) as already noted in other studies (Carmichael et al., 2003; Palmer et al., 2003; P´etron et al., 2004; Arellano et al., 2004; Allen et al., 2004; Heald et al., 2004; Wang et al., 2004). These two regions are the largest emitters of CO among the 13 regions defined, in the MO-PITT and IASI analyses, with respectively 125 and 137 Tg for Southern Africa, and 93 and 103 Tg for South East Asia. Positive increments are also seen in the regions North Amer-ican Boreal, South AmerAmer-ican temperate, Northen Africa, Eu-rope, Eurasian Boreal, Middle East, South Asia and Aus-tralia. Posterior emissions are lower than the prior estimates in Indonesia, likely because the prior biomass burning in-ventory corresponds to an ENSO year (2006) (−93% with MOPITT and−57% with IASI).
The analysed total emissions with IASI differ by less than 1% from MOPITT (643 against 649 Tg).
4 Conclusions
with IASI CO retrievals, in particular in comparison with the well-documented MOPITT 9-year database. Only a few months worth of IASI data were available for this study. Moreover, the fact that they correspond to recent dates pre-vented us from benefitting from surface measurements to rate the inversions. In spite of these limitations, the preliminary results gathered here show good promises for IASI to help pinning down the CO emissions.
A multi-instrument inversion strategy may filter the product-specific biases of the retrievals, with the inversion providing concentration values somewhere in-between the retrieval products. However, some biases may be shared by the two instruments, like the possible underestimation of very large concentrations (e.g., in fire plumes) caused by the use of a single prior profile in both concentrations prod-ucts. Some improvements of the inversion results are also expected from the inclusion of formaldehyde retrievals, like those from the Ozone Monitoring Instrument (OMI) (Lev-elt et al., 2006). Indeed, observations of HCHO should in-directly constrain the emissions in the inversion system by informing about the secondary production of CO.
Acknowledgements. IASI has been developed and built under the responsibility of the Centre National d’Etudes Spatiales (CNES, France). It is flown onboard the Metop satellites as part of the EUMETSAT Polar System. The IASI L1 data are received through the EUMETCast near real time data distribution service. We acknowledge the NCAR Science team for MOPITT data. The autors acknowledge the Ether French atmospheric database (http://ether.ipsl.jussieu.fr) and LATMOS for providing the IASI data. Authors wish to thank F. Marabelle (LSCE) for computer support. The first author is funded by CNES.
Edited by: A. Richter
The publication of this article is financed by CNRS-INSU.
roform, Atmos. Chem. Phys., 5, 2635–2656, 2005, http://www.atmos-chem-phys.net/5/2635/2005/.
Buchwitz, M., Khlystova, I., Bovensmann, H., and Burrows, J. P.: Three years of global carbon monoxide from SCIAMACHY: Comparison with MOPITT and first results related to the detec-tion of enhanced CO over cities, Atmos. Chem. Phys., 7, 2399– 2411,2007.
Carmichael, G. R., Tang, Y., Kurata, G., Uno, I., and Streets, D. G.: Evaluating regional emissions estimates using the TRACE-P observations, J.Geophys. Res., 108(D21), 8810, doi:10.1029/2002JD003116, 2003.
Chevallier, F., Fisher, M., Peylin, P., Serrar, S., Bousquet, P., Br´eon, F.-M., Ch´edin, A., and Ciais, P.: Inferring CO2 sources and sinks from satellite observations: method and application to TOVS data, J. Geophys. Res., 110, D24309, doi:10.1029/2005JD006390, 2005.
Chevallier, F., Br´eon, F.-M., and Rayner, P. J.: Contribu-tion of the Orbiting Carbon Observatory to the estimaContribu-tion of CO2 sources and sinks: Theoretical study in a variational data assimilation framework, J. Geophys. Res., 112, D09307, doi:10.1029/2006JD007375, 2007.
Chevallier, F., Fortems, A., Bousquet, P., Pison, I., Szopa, S., De-vaux, M., and Hauglustaine, D.: African CO emissions between years 2000 to 2006 as estimated from MOPITT observations, Biogeosciences, 6, 103–111, 2009,
http://www.biogeosciences.net/6/103/2009/.
Clerbaux, C., Coheur, P.-F., Hurtmans, D., Barret, B., Carleel, M., Colin, R., Semeniuk, K., McConnell, J.C., Boone, C. and Bernath, P.: Carbon monoxide distribution from the ACE-FTS solar occultation measurements, Geophys. Res. Lett., 32, L16S01, doi:10.1029/2005GL022394, 2005.
Clerbaux, C., Edwards, D. P., Deeter, M., Emmons, L., Lam-raque, J.-F., Tie, X. X., Massie, S. T., and Gille, J.: Carbon monoxide pollution from cities and urban areas observed by the Terra/MOPITT mission, Geophys. Res. Lett., 35, L103817, doi:10.1029/2007GL032300, 2008.
Clerbaux, C., Boynard, A., Clarisse, L., George, M., Hadji-Lazaro, J., Herbin, H., Hurtmans, D., Pommier, M., Razavi, A., Turquety, S., Wespes, C., and Coheur, P.-F.: Monitoring of atmospheric composition using the thermal infrared IASI/MetOp sounder, At-mos. Chem. Phys., 9, 6041–6054, 2009,
http://www.atmos-chem-phys.net/9/6041/2009/.
MO-PITT and in-situ observations of CO based on a large-scale fea-ture sampled during TRACE-P, J.Geophys. Res., 109, D15S04, doi:10.1029/2002JD004308, 2004.
Deeter, M. N., Emmons, L. K., Francis, G. L., et al.: Opera-tional carbon monoxide retrieval algorithm and selected results for the MOPITT instrument, J. Geophys. Res., 108(D14), 4399, doi:10.1029/2002JD003186, 2003.
Deeter, M. N., Emmons, L. K., Edwards, D. P., Gille, J. C., and Drummond, J. R.: Vertical resolution and information content of CO profiles retrieved by MOPITT, Geophys. Res. Lett., 31, L15112, doi:10.1029/2004GL020235, 2004.
Emmons, L. K., Deeter, M. N., Gille, J. C., et al.: Validation of Measurements of Pollution in the Troposphere (MOPITT) CO retrievals with aircraft in situ profiles, J. Geophys. Res., 109, D03309, doi:10.1029/2003JD004101, 2004.
Folberth, G. A., Hauglustaine, D. A., Lathi`ere, J., and Brocheto, F.: Interactive chemistry in the Laboratoire de M´et´eorologie Dy-namique general circulation model: model description and im-pact analysis of biogenic hydrocarbons on tropospheric chem-istry, Atmos. Chem. Phys., 6, 2273–2319, 2006,
http://www.atmos-chem-phys.net/6/2273/2006/.
George, M., Clerbaux, C., Coheur, P.-F., Hadji-Lazaro, J., Edwards, D., Worden, H., Luo, M., Rinsland, C. P., and Barnet, C.: Carbon monoxide distributions from the IASI/METOP mission: evalua-tion with other space-borne remote sensors, Atmos. Chem. Phys. Discuss., 9, 9793–9822, 2009,
http://www.atmos-chem-phys-discuss.net/9/9793/2009/. Gilbert, J. C. and Lemar´echal, C.: Some numerical experiments
with variable-storage quasi-Newton algorithms, Math. Program., 45, 407–435, 1989.
Hauglustaine, D. A., Hourdin, F., Jourdain, L., Filiberti, M.-A., Walters, S., Lamarque, J.-F., and Holland, E. A.: Interac-tive chemistry in the Laboratoire de M´et´eorologie Dynamique general circulation model: Description and background tropo-spheric chemistry evaluation, J. Geophys. Res., 109, D04314, doi:10.1029/2003JD003957, 2004.
Heald, C. L., Jacob, D. J., Jones, D. B. A., Palmer, P. I., Logan, J. A., Streets, D. G., Sachse, G. W., Gille, J. C., Hoffman, R. N., and Nehrkorn, T.: Comparative inverse analysis of satellite (MO-PITT) and aircraft (TRACE-P) observations to estimates Asian sources of carbon monoxide, J. Geophys. Res., 109, D23306, doi:10.1029/2004GL005185, 2004.
Hollingsworth, A., Engelen, R. J., Textor, C., et al.: The Global Earth-system Monitoring using Satellite and in-situ data (GEMS) Project: Towards a monitoring and forecasting system for at-mospheric composition, B. Am. Meteorol. Soc., 89, 1147–1164, doi:10.1175/2008BAMMS2355.1, 2008.
Hourdin, F., Musat, I., Bony, S., et al.: The LMDZ4 general circula-tion model: climate performance and sensitivity to parametrized physics with emphasis on tropical convection, Clim. Dynam., 27, 787–813, 2006.
Levelt, P. F., Hilsenrath, E., Leppelmeier, G. W., van den Oord, G. H. J., Bhartia, P. K., Tamminen, J., de Haan, J. F., and Veefkinf, J. P.: Science objectives of the Ozone Monitoring Instrument, Geo. Rem. Sens., 44, 5, 1199–1208, 2006.
Luo, M., Rinsland, C. P., Rodgers, C. D., Logan, J. A., Wor-den, H., Kulawik, S., Eldering, A., Goldman, A., Shephard, M. W., Gunson, M., and Lampel, M. : Comparison of car-bon monoxide measurements by TES and MOPITT: The
influ-ence of a priori data and instrument characteristics on nadir at-mospheric species retrievals, J. Geophys. Res., 112, D09303, doi:10.1029/2006JD007663, 2007.
Ohara, T., Akimoto, H., Kurokawa, J., Horii, N., Yamaji, K., Yan, X., and Hayasaka, T.: An Asian emission inventory of anthro-pogenic emission sources for the period 1980–2020, Atmos. Chem. Phys., 7, 4419–4444, 2007,
http://www.atmos-chem-phys.net/7/4419/2007/.
Olivier, J. G. J. and Berdowski, J. J. M.: Global emissions sources and sinks, The Climate System, 2001.
Palmer, P. I., Jacob, D. J., Jones, D. B. A., Heald, C. L., Yantosca, R. M., Logan, J. A., Sachse, G.W. and Streets, D.G. : Inverting for emissions of carbon monoxide from Asia using aircraft ob-servations over the Western Pacific, J. Geophys. Res., 108(D21), 8828, doi:10.1029/2003JD003397, 2007.
P´etron, G., Granier, C., Khattatov, B., Yudin, V., Lamar-que, J.-F., Emmons, L., Gille, J., and Edwards, D. P.: Monthly CO surface sources inventory based on the 2000-2001 MOPITT satellite data, Geophys. Res. Lett., 31, L21107, doi:10.1029/2004GL020560, 2004.
Pfister, G., Hess, P. G., Emmons, L. K., Lamarque, J.-F., Wiedin-myer, C., Edwards, D. P., Petron, G., Gille, J. C., and Sachse, G. W.: Quantifying CO emissions from the 2004 Alaskan wild-fires using MOPITT CO data, Geophys. Res. Lett, 32, L11809, doi:10.1029/2004GL022995, 2004.
Pison, I., Bousquet, P., Chevallier, F., Szopa, S., and Hauglustaine, D. A.: Multi-species inversion of CH4, CO and H2emissions from surface measurements, Atmos. Chem. Phys., 9, 5281–5297, 2009,
http://www.atmos-chem-phys.net/9/5281/2009/.
Rodgers, C. D. and Connor, B. J.: Intercomparison of re-mote sounding instruments, J. Geophys. Res., 108(D3), 4116, doi:10.1029/2002JD002299, 2003.
Turquety, S., Hadji-Lazaro, J., Clerbaux, C., Hauglustaine, D. A., Clough, S. A., Cass´e, V., Schl¨ussel, P., and M´egie, G.: Op-erational trace gas retrieval algorithm for the Infrared Atmo-spheric Sounding Interferometer, J. Geophys. Res., 109, D21301, doi:10.1029/2004JD004821, 2004.
Turquety, S., Logan, J. A., Jacob, D. J., Hudman, R. C., Leung, F. Y., Heald, C. L., Yantosca, R. M., and Wu, S.: Inventory of boreal fire emissions for North America in 2004: importance of peat burning and pyroconvective injection, J. Geophys. Res., 112, D12S03, doi:10.1029/2006JD007281, 2007.
Turquety, S., Hurtmans, D., Hadji-Lazaro, J., Coheur, P.-F., Cler-baux, C., Josset, D., and Tsamalis, C.: Tracking the emission and transport of pollution from wildfires using the IASI CO re-trievals: analysis of the summer 2007 Greek fires, Atmos. Chem. Phys., 9, 4897–4913, 2009,
http://www.atmos-chem-phys.net/9/4897/2009/.
Van der Werf, G. R., Randerson, J. T., Giglio, L., Collatz, G. J., and Kasibhatla, P. S.: Interannual variability in global biomass burning emission from 1997 to 2004, Atmos. Chem. Phys., 6, 3423–3441, 2006,
http://www.atmos-chem-phys.net/6/3423/2006/.