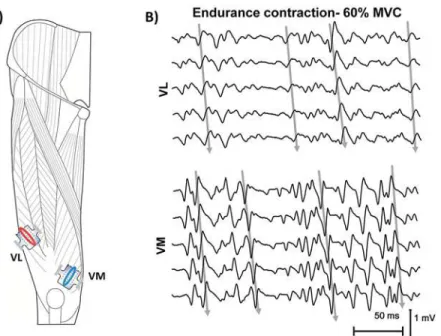
Evaluation of central and peripheral fatigue in the quadriceps using fractal dimension and conduction velocity in young females.
Texto
Imagem
Documentos relacionados
Os modelos desenvolvidos por Kable & Jeffcry (19RO), Skilakakis (1981) c Milgroom & Fry (19RR), ('onfirmam o resultado obtido, visto que, quanto maior a cfiráda do
João Luiz Bastos – Universidade Federal de Santa Catarina – Brasil José Maria Pacheco de Souza – Universidade de São Paulo – Brasil Marly Augusto Cardoso – Universidade de
As a conclusion, there is a decrease in the fractal dimension and hence in the swimming behavior complexity being under fatigue after a maximal trial.. Keywords —
Este artigo discute o filme Voar é com os pássaros (1971) do diretor norte-americano Robert Altman fazendo uma reflexão sobre as confluências entre as inovações da geração de
Desta forma, diante da importância do tema para a saúde pública, delineou-se como objetivos do es- tudo identificar, entre pessoas com hipertensão arterial, os
Based on the above considerations, the objectives of the current study were to compare the distributions of the Dutch Fatigue Scale (DUFS), Dutch Exertion Fatigue Scale (DEFS),
Basado en la comparación pre-post versus grupo experimental el grupo de control vio un aumento en el autoconcepto matemático, el autoconcepto escolar, el autoconcepto social de
For a given sub- maximal stimulation, the combined effects of potentiation and fatigue could result in an increase, no change or a decrease in active force, depending on the
