Enhanced Production of Tannase from
Redgram Husk Using Response Surface
Methodology
S.K.Mohan*1, T.Viruthagiri2 and C.Arunkumar3
*1
Research Scholar, Department of Chemical Engineering, Annamalai niversity, Annamalainagar, Tamilnadu, India.
2
Professor, Department of Chemical Engineering, Annamalai University, Annamalainagar, Tamilnadu, India
3
M.Tech (IBT), Department of Chemical Engineering, Annamalai University,Annamalainagar, Tamilnadu, India
ABSTRACT
PURPOSE:
To Study the Statistical Optimization of fermentation conditions for maximum production of tannase enzyme by
Aspergillus flavus (MTCC 3783), using redgram husk as a substrate was studied using the Response Surface
Methodology.
METHOD:
The present study was done via two steps. At first to study the maximum production of tannase enzyme by
Aspergillus flavus, using redgram husk as a substrate followed by Statistical Optimization of Process parameters
using Response Surface Methodology.
RESULTS:
The optimum conditions were tannic acid concentration, 2.8 % (w/v); fermentation period, 95 h; temperature, 34ºC;
and pH 5.65. Higher value of the regression coefficient (R2
CONCLUSIONS:
= 0.9806) indicates excellent evaluation of experimental data by second-order polynomial regression model. The RSM revealed that a maximum tannase production of 143.5 U/ml was obtained at the optimum conditions.
The Response Surface Methodology using Central Composite Design was effectively applied for the production of
tannase from Aspergillus flavus,using redgram husk as a substrate in submerged fermentation.
Key words
Tannase, Response Surface Methodology, Aspergillus flavus, Submerged fermentation
INTRODUCTION
Tannin acyl hydrolase also known as tannase (E.C.3.1.1.20) is a hydrolytic enzyme that catalyses the hydrolysis of (hydrolysable) tannins releasing glucose and gallic acid. Tannins are natural compounds which have a number of phenolic hydroxyl groups and can precipitate protein. The ability of these compounds to precipitate protein generates some problems. Tannins are capable of interacting with protein and crude-fibers and also with digestive enzymes so that they could interfere with the digestion process that can inhibit the growth of livestock [1].
Tannase is industrially important inducible enzyme produced by large number of fungi and a few bacteria [2]. The fungal tannase is used in many industrial processing including clarification of fruit juice; detannification of food, high grade leather tannin and coffee flavored soft drinks, but the major commercial application of the tannase is in the manufacture of instant tea and in the production of gallic acid [5]. Garcia-Conesa et al [6] reported its application in plant cell wall digestibility by breakage of polyphenolics such as dehydrodimer cross links present in the cell wall. In Industrial level tannase is mainly produced by Aspergillus species under submerged fermentation (SmF). The SmF is widely used for enzyme production because it offers many advantages like uniform process conditions namely concentration, Temperature, pH, aeration and agitation in the bioreactors [9, 12].
In the present work, optimization of tannase production by Aspergillus flavus sp. in a batch process using redgram husk as the substrate, was carried out using a sequential strategy of the experimental design.
MATERIALS AND METHODS CHEMICALS
MATERIALS
Chemicals used in the experiments were purchased from Hi-Media, Mumbai and were of the highest purity.
Redgram husk samples were obtained from the local market and used as a substrate for tannase production. The sample was made into 100 mesh (0.15 mm) fine powder by the use of laboratory blender at 3000 rpm and was preserved in a sealed plastic bag at 4°C to prevent any possible degradation or spoilage.
MICROORGANISM AND MEDIA
The fungal culture, Aspergillus flavus (MTCC 3783),was obtained from IMTECH, Chandigarh and used
for tannase production. The strain was maintained on Czapek Dox minimal media agar slants supplemented with 1 % (w/v) tannic acid as the sole carbon source. The fungal strain was sub-cultured periodically, grown at 30ºC for 7 days. The well grown culture was stored at 4°C in a refrigerator and used for further subculturing.
The composition of the Czapek Dox minimal medium used for tannase enzyme production was tannic acid - 10 g/L, sodium nitrate - 6 g/L, potassium dihydrogen orthophosphate - 1.52 g/L, magnesium sulphate - 0.52 g/L, potassium chloride - 0.52 g/L, ferrous sulphate - 0.01 g/L and zinc sulphate- 0.01 g/L. Cells were harvested from slants and used to inoculate liquid medium.
PRODUCTION OF TANNASE
The spore suspension was inoculated in 250 ml Erlenmeyer flask containing 100 ml of Czapek Dox minimal medium. 3 gm of substrate (redgram husk) was added separately to the above mentioned medium for studying their effect on the enzyme production. The cultures were grown at 30°C, 140 rpm for 6 days in an incubator shaker. The samples were withdrawn at regular intervals of 24 h. The biomass was separated by filtering through Whatman No.1 filter paper. The cell free culture broth was assayed for the tannase activity.
ASSAY OF TANNASE
0.1 ml of enzyme solution was incubated with 0.3 ml of 1.0% (w/v) tannic acid and 0.2 M acetate buffer (pH 5.0) at 40°C for 10 min and then the enzyme production was stopped by cooling to 0°C by the addition of 2 ml Bovine Serum Albumin (BSA) (1mg/ml), which precipitates the remaining tannic acid. Simultaneously a control without the enzyme was incubated and the samples were analyzed. The tubes were then centrifuged (5,000 x g, 10 min) and the precipitate was dissolved in 2 ml of Sodium Dodecyl Sulphate (SDS) – triethanolamine (1% w/v SDS
in 5% v/v triethanolamine) solution and the absorbency was measured at 550 nm after addition of 1 ml of FeCl3
(0.01 M FeCl3
One Unit of the tannase enzyme was defined as the amount of enzyme required to hydrolyze 1μ mole of
ester linkage of tannic acid in 1 min at specific condition. in 0.01N HCl ) [11].
EXPERIMENTAL DESIGN AND STATISTICAL ANALYSIS
CENTRAL COMPOSITE DESIGN
The Central Composite Design (CCD) using statistical software package “Design Expert 7.1.5” was used to obtain a quadratic model, consisting of factorial trials and star points to estimate quadratic effects and central points to estimate the pure process variability with tannase production as response. RSM was employed to optimize the
process parameters namely tannic acid concentration, fermentation period, temperature and PH
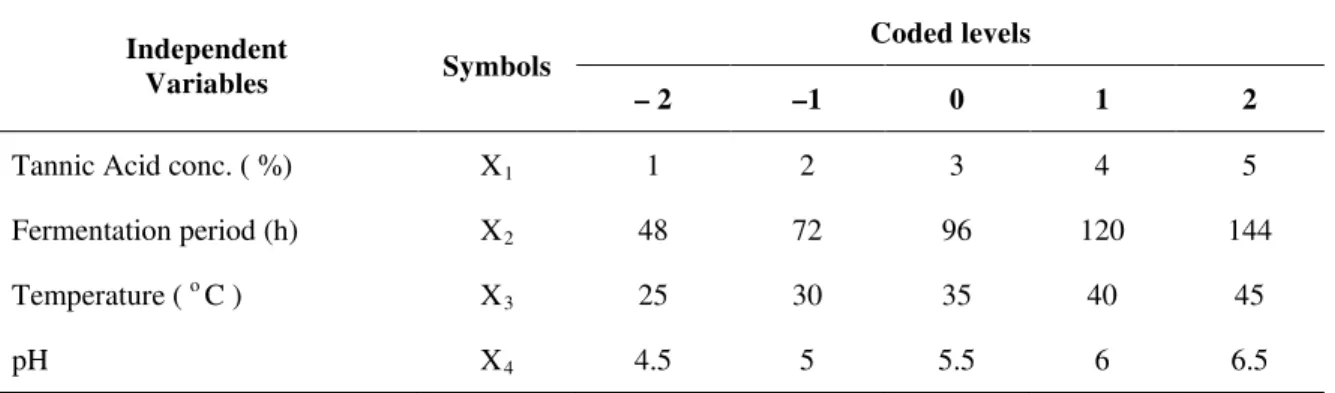
The statistical software package “Design Expert 7.1.5” was used to analyze the experimental data. All variables were taken at a central coded value of zero. The minimum and maximum ranges of variables investigated are listed in Table 1. Upon the completion of experiments, the average maximum tannase activity was taken as the response (Y). A multiple regression analysis of the data was carried out for obtaining an empirical model that relates the response measured to the independent variables.
which enhances the tannase enzyme production. The four independent variables were studied at five different levels (Table 1), and sets of thirty one experiments were carried out (Table 2).
A second-order polynomial equation is
� =�0+� ����
� �=1
+� �����2
� �=1
+ � � �����
� �=2
�� �−1
�=1,�<�
Where Y is the measured response, β0is the intercept term, βi are linear coefficients, βiiare quadratic coefficient, βij
are interaction coefficient and Xi and Xj
Where x
are coded independent variables. When developing the regression equation, the test factors were coded according to the following equation:
��=��− �0
��� − − − − (2)
iis the coded value of the ith independent variable, Xithe actual value of the ith independent variable, X0 the
real value of the ith independent variable at the center point, and �Xi
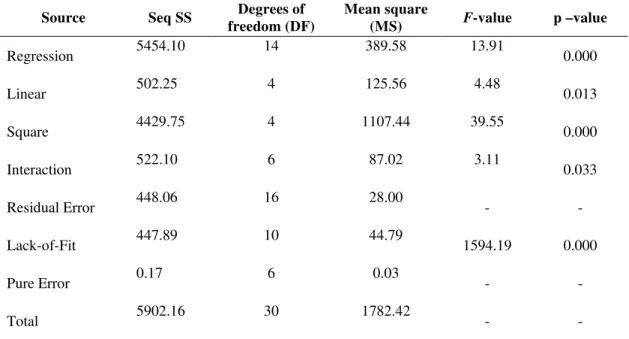
Statistical analysis of the data was performed by design package Design Expert 7.1.5 to evaluate the analysis of variance (ANOVA) to determine the significance of each term in the equations fitted and to estimate the goodness of fit in each case. The fitted polynomial equation was then expressed in the form of three-dimensional response surface plots to illustrate the main and interactive effects of the independent variables on the dependent ones. The combination of different optimized variables, which yielded the maximum response, was determined to verify the validity of the model. In order to verify the accuracy of the predicted model an experiment was conducted with optimized media.The optimal concentrations of the critical variables were obtained by analyzing 3D plots. The statistical analysis of the model was represented in the form of analysis of variance (ANOVA).
is the value of step change.
RESULTS AND DISCUSSION
The effect of various process parameters namely tannic acid concentration, fermentation period,
temperature and PH on tannase enzyme activity in submerged fermentation using Aspergillus flavus was studied by
conducting experiments with substrate redgram husk and optimized withCentral Composite Design of RSM. Thirty
one experiments were performed at different combinations of the factors shown in Table 1. The predicted and observed responses along with design matrix were presented in Table 2, and the results were analyzed by ANOVA. The second-order regression equation provides the tannase activity as the function of tannic acid concentration,
fermentation period, temperature and PH
Y = 139.54 – 87.47X
which can be presented in terms of coded factors as in the following equation:
1+0.71X2 - 2.71X3+1.57X4+3.8854 X4 – 97.40 X12 – 29.04 X22 – 28.59 X32 – 25.18
X42 +0.808 X1 X2 – 0.780 X1 X3 + 1.632 X1 X4 + 3.042 X2X3 – 3.695 X2X4 - 2.408 X3 X4
Where Y is the tannase activity (U/ml) produced as a function of the coded levels of Tannic acid concentration (X --- (3)
1),
Fermentation period (X2), Temperature (X3) and pH (X4
Based on the experimental response, the quantity of tannase enzyme produced by A.flavus ranged from
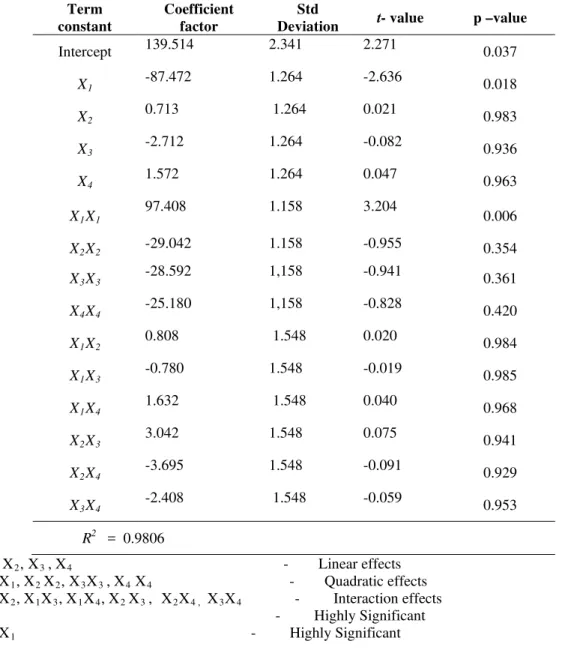
93.20 U/ml to 149.8 U/ml. The Analysis of Variance (ANOVA) for tannase production was given in the Table 3. Values of “Prob>F” less than 0.05 indicate the model terms were significant. Values greater than 0.1 indicate the model terms were not significant. In the present work, the linear effect of tannic acid concentration and square effect of tannic acid concentration were found to be significant for maximum tannase enzyme production. The coefficient of determination (R
).
2
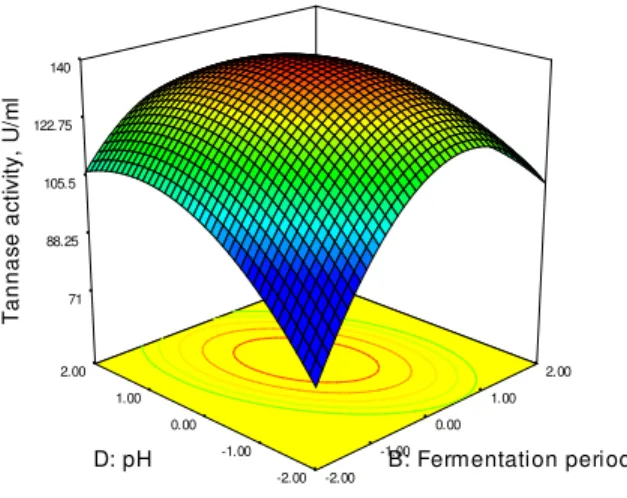
The interaction effects of variables on the tannase production were studied by plotting response surface curves against two independent variables, while keeping the other variable at its central (0) level. Fig.1 – Fig. 6 represent the response surface plots for the tannase enzyme production during batch submerged fermentation.
) for the tannase activity was calculated as 0.9806, which is close to 1 and can account for up to 98.06% of the variability of the response.
The effect of fermentation period and tannic acid concentration by fixing other two variables at central points namely temperature and pH on tannase activity is shown in Fig.1. As the tannic acid concentration was increased upto 2.8% (w/v), the tannase activity was found to increase and thereafter tannase activity was decreased with a further increase in tannic acid concentration. The optimum concentration of 2.8% tannic acid obtained in the
present investigation was in agreement with previous report of Bradoo et al [3].Fig.2 shows the dependency of
tannase activity on temperature and tannic acid concentration. The tannase activity was increased with increase in temperature to about 34°C and thereafter tannase activity was decreased with further increase in temperature. Kar et al [8] and Lekha and Lonsane [10] obtained similar values for the incubation temperature using response surface
methodology for tannase production from Rhizopus oryzae and Aspergillus niger PKL 104, respectively. Fig.3 and
Fig.5 show three dimensional response surface plots obtained with various values of pH and tannic acid
concentration at the fixed temperature of 35oC and fermentation period at 96h. As can be seen from Fig 3 and Fig 5
thereafter tannase activity was decreased with further increase in fermentation period. The same trend was observed in Fig.6. A similar optimal pH 5.5 and optimal incubation period 120hr have been reported for tannase from
Paecilomyces variotii [4]. The optimum conditions for the maximum production of tannase were determined by
response surface analysis and also estimated by regression equation.
The optimum conditions for the maximum production of tannase were found to be the tannic acid concentration of 2.8 % (w/v), fermentation period of 95 h, temperature of 34 °C and pH of 5.65. The coefficient of
regression (R2
CONCLUSIONS
) value of 0.9806 indicates that the predicted values closely agree with the experimental values.
The response surface methodology was effectively applied for the production of tannase from Aspergillus
flavus (MTCC 3783),using redgram husk as a substrate in submerged fermentation. Central Composite Design was
employed to evaluate the effects of tannic acid concentration, fermentation period, temperature and pH on
production of tannase by Aspergillus flavus. Using the above optimized process parameters and fermentation
conditions, Maximum tannase activity of 143.5 U/ml was obtained at the tannic acid concentration of 2.8% (w/v), temperature of 34ºC, pH of 5.65, and fermentation period of 95h. The statistical Design Of Experiment (DOE) offers efficient methodology to identify the significant variables and to optimize the factors with minimum number of
experiments for maximum tannase production by Aspergillus flavus.
ACKNOWLEDGMENT
The authors gratefully acknowledge the Bioprocess Research Laboratory, Department of Chemical Engineering, Annamalai University for providing the necessary facilities for the successful Completion of this research work.
REFERENCES
[1] R.Belmares , J.C.Contreras-Esquivel, R. Rodrı́guez-Herrera , A.R. Coronel , C.N. Aguilar. Microbial production of tannase: an enzyme with potential use in food industry. LWT - Food Sci Technol. ,2004, 37(8):857-64.
[2] T.K.Bhat, B.Singh and O.P.Sharma.Microbial degradation of tannins—a current perspective. Biodegradation , 1998, 25: 343–357 . [3] S.Bradoo, R.Gupta, R.K. Saxena. Parametric optimization and biochemical regulation of extracellular tannase from Aspergillus japonicus.
Process Biochem., 1997, 32:135–139.
[4] V.Battestin, G.A. Macedo. Tannase production by Paecilomyces variotii. Bioresource Technol., 2007, 98: 1832–1837.
[5] J.Cordova, M.Guiterrz-Rojas, S.Huerta, G.Saucedo-Castaneda and E.Favela-Torres. Biomass estimation of Aspergillus niger growing on real and model supports in solid state fermentation. Biotechnol. Tech.,1996. 10:1-6.
[6] M.T.Garcia-Conesa, S. Kauppinen, G. Williamson. Hydrolysis of diethyl diferulates by a tannase from Aspergillus oryzae: breaking cross-links between plant cell wall polymers. Carbohydr Polym 2001, 44(4):319–324.
[7] K.Jatinder , B.S. Chadha and H.S. Saini. Optimization of culture conditions for production of cellulases and xylanases by Scytalidium thermophilum using Response Surface Methodology. World J Microb Biot., 2006, 22: 169–176.
[8] B.Kar, R. Banerjee and B.C. Bhattachaaryya. Optimization of physicochemical parameters for gallic acid production by evolutionary operation-factorial design techniques. Process Biochem., 2002, 37: 1395-1401.
[9] P.K.Lekha and B.K.Lonsane. Production and application of tannin acyl hydrolase.State of the art, Advances in Applied Microbiology., 1997, 44: 215–260.
[10] P.K.Lekha and B.K. Lonsane. Comparative titres, location and properties of tannin acyl hydrolase produced by Aspergillus niger PKL 104 in solid-state, liquid surface and submerged fermentations. Process Biochem., 1994.29: 497-503.
[11] K.C.Mondal , D. Banerjee ,M. Jana and B.R.Pati.Calorimetric assay method for determination of the tannase activity, Analytical Biochemistry.,2001, 295: 168-171.
[12] Mohan Kuppusamy, Viruthagiri Thangavelu and Suresh Baladhandayutham.Production of Tannase using Aspergillus niger by Submerged fermentation, International Journal of Science and Engineering Applications.,2012, 1(2):138-142.
[13] S.Raghuwanshi ,K. Dutt, P.Gupta ,S. Misra and R.K. Saxena . Bacillus sphaericus: The highest bacterial tannase producer with potential for gallic acid synthesis. J. Biosci Bioeng., 2011.11: 635–640.
[14] H.Rodríguez , B. Rivas , C. Gomez-Cordoves C and R.Munoz . Degradation of tannic acid by cell- free extracts of Lactobacillus plantarum. Food Chem., 2008.107: 664–670.
[15] S.Sharma, L.Agarwal, R.K.Saxena. Statistical optimization for tannase production from Aspergillus niger under submerged fermentation. Indian Journal of Microbiology., 2007.47(2):132-138.
Figure Legends
Fig 1: Three dimensional Plot showing the effect of Fermentation period and Tannic acid concentration on tannase activity.
Fig 2: Three dimensional Plot showing the effect of Temperature and Tannic acid concentration on tannase activity. Fig 3: Three dimensional Plot showing the effect of pH and Tannic acid concentration on tannase activity.
Fig 4: Three dimensional Plot showing the effect of Temperature and Fermentation period on tannase activity. Fig 5: Three dimensional Plot showing the effect of pH and Fermentation period on tannase activity.
Table 1 Coded and actual levels of the independent variables for the design of experiment for tannase production using Aspergillus flavus on Redgram Husk
Independent
Variables Symbols
Coded levels
– 2 –1 0 1 2
Tannic Acid conc. ( %) X1 1 2 3 4 5
Fermentation period (h) X2 48 72 96 120 144
Temperature ( o C ) X3 25 30 35 40 45
pH X4 4.5 5 5.5 6 6.5
Table 2:Five level Central Composite Rotatable Design (CCRD) and the experimental responses of dependent variable of tannase activity (U/ml) by Aspergillus flavus using Redgram Husk
Run No. X1 X2 X3 X
Tannase Activity, U/ml
4 Experimental Predicted
1 1 -1 -1 -1 97.98 104.45
2 0 0 2 0 109.70 103.93
3 0 0 0 0 139.50 139.51
4 -1 -1 1 -1 105.40 109.14
5 -1 1 -1 -1 109.40 115.40
6 1 1 1 1 101.40 106.91
7 0 0 -2 0 117.40 114.79
8 2 0 0 0 111.50 101.55
9 0 -2 0 0 110.20 106.14
10 -1 -1 -1 1 123.60 126.36
11 1 -1 1 -1 93.20 96.19
12 0 0 0 0 139.60 139.51
13 -1 1 1 1 108.60 110.11
14 1 1 1 -1 107.50 112.71
15 0 0 0 0 139.60 139.51
16 1 1 -1 1 108.40 112.63
17 -2 0 0 0 113.00 114.57
18 -1 -1 -1 -1 119.40 114.28
19 1 -1 1 1 103.20 105.18
20 -1 1 -1 1 115.30 112.70
21 -1 -1 1 1 110.50 111.60
22 1 1 -1 -1 109.50 108.80
23 0 0 0 0 139.70 139.51
24 0 0 0 2 130.50 126.15
25 0 0 0 0 139.60 139.51
26 1 -1 -1 1 120.50 123.06
27 -1 1 1 -1 124.60 122.43
28 0 0 0 -2 123.90 119.86
29 0 0 0 0 139.40 139.51
30 0 0 0 0 139.20 139.51
Table 3: Regression analysis and corresponding t and p- value of second order polynomial model for the optimization of Tannase production by A.flavus using Redgram Husk
Term constant
Coefficient factor
Std
Deviation t- value p –value
Intercept 139.514 2.341 2.271 0.037
X1 -87.472 1.264 -2.636 0.018
X2 0.713 1.264 0.021 0.983
X3 -2.712 1.264 -0.082 0.936
X4 1.572 1.264 0.047 0.963
X1X
97.408
1
1.158 3.204
0.006
X2X2 -29.042 1.158 -0.955 0.354
X3X3 -28.592 1,158 -0.941 0.361
X4X4 -25.180 1,158 -0.828 0.420
X1X2 0.808 1.548 0.020 0.984
X1X3 -0.780 1.548 -0.019 0.985
X1X4 1.632 1.548 0.040 0.968
X2X3 3.042 1.548 0.075 0.941
X2X4 -3.695 1.548 -0.091 0.929
X3X4 -2.408 1.548 -0.059 0.953
R2 = 0.9806
X1, X2,X3 , X4
X
- Linear effects
1 X1, X2 X2,X3X3 , X4 X4
X
- Quadratic effects
1 X2, X1X3, X1X4, X2 X3 , X2X4 , X3X4
X
- Interaction effects
1
X
- Highly Significant
Table 4 : Analysis of variance (ANOVA) for the quadratic polynomial model for Tannase production by Aspergillus flavus using Redgram Husk
Source Seq SS Degrees of
freedom (DF)
Mean square
(MS) F-value p –value
Regression 5454.10 14 389.58 13.91 0.000
Linear 502.25 4 125.56 4.48 0.013
Square 4429.75 4 1107.44 39.55 0.000
Interaction 522.10 6 87.02 3.11 0.033
Residual Error 448.06 16 28.00 - -
Lack-of-Fit 447.89 10 44.79 1594.19 0.000
Pure Error 0.17 6 0.03 - -
Total 5902.16 30 1782.42 - -
Fig 1: Three dimensional Plot showing the effect of Fermentation period and Tannic acid concentration on tannase activity. -2.00
-1.00 0.00
1.00 2.00
-2.00 -1.00 0.00 1.00 2.00
64 83 102 121 140
T
ann
as
e ac
ti
v
it
y
, U
/m
l
Fig 2: Three dimensional Plot showing the effect of Temperature and Tannic acid concentration on tannase activity.
Fig 3: Three dimensional Plot showing the effect of pH and Tannic acid concentration on tannase activity. -2.00
-1.00 0.00
1.00 2.00
-2.00 -1.00 0.00 1.00 2.00
62 81.75 101.5 121.25 141
T
ann
as
e ac
ti
v
it
y
, U
/m
l
A: T annic acidconcentratio C: T emperature, 0C
-2.00 -1.00
0.00 1.00
2.00
-2.00 -1.00 0.00 1.00 2.00
75 91.25 107.5 123.75 140
T
ann
as
e ac
ti
v
it
y
, U
/m
l
Fig 4: Three dimensional Plot showing the effect of Temperature and Fermentation period on tannase activity.
Fig 5: Three dimensional Plot showing the effect of pH and Fermentation period on tannase activity. -2.00
-1.00 0.00
1.00 2.00
-2.00 -1.00 0.00 1.00 2.00
58 78.5 99 119.5 140
T
ann
as
e ac
ti
v
it
y
, U
/m
l
B: Fermentation period, C: T emperature, 0C
-2.00 -1.00
0.00 1.00
2.00
-2.00 -1.00 0.00 1.00 2.00
71 88.25 105.5 122.75 140
T
ann
as
e ac
ti
v
it
y
, U
/m
l
Fig 6: Three dimensional Plot showing the effect of pH and Temperature on tannase activity. -2.00
-1.00 0.00
1.00 2.00
-2.00 -1.00 0.00 1.00 2.00
80 95.25 110.5 125.75 141
T
ann
as
e ac
ti
v
it
y
, U
/m
l