Maejo International
Journal of Science and Technology
ISSN 1905-7873
Available online at www.mijst.mju.ac.th Full Paper
Statistical optimisation of culture conditions for biocellulose
production by
Komagataeibacter
sp. PAP1 using soya bean
whey
Amornrat Suwanposri1, Pattaraporn Yukphan2, Yuzo Yamada3 and Duangjai Ochaikul1, *
1 Department of Biology, Faculty of Science, King Mongkut’s Institute of Technology Ladkrabang, Chalongkrung Rd. Ladkrabang, Bangkok, 10520, Thailand
2 BIOTEC Culture Collection (BCC), Bioresources Technology Unit, National Centre for Genetic Engineering and Biotechnology, National Science and Technology Development Agency,
Phaholyothin Road, Klong 1, Klong Luang, Pathumthani 12120, Thailand 3 Shizuoka University, 836 Ohya, Suruga-ku, Shizuoka 422-8529, Japan
* Corresponding author, e-mail: [email protected]; [email protected]
Received: 6 March 2013 / Accepted: 14 January 2014 / Published: 15 January 2014
Abstract: A low-cost medium based on soya bean whey (SBW) was prepared as a by-product from agriculture and optimised for biocellulose (BC) production by Komagataeibacter sp. PAP1. The optimal conditions for BC production are: pH 6.21, 1.61% ethanol concentration (v/v) and 28.4oC. The use of optimised medium based on SBW increased BC production 3.6 fold compared to standard Hestrin-Schramm (HS) medium. The BC film produced from the optimised medium was stronger and more impermeable to water vapour and oxygen compared to the one produced from the standard HS medium. These properties allow SBW film to be developed into eco-friendly food packaging for oxygen-sensitive products. Its high water absorption capacity allows its use in biomedical application such as wound dressing. Our results demonstrate that SBW can be used as an alternative low-cost substrate for BC production on commercial scale.
Keywords: biocellulose, bacterial cellulose, soya bean whey, Komagataeibacter
_______________________________________________________________________________________
INTRODUCTION
amount of liquid waste with high biological oxygen demand (BOD) and chemical oxygen demand (COD) that causes severe environmental pollution [1]. Hence, researchers are interested in developing biotechnological processes to produce cellulose from alternative sources such as micro-organisms.
Bacterial cellulose or biocellulose (BC) is an extracellular cellulose produced by some acetic acid bacteria in the genus Komagataeibacter (formerly Gluconacetobacter) [2] such as K. xylinus, K. nataicola, K. hansenii and K. swingsii [3-5]. BC has high purity and has been considered as an alternative source of cellulose because of its clear advantages compared to PC in microfibrillar nanostructure, high mechanical strength, high elasticity, conformability, thermal stability, high water and liquid absorption, low toxicity, excellent biological affinity, and biodegradability [6-8]. Additionally, compared to PC, isolation and purification of BC is relatively simple and does not need intense chemical processes with high waste production. These unique qualities have attracted much attention to the use of BC as an alternative material in several special applications such as functionalised paper sheets, fire retarding agent, wound dressing for severely damaged skin and electronic paper [9-11]. However, BC is currently priced higher than PC. A promising approach to reduce the cost of production of BC and maximise its yield is optimisation of culture conditions and use of agricultural by-products or waste as substrate.
Soya bean whey (SBW) is a pale yellow liquid by-product which is produced from the pressing of coagulated soya bean milk in tofu production. SBW is 79-90% of soya bean milk [12] and has a high BOD (13,730 ppm) after 5 days of incubation [13]. It is a rich source of nutrient containing protein, starch, fat and sugars such as glucose, fructose, sucrose, raffinose and stachyose [14], which can be utilised as substrate for microbial fermentation [12]. Many studies have shown that SBW can be used as an inexpensive substrate in the production of peptide-enriched functional food, fungal mycelial protein and nisin, a high-value food preservative [12, 15, 16]. A few studies have reported of its use in BC production by Komagataeibacter sp. [17-19].
The microbial productivity of BC depends on culture conditions such as the composition of the medium (carbon, nitrogen and supplementary substances), pH, temperature and cultivation method [20]. It is difficult to determine the most important factors and to optimise the culture condition. One-factor-at-a-time is a conventional method for medium optimisation. It is time-consuming and expensive, and often leads to misinterpretation of results when interactions between different components take place [6]. Statistical experimental design has been applied to minimise error in determining the effect of parameters and it indicates the simultaneous, systematic and efficient variation of all parameters [21]. Response surface methodology (RSM) is a collection of mathematical and powerful statistical technique commonly used to determine the optimal culture conditions for multiple variables with a minimum number of experiments [22]. This technique had been successfully applied for designing media in the production of probiotics, bacterial cellulose, enzymes, organic acids and antibiotics [23-26].
MATERIALS AND METHODS Bacterial Strain and Raw Material
Komagataeibacter sp. PAP1 was used as BC producer. The bacterium was isolated from rotten papaya (Carrica papaya) and identified by morphological, physiological and biochemical characterisations as well as 16S rRNA gene sequence analysis [27]. The isolate could utilise almost all general carbon sources and gave the maximum BC yield in the standardHS medium [3] containing 2% (w/v) mannitol (3.50 g/L) or ethanol (3.43 g/L) as the sole carbon source. Optimal growth was obtained at 25-30oC, pH 4.5-7.0 and colonies appeared on a standard HS agar plate after 2-3 days [27].
For long-time storage of the isolate, glycerol stocks of the micro-organism were prepared in a medium containing 2.5% (w/v) glucose, 0.5% (w/v) peptone, 0.3% (w/v) yeast extract and 20% (v/v) glycerol, and maintained at -80oC until further use.
SBW was provided by a small tofu processing factory in Ladkrabang district, Bangkok, and kept at -10oC. Moisture content, protein content, fat, ash, total carbohydrate and lactose in SBW were analysed using standard methods according to AOAC [28]. The pH of SBW was measured using a pH meter (Cyberscan pH 2000, Utech Cybernetics, Singapore).
Preparation of Starter Culture
Komagataeibacter sp. PAP1 was cultivated on standard HS agar at 30oC for 48 hr. Two loopfuls of the bacterium were transferred into 300 mL of a sterilised starter medium in a 500-mL Erlenmeyer flask. The starter medium consisted of 5% (w/v) sucrose, 1% (w/v) ammonium sulfate and 0.1% (v/v) acetic acid. The volume of the starter medium was adjusted to 300 mL using SBW and the pH of the medium adjusted to 4.5 using 6N NaOH. The starter culture was carried out statically at 30oC for 48 hr.
Production of BC Using Medium Based on SBW
The filtered SBW was adjusted to different pHs by glacial acetic acid and 6N NaOH. Subsequently, it was sterilised at 110oC for 20 min. and then supplemented with different volumes of sterilised ethanol according to each experimental run (Table 1). The BC production was performed in 250-mL Erlenmeyer flasks containing 90 mL of the medium based on SBW (Table 2). Each flask was inoculated with 10 mL of the starter culture and incubation was done at different temperatures for 7 days under static condition. BC pellicles formed were washed three times with distilled water, treated with 2% (w/v) NaOH and sterilised at 121oC for 15 min.to eliminate residual bacterial cells and medium components. Purified cellulose pellicles were washed again thrice with distilled water and dried in a hot air oven at 65oC until constant weight was obtained. The BC production yield was expressed as dry weight of BC per volume of culture medium (g/L).
Experimental Design and Statistical Analysis
Xi = (Ai-Ac)/∆Ai (1) where Xi is the independent variable code value; Ai, the independent variable actual value in the original units; Ac, the independent variable actual value at the centre point in the original units; and ∆Ai, the step change in the original units.
Table 1. Code levels and the actual values of the factors of the three independent variables at five levels of CCD
Independent variable Code Actual value of factor at CCD level of: - (-1.682) -1 0 +1 + (+1.682)
Initial pH of culture medium X1 2.64 4 6 8 9.36
Ethanol concentration (% v/v) X2 0 0.75 2 3.25 4.10
Incubation temperature (oC) X3 21.6 25.0 30.0 35.0 38.4
Six replications were performed at the centre point and the number of experimental runs was calculated from the equation [30]:
N = 2k + 2k + c (2) where N is the number of experimental run; k, the number of independent variable; and c, the number of replication at the centre point.
The response data (yield of BC) from each experimental run was analysed by multiple linear regression using the PASW Statistics software (Version 18.0). Based on these results, a regression model was developed to predict the effect of combined variables on BC production by Komagataeibacter sp. PAP1. The responses can be predicted by the following second-order polynomial regression equation[29]:
Y = B0 + B1(pH) + B2(E) + B3(T) + B11(pH)2 + B22(E)2 + B33(T)2 + B12(pH*E) + B13(pH*T) + B23(E*T) (3) where Y is the predicted response (yield of BC, g/L); B0, the intercept term; B1-B3, the linear coefficients; B11, B22, B33, the quadratic coefficients; B12, B13, B23, the cross product coefficients; and pH, E and T, the initial pH of culture medium, ethanol concentration (% v/v) and incubation temperature (oC) respectively. The quality of fit of the model was tested by an analysis of variance (ANOVA) and the coefficient of determination (R2). A value of R2 > 0.75 indicates aptness of the
model [29]. The response surface and contour plots were constructed with Statistica software (trial version) to indicate an optimal condition using the fitted second-order polynomial equations obtained by holding one of the independent variables constant and changing the levels of the other two variables [31].
Growth and BC Production under Optimal Conditions
Colonies were counted after three days of incubation using aReichert Darkfield Quebec colony counter (Model 13332600, Reichert Analytical Instruments Inc., USA).
Comparison of BC Production in Optimised SBW Medium and Standard HS Medium
Ten mL of the 48-hr starter culture were transferred to a 250-mL Erlenmeyer flask containing 90 mL of optimised medium based on SBW or standard HS medium, 2% (w/v) glucose, 0.5% (w/v) yeast extract, 0.5% (w/v) peptone, 0.27% (w/v) disodium hydrogen phosphate and 0.12% (w/v) citric acid (pH of mixture = 6.0). The culture was incubated statically for 7 days at an optimal temperature for the optimised medium based on SBW, or at 30oC for standard HS medium. After incubation, the yields of BC from each culture medium were analysed.
Preparation of BC Film
The BC samples produced in both media were immersed in 0.5% (v/v) ammonium hydroxide overnight and washed thrice with tap water. Subsequently, the BC pellicles were boiled for 30 min. to remove ammonium hydroxide and washed thrice again with tap water [33]. The pellicles were squeezed to remove water using a pressing machine and then dried at 65oC for 3 hr. Characterisation of BC Film
Mechanical properties
The BC films were examined for tensile strength, Young’s modulus and elongation at break using a universal testing machine (TA plus, Lloyd Instruments Ltd., England) at a test speed of 0.25 mm/min. according to Thai Industrial Standard (TIS. 1353) [34]. Rectangular specimens for measurements were cut from samples with a gauge length of 30 mm. Five specimens were made to average the results.
Water vapour transmission rate
The water vapour transmission rate was analysed using a Lyssy L 80-4000 water vapour permeation tester (Lyysy AG, Switzerland), and test conditions followed ASTM E398-13 [35] in the humidity detection sensor method.
Oxygen gas transmission rate
The oxygen gas transmission rate was determined using an Illinois 8008 oxygen permeation tester (Illinois Instruments Inc., USA), and test conditions followed the procedure of ASTM D3985-05 [36] in the coulometric sensor method.
Water absorption capacity
The water absorption capacity was examined using the procedure of ASTM D570-98 [37]. Each dried sample (2.54 × 7.62 cm) was immersed in distilled water at 23oC until equilibrium. The swollen sample was removed from water and excess water at the surface was wiped off. The sample was weighed and the water absorption capacity (%) was calculated (= (wet weight – dry weight)/dry weight × 100).
Colour analysis
the lightness with a scale from 0 (black) to 100 (white); and a* and b* are the colour directions: +a*, red direction; –a*, green direction; +b*, yellow direction; and –b*, blue direction.
Scanning electron microscopy
The BC samples produced in both culture media were cut and coated with gold (Fine coater, model JEC-12000, JEOL Ltd., Japan). A scanning electron microscope (JSM S410, JEOL Ltd., Japan) was used at 5 KV for sample examination with 5,000× and 30,000× magnifications.
Statistical analysis
Comparison of BC yields from optimised medium based on SBW versus standard HS medium was statistically analysed by student’s t-test using PASW Statistics software (Version 18.0).
RESULTS AND DISCUSSION
Optimisation of Medium Based on SBW
In this study, SBW consisted of 98.87% moisture, 0.34% protein, 0.02% fat, 0.51% ash, 0.26% total carbohydrate and 0.02% lactose (pH 4.5). In general, the medium composition and environmental factors affect bacterial cell growth and product formation [20]. Three main fermentation factors, namely initial pH of culture medium (X1), concentration of carbon source (X2) and incubation temperature (X3), were chosen for the optimisation of BC production by Komagataeibacter sp. PAP1 in SBW. In our previous study [27], mannitol and ethanol gave the highest BC yield, but on cost consideration ethanol was selected as carbon source in this study. CCD was used to identify the optimal condition for the medium. The experimental design and BC yields obtained from different treatment combinations for BC production are summarised in Table 2. BC yields were determined using multiple regression analysis with p 0.05 and used to generate second-order regression model capable of predicting the amounts of BC yield (Y) as a function of the three independent variables. The derived regression equation (2) for the optimisation of the medium based on SBW becomes:
Y = 3.946372 + 0.077053 (pH) + 0.163093 (E) - 0.483914 (T) - 0.730344 (pH)2 - 0.609879 (E)2 - 0.791462 (T)2 - 0.054291 (pH*E) - 0.099458 (pH*T) + 0.141458 (E*T) (4)
The quality of fit of the quadratic polynomial equation was examined using R2 and
probability (p) values. The R2 value was found by calculation to be 0.835, indicating that 83.50% of
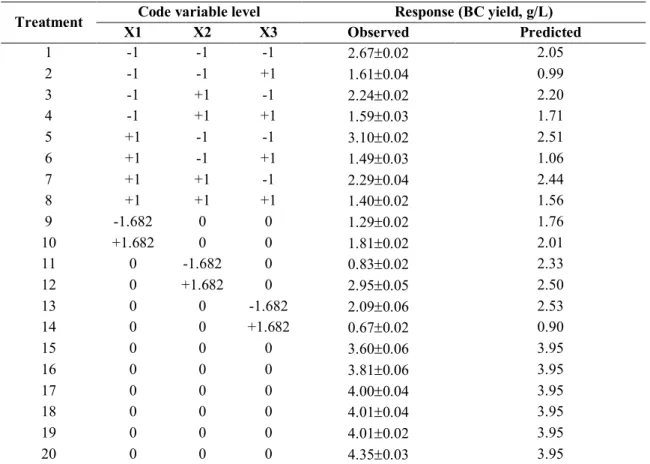
Table 2. Experimental design and results of BC yield using central composite design
Treatment X1 Code variable level X2 X3 Observed Response (BC yield, g/L) Predicted
1 -1 -1 -1 2.670.02 2.05
2 -1 -1 +1 1.610.04 0.99
3 -1 +1 -1 2.240.02 2.20
4 -1 +1 +1 1.590.03 1.71
5 +1 -1 -1 3.100.02 2.51
6 +1 -1 +1 1.490.03 1.06
7 +1 +1 -1 2.290.04 2.44
8 +1 +1 +1 1.400.02 1.56
9 -1.682 0 0 1.290.02 1.76
10 +1.682 0 0 1.810.02 2.01
11 0 -1.682 0 0.830.02 2.33
12 0 +1.682 0 2.950.05 2.50
13 0 0 -1.682 2.090.06 2.53
14 0 0 +1.682 0.670.02 0.90
15 0 0 0 3.600.06 3.95
16 0 0 0 3.810.06 3.95
17 0 0 0 4.000.04 3.95
18 0 0 0 4.010.04 3.95
19 0 0 0 4.010.02 3.95
20 0 0 0 4.350.03 3.95
Table 3. Analysis of variance (ANOVA) of BC yields
Source SS DF MS F-value p-value
Model 67.073 9 7.453 34.154 0.000
Residual 10.910 50 0.218
Total 77.983 59
Note: SS = Sum of square, DF = Degree of freedom, MS = Mean square
R2 = 0.835
Table 4. Analysis of variance (ANOVA) of effects of three independent variables on BC yields
Code Coefficient t- value p-value
Constant 3.946 35.880 .000
X1 .077 1.055 .296
X2 .163 2.234 .030
X3 -.484 -6.628 .000
X1X2 -.054 -.569 .572
X1X3 -.099 -1.043 .302
X2X3 .141 1.484 .144
X1X1 -.730 -10.264 .000
X2X2 -.610 -8.571 .000
X3X3 -.791 -11.123 .000
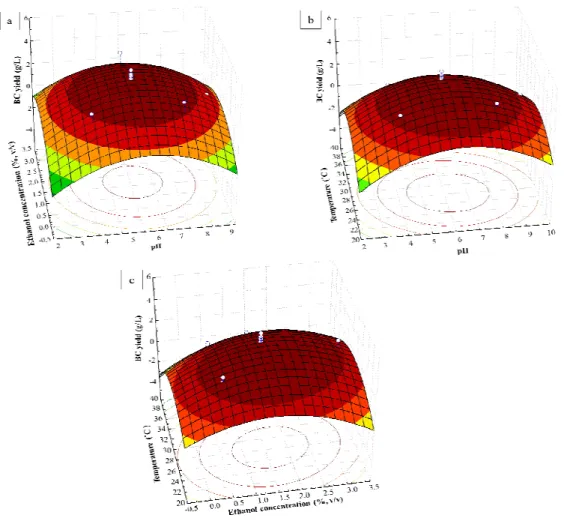
The second-order regression model was used to develop response surface plots (Figure 1). Figure 1a shows the response surface curve of BC production as a function of initial pH of the culture medium and ethanol concentration by keeping the incubation temperature at 30oC (central level). The BC yield increases with elevated pH and ethanol concentration up to 6 and 2% respectively. Further increase in both variables leads to opposite effects. Maximum BC production of 3.30 g/L is obtained at pH 6.21 and 1.61% ethanol.
Figure 1b shows the response surface curve of BC production as a function of initial pH and incubation temperature by keeping the concentration of ethanol at 2% (central level). The BC yield increases with incubation temperature up to 30oC (central level) and then decreases. The maximum BC yield of 3.53 g/L is obtained at initial pH of 6.21 and incubation temperature of 28.4oC.
Figure 1c shows the effect of ethanol concentration and incubation temperature on BC yield at initial pH 6 (central level). The BC yield increases with ethanol concentration and temperature up to 2% and 30oC respectively, and then decreases. The maximum BC yield of 3.42 g/L is obtained at 1.61% ethanol and 28.4oC. Based on Equation (4), the optimal values of initial pH, ethanol concentration and incubation temperature are 6.21, 1.61% and 28.4oC respectively, with a maximum BC yield of 4.03 g/L.
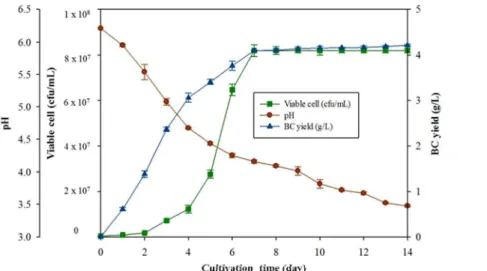
To verify the predicted response, Komagataeibacter sp. PAP1 was cultivated in the optimised medium based on SBW under static condition for 14 days. As shown in Figure 2, bacterial cells of isolate PAP1 increased rather slowly during the first two days and then increased exponentially from the third to seventh day. A stationary phase was observed after seven days of cultivation, and the viable cell count reached a maximum value of 8.2 × 10⁷ cfu/mL. The production of BC began from the first day of cultivation and increased rapidly from the third day. A maximum BC production of 4.10 g/L was obtained on the seventh day of cultivation, after which it stabilised. This result shows that BC production by Komagataeibacter sp. PAP1 is growth-associated. The pH of the culture medium decreased from 6.21 at the beginning to less than 3.50 after 14 days of cultivation. Under these conditions, the BC yield was relatively close to the predicted response (Table 2). Thus, they were used as optimal conditions in this study.
Figure 2. Growth and BC production of Komagataeibacter sp. PAP1 in optimised medium based on SBW
Comparison of BC Production
Table 5. Comparison of BC yields in two media Medium BC yield (g/L)
Optimised medium based on SBW
Standard HS medium 4.14 ± 0.02* 1.15 ± 0.03
Note: Results obtained are the mean of triplicates ± SD. Data were analysed using student’s t-test. * Highly significant (p < 0.01)
Characterisation of BC Film
Structure
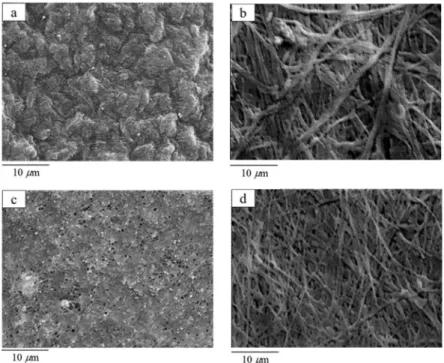
The morphology of BC film examined by scanning electron microscopy shows three-dimensional porous network structures consisting of randomly arranged ribbon-shaped ultrafine fibrils (Figure 3). The BC fibrils have transverse dimensions ranging 26-63 nm, which are smaller thanfibrils from PC [40]. The results are in accordance with previously reported BC structure [41-42]. Figures3a-b show SBW film as thicker ribbon-shaped fibrils compared to HS film (Figures 3c-d). The reticulated structure of BC is tightly combined in SBW film but loose in HS film.
Figure 3. Structure of BC film produced from optimised SBW medium with magnification 5,000× (a) and 30,000× (b), and from standard HS medium with magnification 5,000× (c) and 30,000× (d)
Mechanical properties
tensile strength and Young’s modulus values of BC films produced in this study are relatively high compared to previous reports [44-45].
Table 6. Properties of BC film
Property SBW film HS film
Tensile strength (MPa) 49.16 23.58 Young’s modulus (MPa) 2498.69 265.51 Elongation at break (%) 3.28 11.17 Water vapour transmission rate (g/m2/day) 1986 2549
Oxygen gas transmission rate (cm3/m2/day) 23.1 173
Water absorption capacity (%) 232.29 257.83
Barrier properties and water absorption
Barrier properties, viz. water vapour transmission rate and oxygen gas transmission rate, are listed in Table 6. The SBW film gives 22% lower water vapour transmission rate than does HS film and also acts as an efficient barrier to oxygen compared with HS film (23.1 vs 173 cm3/m2/day). Similar to the present study, Rani et al. [45] found the BC film produced from grape medium to be a better barrier to oxygen (415.27 cm3/m2/day) than one produced from the HS medium (1962.67 cm3/m2/day). They also found that the BC film has a higher water vapour transmission rate and lower oxygen gas transmission rate (2448.28 g/m2/day and 415.27 cm3/m2/day) when compared with a synthetic polymer (18-20 g/m2/day and 8000-1400 cm3/m2/day).
Both SBW and HS films show great water absorption property. The water absorption capacity of both kinds of film is over 2 times of their weight (Table 6). This is because BC has a three-dimensional porous network structure which can maintain a large amount of water [10, 46]. Colour appearance
Both SBW and HS films were opaque and white, as evident from the L* values being shifted slightly towards the lighter side (Table 7), suggesting that no bleaching is required for either film. The results compare well with a previous report on the utilisation of coconut water and pineapple water for BC production by Acetobacter xylinum strains [47]. The BC sheets produced from both kinds of agricultural waste exhibited a white colour and an opaque yellow colour respectively, thus needing no de-colourisation.
Table 7. Results of colour analysis of BC film
Sample CIE Lab value Standard error
L* a* b*
SBW film 57.72 0.34 -2.06 0.17 -5.49 0.06 HS film 58.56 0.10 -1.19 0.03 -5.31 0.21
CONCLUSIONS
ACKNOWLEDGEMENTS
The authors are grateful to the National Science and Technology Development Agency and King Mongkut’s Institute of Technology Ladkrabang for supporting this work.
REFERENCES
1. S. U. Pokalwar, M. K. Mishra and A. V. Manwar, “Production of cellulose by Gluconacetobacter sp.”, Rec. Res. Sci. Technol., 2010, 2, 14-19.
2. Y. Yamada, P. Yukphan, H. T. L. Vu, Y. Muramatsu, D. Ochaikul, S. Tanasupawat and Y. Nakagawa, “Description of Komagataeibacter gen. nov., with proposals of new combinations (Acetobacteraceae)”, J. Gen. Appl. Microbiol., 2012, 58, 397-404.
3. S. Hestrin and M. Schramm, “Synthesis of cellulose by Acetobacter xylinum. 2. Preparation of freeze-dried cells capable of polymerizing glucose to cellulose”, Biochem. J., 1954, 58, 345-352.
4. P. Lisdiyanti, R. R. Navarro, T. Uchimura and K. Komagata, “Reclassification of Gluconacetobacter hansenii strains and proposals of Gluconacetobacter saccharivorans sp. nov. and Gluconacetobacter nataicola sp. nov.”, Int. J. Syst. Evol. Microbiol., 2006, 56, 2101-2111.
5. C. Castro, R. Zuluaga, J. L. Putaux, G. Caro, I. Mondragon and P. Gañán, “Structural characterization of bacterial cellulose produced by Gluconacetobacter swingsii sp. from Colombian agroindustrial wastes”, Carbohydr. Polym., 2011, 84, 96-102.
6. M. Shoda and Y. Sugano, “Recent advances in bacterial cellulose production”, Biotechnol. Bioprocess Eng., 2005, 10, 1-8.
7. D. Klemm, D. Schumann, U. Udhardt and S. Marsch, “Bacterial synthesized cellulose-artificial blood vessels for microsurgery”, Prog. Polym. Sci., 2001, 26, 1561-1603.
8. P. Ross, R. Mayer and M. Benziman, “Cellulose biosynthesis and function in bacteria”, Microbiol. Molec. Biol. Rev., 1991, 55, 35-58.
9. A. H. Basta and H. El-Saied, “Performance of improved bacterial cellulose application in the production of functional paper”, J. Appl. Microbiol., 2009, 107, 2098-2107.
10. W. K. Czaja, D. J. Young, M. Kawecki and R. M. Brown Jr, “The future prospects of microbial cellulose in biomedical applications”, Biomacromolec., 2007, 8, 1-12.
11. J. Shah and R. M. Brown Jr, “Towards electronic paper displays made from microbial cellulose”, Appl. Microbiol. Biotechnol., 2005, 66, 352-355.
12. A. Singh and R. Banerjee, “Peptide enriched functional food adjunct from soy whey: a statistical optimization study”, Food Sci. Biotechnol., 2013, 22, 65-71.
13. M. Monajjemi, A. L. N. Aminin, A. R. Ilkhani and F. Mollaamin, “Nano study of antioxidant activities of fermented soy whey prepared with lactic acid bacteria and kefir”, Afr. J. Microbiol. Res., 2012, 6, 426-430.
14. W. Y. Fung, Y. P. Woo and M. T. Liong, “Optimization of growth of Lactobacillus acidophilus FTCC 0291 and evaluation of growth characteristics in soy whey medium: A response surface methodology approach”, J. Agric. Food Chem., 2008, 56, 7910-7918.
15. D. Mitra, A. L. Pometto III, S. K. Khanal, B. Karki, B. F. Brehm-Stecher and J. H. van Leeuwen, “Value-added production of nisin from soy whey”, Appl. Biochem. Biotechnol.,
16. H. Falanghe, A. K. Smith and J. J. Rackis, “Production of fungal mycelial protein in submerged culture of soybean whey”, Appl. Microbiol., 1964, 12, 330-334.
17. X. Lu, Y. Qian and T. Yan, “Bacterial cellulose production by soybean whey based medium”, KMITL Sci. J., 2004, 4, 100-107.
18. X. Lu, Y. Qian and L. X. Dong, “Application of bacterial cellulose to low-fat sausage”, Food Sci., 2005, 26, 272-274.
19. S. Photisarach, “Optimization of bacterial cellulose production from Acetobacter xylinum Agr60 cultured in tofu whey”, Master Thesis, 2011, Chiang Mai University, Thailand.
20. P. R. Chawla, I. B. Bajaj, S. A. Survase and R. S. Singhal, “Microbial cellulose: fermentative production and applications”, Food Technol. Biotechnol., 2009, 47, 107-124.
21. B. N. Gawande and A. Y. Patkar, “Application of factorial designs for optimization of cyclodextrin glycosyltransferase production from Klebsiella pneumoniae AS-22”, Biotechnol. Bioeng., 1999, 64, 168-173.
22. G. E. P. Box and J. S. Hunter, “Multi-factor experimental designs for exploring response surfaces”, Ann. Math. Statist., 1957, 28, 195-241.
23. A. Jagannath, A. Kalaiselvan, S. S. Manjunatha, P. S. Raju and A. S. Bawa, “The effect of pH, sucrose and ammonium sulphate concentrations on the production of bacterial cellulose (nata-de-coco) by Acetobacter xylinum”, World J. Microbiol. Biotechnol., 2008, 24, 2593-2599. 24. Q. K. Beg, V. Sahai and R. Gupta, “Statistical media optimization and alkaline protease
production from Bacillus mojavensis in a bioreactor”, Process Biochem., 2003, 39, 203-209. 25. K. Adinarayana, P. Ellaiah, B. Srinivasulu, R. B. Devi and G. Adinarayana, “Response surface
methodological approach to optimize the nutritional parameters for neomycin production by Streptomyces marinensis under solid-state fermentation”, Process Biochem., 2003, 38, 1565-1572.
26. S. Barrington and J. W. Kim, “Response surface optimization of medium components for citric acid production by Aspergillus niger NRRL 567 grown in peat moss”, Bioresour. Technol.,
2008, 99, 368-377.
27. A. Suwanposri, P. Yukphan, Y. Yamada and D. Ochaikul, “Identification and biocellulose production of Gluconacetobacter strains isolated from tropical fruits in Thailand”, Maejo Int. J. Sci. Technol., 2013, 7, 70-82.
28. W. Horwitz and G. W. Latimer Jr. (Ed.), “Official Methods of Analysis of AOAC International”, 18th Edn., Gaithersburg (MD), 2005, pp.59-61.
29. A. Pal and F. Khanum, “Production and extraction optimization of xylanase from Aspergillus niger DFR-5 through solid-state-fermentation”, Bioresour. Technol., 2010, 101, 7563-7569. 30. F. Rigas, V. Dritsa, R. Marchant, K. Papadopoulou, E. J. Avramides, and I. Hatzianestis,
“Biodegradation of lindane by Pleurotus ostreatus via central composite design”, Environ. Int.,
2005, 31, 191-196.
31. C. Malisorn and W. Suntornsuk, “Optimization of β-carotene production by Rhodotorula glutinis DM28 in fermented radish brine”, Bioresour. Technol., 2008, 99, 2281-2287.
32. D. Mikkelsen, B. M. Flanagan, G. A. Dykes and M. J. Gidley, “Influence of different carbon sources on bacterial cellulose production by Gluconacetobacter xylinus strain ATCC 53524”, J. Appl. Microbiol., 2009, 107, 576-583.
34. Thai Industrial Standards Institute, “Standard Test Methods for Paper and Paper Board”, Industrial Standards Institute, Ministry of Industry, Bangkok, 1997, pp.1-6.
35. ASTM International, “Standard test method for water vapor transmission rate of sheet materials using dynamic relative humidity measurement”, 2013, http://enterprise2.astm.org/ DOWNLOAD-/E398.1272742-1.pdf (Accessed: December 2013).
36. ASTM International, “Standard test method for oxygen gas transmission rate through plastic film and sheeting using a coulometric sensor”, 2010, http://enterprise2.astm.org/ DOWNLOAD-/D3985.1272742-1.pdf (Accessed: December 2013).
37. ASTM International, “Standard test method for water absorption of plastics”, 2010, http://-enterprise2.astm.org/DOWNLOAD/D570.1272742-1.pdf (Accessed: December 2013).
38. J. H. Ha, O. Shehzad, S. Khan, S. Y. Lee, J. W. Park, T. Khan and J. K. Park, “Production of bacterial cellulose by a static cultivation using the waste from beer culture broth”, Korean J. Chem. Eng., 2008, 25, 812-815.
39. P. Carreira, J. A. S. Mendes, E. Trovatti, L. S. Serafim, C. S. R. Freire, A. J. D. Silvestre and C. P. Neto, “Utilization of residues from agro-forest industries in the production of high value bacterial cellulose”, Bioresour. Technol., 2011, 102, 7354-7360.
40. R. J. Moon, A. Martini, J. Nairn, J. Simonsen and J. Youngblood, “Cellulose nanomaterials review: Structure, properties and nanocomposites”, Chem. Soc. Rev., 2011, 40, 3941-3994. 41. O. Shezad, S. Khan, T. Khan and J. K. Park, “Physicochemical and mechanical
characterization of bacterial cellulose produced with an excellent productivity in static conditions using a simple fed-batch cultivation strategy”, Carbohydr. Polym., 2010, 82, 173-180.
42. C. Castro, R. Zuluaga, C. Álvarez, J.-L. Putaux, G. Caro, O. J. Rojas, I. Mondragon and P. Gañán, “Bacterial cellulose produced by a new acid-resistant strain of Gluconacetobacter genus”, Carbohydr. Polym., 2012, 89, 1033-1037.
43. P. Chen, S. Y. Cho and H. J. Jin, “Modification and applications of bacterial celluloses in polymer science”, Macromol. Res., 2010, 18, 309-320.
44. S. Keshk, “Physical properties of bacterial cellulose sheets produced in presence of lignosulfonate”, Enzyme Microb. Technol., 2006, 40, 9-12.
45. M. U. Rani, K. Udayasankar and K. A. A. Appaiah, “Properties of bacterial cellulose produced in grape medium by native isolate Gluconacetobacter sp.”, J. Appl. Polym. Sci., 2011, 120, 2835-2841.
46. W. Tang, S. Jia, Y. Jia and H. Yang, “The influence of fermentation conditions and post-treatment methods on porosity of bacterial cellulose membrane”, World J. Microbiol. Biotechnol., 2010, 26, 125-131.
47. S. Kongruang, “Bacterial cellulose production by Acetobacter xylinum strains from agricultural waste products”, Appl. Biochem. Biotechnol., 2008, 148, 245-256.