MUCILAGINOSA
Iriani R. Maldonade1*, Delia B. Rodriguez-Amaya2, Adilma R. P. Scamparini2
1
Embrapa Hortaliças, Brasília, DF, Brasil; 2Departamento de Ciência de Alimentos, Faculdade de Engenharia de Alimentos,
Universidade de Campinas, Campinas, SP, Brasil.
Submitted: April 07, 2010; Returned to authors for corrections: April 15, 2011; Approved: January 16, 2012.
ABSTRACT
Sequential statistical methods were used to maximise carotenoid production by a strain of Rhodotorula
mucilaginosa, isolated from the Brazilian ecosystem. Initially, a factorial 25-1 experimental design was used,
and the variables were pH and the levels of glucose, yeast extract, MgSO4.7H2O and KH2PO4. The nitrogen
source (yeast extract) was the most important variable in enhancing carotenoid production; MgSO4.7H2O
and KH2PO4 had a negative influence. The initial pH had no significant effect on carotenoid and cell
productions. We further investigated the effects of glucose and yeast extract effects, using a second-order
central composite design (CCD) to optimise carotenoid production, which was adequately approximated
with a full quadratic equation obtained from a two-factor-2-level design. The analysis of quadratic surfaces
showed that after 5 days of cultivation at 25 °C, the maximum carotenoid concentration (745 µg l-1) was
obtained with 15 g l-1 of yeast extract and 20 g l-1 of glucose. The maximum carotenoid production (152 µg
g-1) was obtained with 5 g l-1 yeast extract and 10 g l-1 glucose. Carotenoid formation was more sensitive to
changes in yeast extract concentration than to changes in glucose concentration. Maximum cell production
was achieved with 15-17 g l-1 of yeast extract and 15-20 g l-1 of glucose.
Key words: fermentation, torulene, yeast, response surface design, Rhodotorula mucilaginosa
INTRODUCTION
Carotenoids have special properties that make them
important to food quality and human health. As natural
pigments, they impart the pleasing yellow, orange and red
colours of many foods. Some of these compounds are
precursors of vitamin A, the deficiency of which persists as a
serious public health problem in developing countries. Both
provitamin A and vitamin A-inactive carotenoids can reduce
the risk of the development of degenerative diseases such as
cancer, cardiovascular diseases, cataract and macular
degeneration (1, 9, 12, 15, 22). The red carotenoid astaxanthin
(3,3'-dihydroxy- , -carotene-4,4'-dione) is used as feed
pigment in the aquaculture industry, particularly for salmon
and trout. Because of their many applications, carotenoids
sources continue to be sought. Carotenoids can reach the
consumers as natural constituents of foods, as additives that
serve as colourants of food or as food supplements.
Carotenoid biosynthesis is characteristic of yeasts from
the genus Rhodotorula. The major carotenoids produced are
torulene (3',4'-didehydro- , -carotene), β-carotene ( ,
-carotene) and torularhodin (3',4'-didehydro- , -caroten-16'-oic
acid) (3, 6, 16, 21). Torulene is an interesting carotenoid for
commercialisation. Because of its 13 conjugated double bonds,
it has a nice reddish colour, in contrast to -carotene (11
conjugated double bonds), which has a yellow to orange colour
that depends on the concentration. Structurally, torulene fulfills
the minimum requirement for a provitamin A carotenoid: an
unsubstituted β-ring with an 11-carbon polyene chain. This
carotenoid should be an efficient antioxidant because the
antioxidant property of carotenoids is associated with the
conjugated double bond system and the efficiency is higher
with a greater number of double bonds. Torularhodin, the
carboxylated derivative of torulene, was found in in vitro
studies to be more potent than -carotene in quenching singlet
oxygen and scavenging peroxyl radicals (18, 19).
Carotenogenesis depends on the strains, which produce
variable quantities of different carotenoids, and on the culture
conditions, which affect yeast growth and metabolite
production. The relative concentrations of individual pigments
can be altered by modifying fermentation conditions, such as
the pH, carbon and nitrogen sources, temperature and presence
and levels of salts and light. However, the biotechnological
production of carotenoids is limited by high cost, but this
problem can be reduced by optimising the process conditions.
Production of biomass should also be considered because it can
be used in animal feed as a protein source (4, 7, 8, 14).
In the present work, we optimised the culture conditions
for the production of carotenoids by wild Rhodotorula
mucilaginosa, which was isolated in Brazil. For this purpose, a
statistical experimental design was employed rather than the
one-factor-at-a-time approach. Therefore, the effects of various
factors, including the interaction of factors, could be
simultaneously investigated. R. mucilaginosa was chosen
because it was previously shown (10) to produce torulene as
the principal carotenoid.
MATERIALS AND METHODS
Microorganism and culture conditions
Wild yeast Rhodotorula mucilaginosa-137, which was
isolated from the soil of Campinas, São Paulo, Brazil, and
previously identified (11), was used throughout this study. The
culture was maintained by monthly transfers to yeast malt-agar
(YM) slants containing 0.3 g l-1 yeast extract, 0.3 g l-1 malt
extract, 0.5 g l-1 peptone, 10 g l-1 glucose and 20 g l-1 agar, and
was stored at 4 °C. Each starter culture was prepared by
inoculating one loop of a slant culture into 200 ml of YM
medium in a 500 ml Erlenmeyer flask and incubating at 25 °C
with shaking at 200 rpm for 72 h in a rotary shaker.
Fermentation was carried out in 500 ml Erlenmeyer flasks
containing 200 ml of media prepared with different
combinations of initial pH and levels of glucose, yeast extract,
MgSO4.7H2O and KH2PO4. Each flask was inoculated with 7.5
% (v v-1) of the starter culture and incubated at 25 °C with
shaking at 200 rpm in a rotary shaker for 5 days in the dark.
Because of the many variables investigated in this paper, the
effects of light and temperature will be reported in a separate
paper. Cell growth was monitored periodically by measuring
the absorbance at 600 nm of samples withdrawn aseptically
from the flasks, using a Beckman model DU-640 UV/visible
spectrophotometer. The cells were harvested by centrifugation
at 10,000 x g for 10 min at 5 °C, washed twice with distilled
water and centrifuged again. The dry mass was gravimetrically
determined after drying the centrifuged and washed cells at 105
°C to a constant weight.
Analytical procedures
The glucose concentration was measured in the
supernatant according to the dinitrosalicylic acid (DNS)
method (13). The amount of cell protein was determined by the
Kjeldahl method using the general factor of 6.25.
procedures described by Maldonade et al. (10, 11) and
Rodriguez-Amaya (17). Wet cells were collected by
centrifugation, macerated with Hyflosupercel and acetone with
a mortar and pestle, and filtered. Extraction and filtration were
repeated until the residue turned colourless. The carotenoids
were transferred to petroleum ether in a separatory funnel by
the addition of water and were subsequently washed free of
acetone. The pigment solution was dried with anhydrous
sodium sulphate and concentrated in a rotary evaporator (< 40
°C). The absorbance at 481 nm was determined, and the total
carotenoid concentration was calculated according to the
formula provided by Davies (5) using the absorption
coefficient of torulene (A1%1cm= 3240), the principal
carotenoid. The carotenoid content was expressed as µg l-1 of
medium and µg g-1 of dry cell. The carotenoid yield in terms of
sugar consumed (YP/S) was also calculated. It was defined as
YP/S = (Pf - Pi)/(Si - Sf), where Si and Pi were the substrate and
total carotenoid concentration (µg l-1) at the beginning of
fermentation, respectively, and Sf and Pf were the substrate and
total carotenoid concentration (µg l-1) at the end of
fermentation, respectively.
Experimental design
The experimental data were submitted to analysis of
variance (ANOVA) using the Statistica for Windows software
(20). A 25-1 factorial design (2) was used to study the effect of
medium components on yeast growth and carotenoid
production. The experimental variables were initial pH and the
concentrations of glucose, yeast extract, MgSO4.7H2O and
KH2PO4 (Table 1). Based on the results of this initial design, a
22 factorial design with three replicates at the center point was
employed to study the combined effect of yeast extract and
glucose concentrations on carotenoid production. The yeast and
glucose concentrations evaluated are presented in Table 2. The
experimental data were analyzed by the response surface
regression procedure using the software Statistica for Windows
software version 7.0 (20).
RESULTS AND DISCUSSION
Significant culture factors
The factorial design 25-1 determined the independent
factors that had a greater influence on carotenoid and biomass
production. The results obtained after 5 days of incubation are
presented in Table 1; the reproducibility of replicate flasks was
very good (R2 = 0.99). The biomass varied from 1.1 to 11 g l-1.
The greatest biomass production occurred in assay 16, which
used medium (pH 6) consisting of 40 g l-1 glucose, 5 g l-1 yeast
extract, 1 g l-1 MgSO4.7H2O and 8 g l-1 KH2PO4. Carotenoid
production varied from 59 to 904 µg l-1, maximum production
was obtained in assay 8 using with medium also consisting of
40 g l-1 glucose and 5 g l-1 yeast extract but without salt
supplementation. The yield was only 50 µg g-1 of sugar, which
indicates that the amount of glucose in the medium could be
reduced based on the high residual sugar concentration. In µg
g-1, assays 5 and 8 gave the highest carotenoid concentration of
173 and 162 µg g-1, respectively, with concentrations ranging
from 32 to 173 µg g-1. In assay 5, the medium (pH 4) consisted
of 10 g l-1 glucose and 5 g l-1 yeast extract without salt
supplementation.
The experimental results were used to estimate the main
effects of variables and their interactions (data not shown).
Only yeast extract had a positive effect on carotenoid
production. An increase in yeast extract concentration
stimulated both cell growth and carotenoid formation. The
addition of KH2PO4 promoted a significant negative effect on
the parameters evaluated, whereas magnesium sulphate had a
positive effect on biomass formation but a negative effect on
carotenoid production in µg g-1. Because a carbon source is
essential for microbial growth, glucose had a positive effect on
yeast growth but no significant effect on carotenoid production.
The initial pH did not significantly influence biomass
production nor carotenoid formation. The interactions between
variables were not significant in terms of biomass and
carotenoid production in µg l-1, except for the interaction
Table 1. 25-1 factorial design with coded values and experimental results obtained after 5 days of fermentation for biomass production, carotenoid production and yield.
Variables* Results
Assay no.
A B C D E Carotenoid production (µµµµg l-1)
Carotenoid production (µµµµg g-1)
Yield (µµµµg g-1 sugar)
Biomass (g l-1)
Residual sugar (g l-1)
1 4 10 1 0 8 59 53 10 1.1 4.1
2 6 10 1 0 0 255 138 39 1.8 3.5
3 6 40 1 0 0 160 76 18 2.1 31
4 6 40 1 0 8 142 77 15 1.8 31
5 4 10 5 0 0 665 173 70 3.8 0.6
6 6 10 5 0 8 445 128 46 3.5 0.3
7 4 40 5 0 8 678 139 44 4.9 25
8 6 40 5 0 0 904 162 50 5.6 22
9 4 10 1 1 0 389 93 41 4.2 0.6
10 6 10 1 1 8 145 32 15 4.5 0.7
11 4 40 1 1 8 243 56 16 4.4 25
12 6 40 1 1 0 431 80 29 5.4 25
13 4 10 5 1 8 731 120 75 6.1 0.2
14 6 10 5 1 0 758 122 78 6.2 0.2
15 4 40 5 1 0 397 47 17 8.5 16
16 6 40 5 1 8 713 67 27 11 14
17 5 25 3 0.5 4 670 77 34 8.7 5.1
18 5 25 3 0.5 4 671 72 33 9.3 4.5
19 5 25 3 0.5 4 620 68 30 9.1 4.5
*A=Initial pH, B=Glucose (g l-1), C= Yeast extract (g l-1), D= MgSO4.7H2O (g l-1), E= KH2PO4 (g l-1)
Optimum medium composition
Based on the results of the initial factorial design, the
composition of the medium was optimised by examining the
variable (yeast extract) that positively influenced carotenoid
production and glucose, which would be essential for growth.
The experimental results for the two-factor-three-level
response surface analysis are shown in Table 2. The biomass of
R. mucilaginosa-137 ranged from 2.5 to 8.0 g l-1 with the
maximum biomass obtained with 15 to 20 g l-1 glucose and 15
to 17 g l-1 yeast extract. Carotenoid production (µg g-1 dry cell)
varied from 84 to 152; the maximum production (127 to 152
µg g-1) occurred with 7.9 to 10 g l-1 glucose and 5 to 10 g l-1
yeast extract. The carotenoid concentration (µg l-1) varied from
250 to 745 µg l-1 and reached the maximum concentration (730
to 745 µg l-1) with 15 to 20 g l-1 glucose and 10 to 15 g l-1 yeast
extract. The protein content of the biomass ranged from 39 to
68 %. The maximum range was achieved with 10 to 15 g l-1
yeast extract and 20 to 22 g l-1 glucose. Compared to the
control assay, which produced about 340 µg l-1 carotenoids and
6.2 g l-1 biomass in the YM medium, the production of
carotenoids and biomass has increased significantly.
The full quadratic models of these results were tested for
adequacy by ANOVA (Table 3). The model for biomass has
satisfactory values of R2 = 0.987 and is significant at the 5 %
level. The F value of 76.17 for biomass is greater than F5,5
(5.05) within a rejection region with an α-level that is p < 0.05;
thus, this model can be used to predict the results in the studied
Table 2. 22 factorial design values and experimental results obtained from fermentation of R. mucilaginosa-137 with varying concentrations of glucose and yeast extract.
Variables Results
Assays Yeast extract (g l-1)
Glucose (g l-1)
Biomass (g l-1)
Carotenoid production (µµµµg l-1)
Carotenoid production (µµµµg g-1)
Residual sugar (g l-1)
Protein (%)
1 5.0 10 3.2 488 152 0.3 47
2 15 10 6.5 679 104 0.5 55
3 5.0 20 5.3 609 116 2.6 52
4 15 20 8.0 745 93 0.8 68
5 10 7.9 5.0 637 127 0.4 51
6 10 22 7.4 671 91 2.2 56
7 2.9 15 2.5 250 100 3.5 39
8 17 15 8.0 671 84 0.7 55
9 10 15 6.6 702 106 0.6 49
10 10 15 6.5 728 111 0.5 51
11 10 15 6.4 732 114 0.5 52
At 95% significant level (p<0.05)
Table 3. Analysis of variance for the regression model of carotenoid production (after ignoring the insignificant effects) and biomass, obtained from the response surface experiments.
Carotenoid production (µµµµg l-1)
Biomass (g l-1) Source
SS Df MS SS Df MS
Regression 184,558.8 3 61,519.6 32.105 5 6.421 Residual 24,645.7 7 3,520.81 0.4217 5 0.0843 Lack of fit 24,115.0 5 4,823.0 0.4017 3 0.1339 Pure error 530.7 2 265.3 0.020 2 0.010
Total 209,204.5 10 32.527 10
F model 17.47 76.17
MSLf/MSPe 18.18 13.39
R2 0.88 0.98
SS = Sum of square; Df = Degrees of freedom; MS = Media square; MSLf/MSPe = MS Lack of fit/ MS Pure error;
F5,2 = 19.30; F3,7 = 4.35; F5,5 = 5.05; F3,2 = 19.16
The model for carotenoid production (µg l-1) had to be
adjusted because the F value (8.25) obtained was greater than
F5,5 (5.05), but the MSLf/MSPe (27.73) was greater than F3,2
(19.16) (data not shown). By adjusting the model and ANOVA
and ignoring the insignificant effects, the new regression
obtained is better. The F model (17.47) is much greater than
F3,7 (4.35), and MSR/MSr = 18.18 is lower than F5,2 (19.30),
which suggests that the adjusted model can better predict the
results than the complete model. Using a multiple regression
analysis of the experimental data in Table 3 and excluding
insignificant terms, the final models are as follows:
Biomass (µg l-1) = 6.50 +1.72 X – 0.62 X2 + 0.87 Y–
0.14 Y2 – 0.15 X.Y
Total carotenoid (µg l-1) = 706.47 + 115.30 X – 107.40
X2 + 29.38 Y
where X represents yeast extract (g l-1) and Y represents
glucose (g l-1).
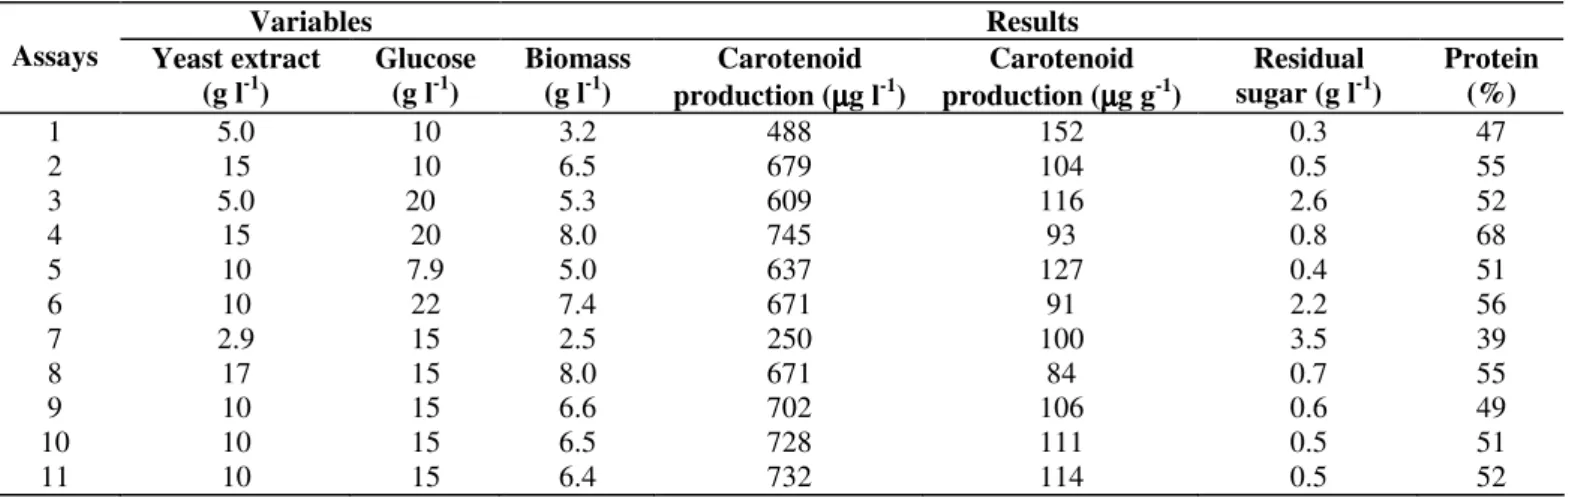
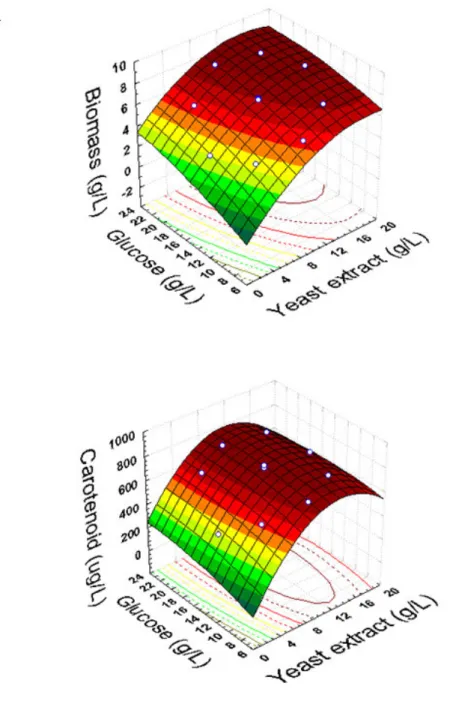
The regression models were employed to develop the
response surface plots shown in Figure 1. Figure 1-B shows
that carotenoid production (µg l-1) was more sensitive to
changes in yeast extract concentration than to changes in
for carotenoid production occurred with approximately 12 to
16 g l-1 yeast extract. Figure 1-A shows that biomass was
affected by the independent variables yeast extract and glucose.
The best condition in the region studied for biomass and
carotenoid production by R. mucilaginosa was in the range of
15 to 20 g l-1 glucose and 15 to 17.07 g l-1 yeast extract. Under
these conditions, the yeast yielded 8.0 g l-1 biomass and a
maximum total carotenoid production of 745 µg l-1 after 120 h
of fermentation, indicating approximately 33 % higher biomass
and 52 % higher total carotenoid production than with the
control (6.2 g l-1 and 340 µg l-1, respectively).
Figure 1. Response surface diagrams as a function of yeast extract and glucose concentrations: (A): biomass production (g l-1);
CONCLUSION
Yeast extract is a good source of nitrogen for the
production of carotenoids by R. mucilaginosa. Because of the
increase in residual sugar in the medium and the cost and yield
of the process, glucose concentrations should not be higher
than 20 g l-1. The optimal cell production was achieved with
15-17 g l-1 yeast extract and 15-20 g l-1 glucose. Maximum
carotenoid concentration was obtained with 15 g l-1 yeast
extract and 20 g l-1 glucose. Both biomass and carotenoid
productions (µg l-1) adjusted well to the mathematical model,
which means that both can be predicted by the established
equations. Considering that yeast growth and carotenoid
production did not have a direct correlation, two-stage batch
fermentation appears to be more appropriate for the production
of carotenoids by Rhodotorula mucilaginosa. In the first stage,
the yeast could grow under higher concentrations of nitrogen
and carbon; in the second stage, carotenoid production can be
enhanced by placing the yeasts under stress with light, salts and
oxygen.
REFERENCES
1. Astorg, P. (1997). Food carotenoids and cancer prevention: An overview of current research. Trends Food Sci. Technol. 8, 406-413.
2. Barros, B.; Scarminio, I.S.; Bruns, R.E. (1996). Planejamento e otimização de experimentos. Unicamp (ed.), São Paulo-Brazil, p. 133-165.
3. Buzzini, P.; Martini, A.; Gaetani, M.; Turchetti, B.; Pagnoni, U.M.; Davoli, P. (2005). Optimization of carotenoid production by Rhodotorula graminis DBVPG 7021 as a function of trace element concentration by means of response surface analysis. Enz. Microb. Technol. 36, 687-692. 4. Costa, I.; Martelli, H.L; Da Silva, I.M.; Pomeroy, D. (1987). Production
of β-carotene by a Rhodotorula strain. Biotech. Lett. 9, 373-375. 5. Davies, B.H. (1976). Carotenoid. In: Goodwin, T. W. (ed.), Chemistry
and Biochemistry of Plant Pigments. Academic Press, New York, p.
38-165.
6. Frengova, G.; Simova, E.; Pavlova, K.; Beshkova, D.M.; Grigrova, D.
(1994). Formation of carotenoids by Rhodotorula glutinis in whey ultrafiltrate. Biotechnol. Bioeng. 44, 888-894.
7. Johnson, E.A.; Lewis, M.J.; Grau, C.R. (1980). Pigmentation of egg yolks with astaxanthin from the yeast Phaffia rhodozyma. Poult. Scienc. 59, 1777-1782.
8. Johnson, E.A.; Conklin, D.E.; Lewis, M.J. (1977). The yeast Phaffia rhodozyma as a dietary pigment source for salmonoids and crustaceans.
J. Fish Res. Board Canada. 34, 2417-2421.
9. Krinsky, N.I.; Johnson, E.J. (2005). Carotenoid actions and their relation to health and disease. Mol. Aspects. Med. 26, 459-516.
10. Maldonade, I.R.; Rodriguez-Amaya, D.B.; Scamparini, A.R.P. (2008). Carotenoids of yeasts isolated from the Brazilian ecosystem. Food Chem. 3, 159-164.
11. Maldonade, I.R.; Scamparini, A.R.P.; Rodriguez-Amaya, D.B. (2007). Selection and characterization of carotenoid-producing yeasts from Campinas region, Brazil. Brazilian J. Microbiol. 38, 1-6.
12. Mayne, S.T. (1996). Beta-carotene, carotenoids, and disease prevention in humans. FASEB J. 10, 690-701.
13. Miller, G.L. (1959). Use of dinitrosalicylic acid reagent for determination of reducing sugar. Anal. Chem. 31, 426-428.
14. Nelis, H.J.; Deleenheer, A.P. (1991). Microbial sources of carotenoid pigment used in foods and feeds: a review. J. Appl. Bacteriol. 70, 181-191.
15. Olson, J.A. (1999). Carotenoids and human health. Arch. Latinoamer. Nutr. 49, 7-11.
16. Park, P.K.; Kim, E.Y.; Chu, K.H. (2007). Chemical disruption of yeast cells for the isolation of carotenoid pigments. Sep. and Purific. Techno.l 53, 148-152.
17. Rodriguez-Amaya, D.B. (1999). A Guide to Carotenoids Analysis. International Life Sciences, Institute Press, p. 64.
18. Sakaki, H.; Nochide, H.; Komemushi, S.; Miki, W. (2002). Effect of active oxygen species on the productivity of torularhodin by Rhodotorula glutinis N°21. J. Biosci. Bioeng. 93, 338-340.
19. Sakaki, H.; Nakanishi, T.; Tada, A.; Miki, W.; Komemushi, S. (2001). Activation of torularhodin production by Rhodotorula glutinis using weak white light irradiation. J. Biosci. Bioeng. 92, 294-297.
20. SAS (1990). SAS: User’s Guide: Statistics (Version 6a). SAS Institute Inc., Cary, North Carolina, USA.
21. Simpson, K.L.; Chichester, C.O.; Phaff, H.J. (1971). Carotenoid pigments of yeast. In: Rose A.H., Harrison J.S. (eds.), The Yeasts. Academic Press, New York, vol 2, p. 493-515.
22. Tapiero, H.; Townsend, D.M.; Tew, K.D. (2004). The role of carotenoids in the prevention of human pathologies. Biomed Pharmacother. 58, 100-110.