BGD
11, 11249–11291, 2014
Biogeophysical impacts of peatland
forestation on regional climate changes in Finland
Y. Gao et al.
Title Page
Abstract Introduction
Conclusions References
Tables Figures
◭ ◮
◭ ◮
Back Close
Full Screen / Esc
Printer-friendly Version
Interactive Discussion
Discussion
P
a
per
|
Discus
sion
P
a
per
|
Discussion
P
a
per
|
Discussion
P
a
per
|
Biogeosciences Discuss., 11, 11249–11291, 2014 www.biogeosciences-discuss.net/11/11249/2014/ doi:10.5194/bgd-11-11249-2014
© Author(s) 2014. CC Attribution 3.0 License.
This discussion paper is/has been under review for the journal Biogeosciences (BG). Please refer to the corresponding final paper in BG if available.
Biogeophysical impacts of peatland
forestation on regional climate changes in
Finland
Y. Gao1,2, T. Markkanen1, L. Backman1, H. M. Henttonen3, J.-P. Pietikäinen1,
H. Mäkelä1, and A. Laaksonen1,4
1
Finnish Meteorological Institute, P.O. Box 503, 00101 Helsinki, Finland 2
University of Helsinki, Department of Physics, P.O. Box 64, 00014 Helsinki, Finland 3
Finnish Forest Research Institute, P.O. Box 18, 01301 Vantaa, Finland 4
University of Eastern Finland, Department of Applied Physics, P.O. Box 1627, 70211 Kuopio, Finland
Received: 11 June 2014 – Accepted: 3 July 2014 – Published: 22 July 2014
Correspondence to: Y. Gao ([email protected])
BGD
11, 11249–11291, 2014
Biogeophysical impacts of peatland
forestation on regional climate changes in Finland
Y. Gao et al.
Title Page
Abstract Introduction
Conclusions References
Tables Figures
◭ ◮
◭ ◮
Back Close
Full Screen / Esc
Printer-friendly Version
Interactive Discussion
Discussion
P
a
per
|
Discus
sion
P
a
per
|
Discussion
P
a
per
|
Discussion
P
a
per
|
Abstract
Land cover changes can impact the climate by influencing the surface energy and water balance. Unproductive peatlands were extensively drained to stimulate forest growth in Finland over the second half of 20th century. The aim of this study is to investigate the biogeophysical effects of peatland forestation on climate change in Finland. Two 5
sets of 18 year climate simulations were done with the regional climate model REMO by using land cover data based on pre-drainage (1920s) and post-drainage (2000s) Finnish National Forest Inventories. The results show that in the most intensive peat-land forestation area located in the middle west of Finpeat-land, the differences in monthly averaged daily mean two-metre air temperature show a spring warming of up to 0.43 K 10
in April, whereas a slight cooling of less than 0.1 K in general is found from May till October. Consequently, snow clearance days over that area are advanced up to 5 days in the mean of 15 years. No clear signal is found for precipitation. Through analysing the simulated temperature and energy balance terms, as well as snow depth over five selected subregions, a positive feedback induced by peatland forestation is found be-15
tween decreased surface albedo and increased surface air temperature in the snow melting period. Our modelled results show good qualitative agreements with the ob-servational data. In general, decreased albedo in snow-melting period and increased evapotranspiration in the growing period are the most important biogeophysical as-pects induced by peatland forestation that cause changes in climate.
20
1 Introduction
Climate response to anthropogenic land cover change happens more locally and oc-curs on a much shorter time scale, compared to global warming due to increased greenhouse gases (IPCC, 2013). The influences on the climate from the biogeophysi-cal effects caused by land cover changes can enhance or reduce the projected climate 25
BGD
11, 11249–11291, 2014
Biogeophysical impacts of peatland
forestation on regional climate changes in Finland
Y. Gao et al.
Title Page
Abstract Introduction
Conclusions References
Tables Figures
◭ ◮
◭ ◮
Back Close
Full Screen / Esc
Printer-friendly Version
Interactive Discussion
Discussion
P
a
per
|
Discus
sion
P
a
per
|
Discussion
P
a
per
|
Discussion
P
a
per
|
Göttel et al., 2008; Ge and Zou, 2013; Pielke et al., 2011, 1998; Pitman, 2003). Es-pecially for the climate impacts of past large-scale afforestation, studies show that the most obvious effects from the increase of forests in boreal areas are warming dur-ing snow-cover periods, due to decreased surface albedo, and cooldur-ing in summertime from increased evapotranspiration (ET) in tropical areas with sufficient soil moisture 5
(Bala et al., 2007; Betts, 2000; Betts et al., 2007).
Vast areas of unproductive peatlands have been drained to grow forests for timber production in northern European countries (Päivänen and Hånell, 2012). In Finland, it is the dominant land cover change over the last half century, due to the high fraction of pristine peatland and the needs for timber production. The total peatland area of Fin-10
land was estimated to be 9.7 million ha in the 1950s (Ilvessalo, 1956). In the beginning of 2000s, the area of drained peatland for forestry was estimated to be 5.7 million ha by Minkkinen et al. (2002) and 5.5 million ha by Tomppo et al. (2011). The area of drained peatlands is unlikely to increase further because no more public subsidisation is given for the first-time drainage of peatlands, along with the increased awareness of natu-15
ral conservation (Metsätalouden kehittämiskeskus Tapio, 1997). The area of restored mires was 15 000 ha between 1990 and 2008 (www.biodiversity.fi/en/indicators/mires/ mi17-mire-restoration) (Kaakinen and Salminen, 2006). However, land cover change is not only a result of human land-use activities but can also be a consequence of cli-mate change. Global warming in the future is also considered to be a factor that affects 20
boreal peatland through water-level drawdown due to increased ET (Laiho et al., 2003; Laine et al., 1995).
Attention has been paid to the climate effects of peatland forestation. A decrease in the local night-time minimum temperature during the growing season was observed roughly for the first 15 years after drainage (Solantie, 1994). The reason for this noc-25
BGD
11, 11249–11291, 2014
Biogeophysical impacts of peatland
forestation on regional climate changes in Finland
Y. Gao et al.
Title Page
Abstract Introduction
Conclusions References
Tables Figures
◭ ◮
◭ ◮
Back Close
Full Screen / Esc
Printer-friendly Version
Interactive Discussion
Discussion
P
a
per
|
Discus
sion
P
a
per
|
Discussion
P
a
per
|
Discussion
P
a
per
|
peatlands leads to a decrease in albedo. The reasons for this are the darker tree-cover in comparison to the lighter grass-tree-cover in the snow-free period, and the partial snow cover in forest areas compared to the full snow cover in open area in snow-cover period. This increases the daily maximum temperature due to an increase in the absorption of short-wave radiation (Solantie, 1994). A consistent result was found by 5
Lohila et al. (2010) based on radiation and albedo measurements at different drained and undrained peatland sites, as well as the observed long-term surface temperatures in Finland. In southern Finland (<65◦N), the day-time maximum (night-time minimum) temperature in April increased by 0.64 (0.37) K decade−1 during 1961 to 2008, along with about a total of 2.7 million ha of drained unproductive peatlands (Hökkä et al., 10
2002). This indicates an increase in the diurnal temperature range in April due to a greater increase in day-time maximum than in night-time minimum temperatures, which is possibly a result of the change in surface radiative properties after drainage.
However, these studies related to peatland forestation are based only on site-level data. The climate effects of peatland forestation have not been quantified on a regional 15
scale/country level by investigating the biogeophysical effects. Also, the magnitude and pattern of land-use change effects on climate depends on the regional conditions, for instance soil property, topography and so on. Information from regional studies is es-sential for the development of future strategies for climate mitigation or forest manage-ment. Thus, it is necessary to investigate the effects regionally and systematically. In 20
recent years, regional climate models have become suitable for simulating regional cli-mate in a fine resolution to resolve small-scale atmospheric circulation (Déqué et al., 2005; Jacob et al., 2007, 2001; McGregor, 1997). For this, a regional climate model with a realistic land scheme to interpret more detailed land surface information needs to be applied.
25
BGD
11, 11249–11291, 2014
Biogeophysical impacts of peatland
forestation on regional climate changes in Finland
Y. Gao et al.
Title Page
Abstract Introduction
Conclusions References
Tables Figures
◭ ◮
◭ ◮
Back Close
Full Screen / Esc
Printer-friendly Version
Interactive Discussion
Discussion
P
a
per
|
Discus
sion
P
a
per
|
Discussion
P
a
per
|
Discussion
P
a
per
|
respectively. The intention is to investigate the biogeophysical impacts of past peatland forestation on climate change in Finland.
2 Model description and methodology
2.1 REMO climate model
The regional climate model REMO is a three-dimensional hydrostatic atmospheric cir-5
culation model developed at Max Planck Institute, Germany (Jacob et al., 2007, 2001; Jacob and Podzun, 1997). Its dynamical core is based on the “Europamodell”, the for-mer nufor-merical weather prediction model of German Weather Service (Majewski, 1991). The land surface scheme (LSS) of REMO mainly follows that of the global atmosphere circulation model ECHAM4 (Roeckner et al., 1996), with several physical packages up-10
dates (details will be shown later). The prognostic variables are pressure, temperature, horizontal wind components, specific humidity, cloud liquid water and ice. REMO is driven by large-scale forcing data according to the relaxation scheme (Davies, 1976). The eight outer most gridboxes at each lateral boundary are the sponge zone.
Because land cover is central for this study, a brief introduction of the LSS in REMO 15
is given below. In REMO LSS, the total area of each model grid box is composed of fractions of land (vegetation cover and bare soil), water (ocean surface and inland lake) and sea ice (Semmler et al., 2004). The biogeophysical characteristics of major land cover classes (Olson, 1994a, b) are described by the following surface parame-ters: background surface albedo (albedo over snow-free land areas), roughness length, 20
fractional green vegetation cover, leaf area index (LAI; one-sided green leaf area per unit ground area), forest ratio (fr; fractional coverage of trees regardless of their pho-tosynthetic activity), soil water holding capacity (maximum amount of water that plants may extract from the soil before wilting begins) and volumetric wilting point (percent-age of moisture in a soil column below which plants start to wilt) (H(percent-agemann, 2002; 25
accord-BGD
11, 11249–11291, 2014
Biogeophysical impacts of peatland
forestation on regional climate changes in Finland
Y. Gao et al.
Title Page
Abstract Introduction
Conclusions References
Tables Figures
◭ ◮
◭ ◮
Back Close
Full Screen / Esc
Printer-friendly Version
Interactive Discussion
Discussion
P
a
per
|
Discus
sion
P
a
per
|
Discussion
P
a
per
|
Discussion
P
a
per
|
ing to fractional coverage of land cover types within a model gridbox, except for the roughness length that is averaged logarithmically (Claussen et al., 1994; Hagemann et al., 1999). As LAI, fractional green vegetation cover and background surface albedo strongly depend on the vegetation phenology, and they are prescribed with intra-annual cycles by using a monthly varying growth factor that determines the growth character-5
istics of the vegetation (Hagemann, 2002; Rechid and Jacob, 2006). The growth factor for latitudes higher than 40◦ North or South is derived from a two-metre temperature climatology (Legates and Willmott, 1990), in other latitudes the fraction of photosyn-thetically active radiation is used.
The simple bucket scheme (Manabe, 1969) is used for soil hydrology where the 10
partitioning of surface runoff and infiltration follows the Arno-Scheme (Dumenil and Todini, 1992). The soil temperature profile from the ground surface to around 10 m deep is described by five soil layers with increasing thickness. The heat conductivity and heat capacity, in the heat conduction equation for calculating the soil temperature, depend on the soil types (Kotlarski, 2007). The distribution of soil types is from FAO/UNESCO 15
soil map of the world (FAO/UNESCO, 1971–1981; Kotlarski, 2007).
The Arno-Scheme used for the soil hydrology was further improved by consider-ing the high resolution subgrid-scale heterogeneity of the field capacities within a cli-mate model gridbox (Hagemann and Gates, 2003). The resolution of subgrid-scale heterogeneity is set to be 10 times higher than the resolution of the model by us-20
ing the standard REMO land cover map–Global Land Cover Characteristics Database (GLCCD) (Loveland et al., 2000; US Geological Survey, 2001). The three parameters in the improved Arno-Scheme are accounting for the shape of the subgrid distribution of soil water capacities (Beta), subgrid minimum (Wmin) and maximum (Wmax) soil wa-ter capacities. Also, the original annual background albedo cycle was modified by using 25
BGD
11, 11249–11291, 2014
Biogeophysical impacts of peatland
forestation on regional climate changes in Finland
Y. Gao et al.
Title Page
Abstract Introduction
Conclusions References
Tables Figures
◭ ◮
◭ ◮
Back Close
Full Screen / Esc
Printer-friendly Version
Interactive Discussion
Discussion
P
a
per
|
Discus
sion
P
a
per
|
Discussion
P
a
per
|
Discussion
P
a
per
|
2.2 The model domain and land cover data sets
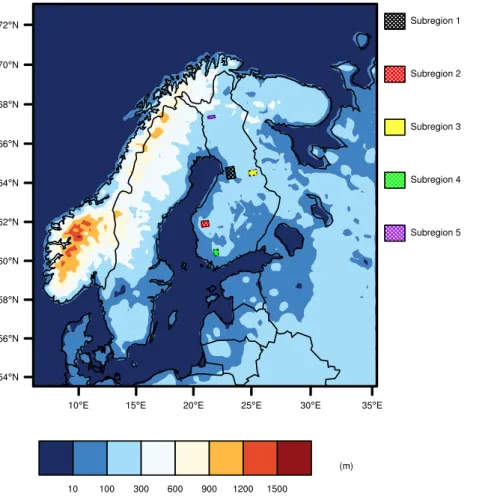
Our model domain covers Fennoscandia, a part of Russia and the northern part of Central Europe, and it is centred on Finland (Fig. 1). Typical features influencing the climate of this domain include: the North Atlantic Ocean and the Baltic Sea that sur-round the Fennoscandian countries; many inland lakes located in Sweden and Finland; 5
the relatively high Scandinavian mountain range; while the rest of the area has a to-pography lower than 300 m above sea level.
The default land cover map in REMO is GLCCD. However, its description of the land cover in Finland is unrealistic. For instance, there is no peatland in Finland in GLCCD, whereas 7.4 % (22 377 km2) of the land is covered by unproductive peatland areas in 10
the 10th Finnish National Forest Inventory (FNFI10) (Korhonen et al., 2013). GLCCD was therefore substituted by the more realistic and up-to-date CORINE land cover map (CLC; 2006) for the same model domain in Gao et al. (2014), except for the Russian part where CLC (2006) is not available. Unfortunately, land cover maps describing land cover conditions of Finland before the most intensive period of peatland drainage in 15
the 1960s are quite limited. Nevertheless, the data collected in the 1st Finnish National Forest Inventory (FNFI1) provide the possibility for tracing back the land cover condition of Finland in the 1920s (Ilvessalo, 1927; Tomppo et al., 2010). The FNFI10 is adopted to describe the land cover condition of Finland in 2000s instead of CLC (2006), with the aim to avoid the uncertainties in comparing land cover maps with different land 20
cover classification methods and different spatial resolutions. The FNFI1 and FNFI10 land cover maps are post-products that were specially prepared for this study from the relative FNFI field measurement data. The detailed description of the procedures for deriving the FNFI1 and FNFI10 land cover maps is shown in Appendix A. The two FNFI land cover maps are in 3 km resolution and include ten land cover classes following 25
CLC-nomenclature.
BGD
11, 11249–11291, 2014
Biogeophysical impacts of peatland
forestation on regional climate changes in Finland
Y. Gao et al.
Title Page
Abstract Introduction
Conclusions References
Tables Figures
◭ ◮
◭ ◮
Back Close
Full Screen / Esc
Printer-friendly Version
Interactive Discussion
Discussion
P
a
per
|
Discus
sion
P
a
per
|
Discussion
P
a
per
|
Discussion
P
a
per
|
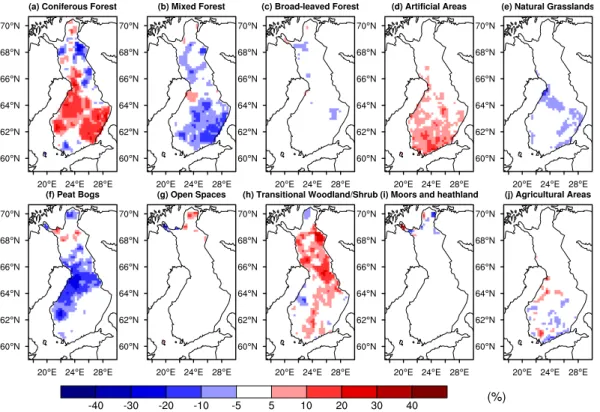
land cover maps are shown below (fractional coverage in the 1920s; changes from the 1920s to the 2000s): Coniferous Forest (33.0 %; 5.2 %); Mixed Forest (13.5 %;
−5.7 %); Broad-leaved Forest (4.7 %; −0.8 %); Artificial Areas (0.7 %; 4.1 %); Natu-ral Grasslands (3.4 %; −3.4 %); Peat Bogs (14.3 %; −5.2 %); Open Spaces (1.5 %; −0.1 %); Transitional Woodland/Shrub (18.9 %; 4.3 %); Moors and heathland (2.1 %;
5
0.7 %); and Agricultural Areas (8.0 %; 0.9 %). Regional differences of those land cover classes can be seen in Fig. 2. In the FNFI maps, the land cover class Peat Bogs is defined as naturally treeless peatland and pine mires where the stocking level is low or the mean height of trees is below 5 m at maturity. Therefore, the shifting from Peat Bogs to forests represents the major land cover change due to peatland forestation. 10
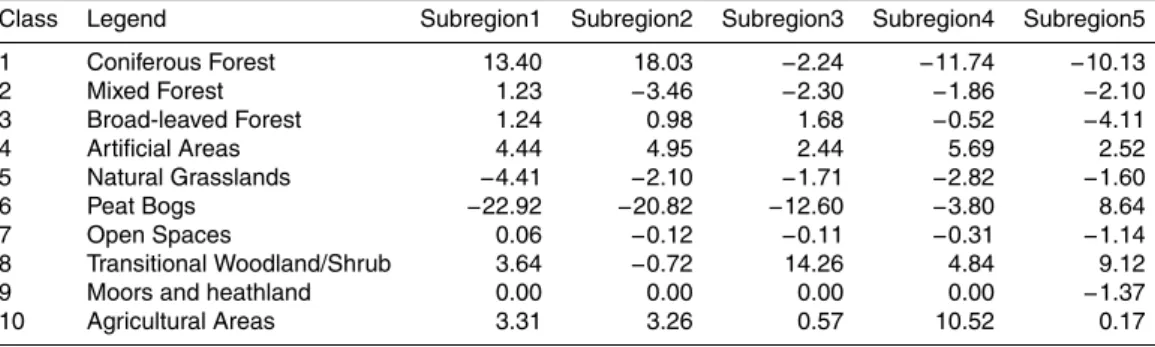
In addition to regional inspections, five subregions were selected to represent dif-ferent land cover change conditions between FNFI1 and FNFI10. This was done to specifically assess the local climate effects of different intensities of peatland foresta-tion (Fig. 1; Table 1). From subregion1 to subregion4, there is a decrease in the re-duction of Peat Bogs. Subregion1 and subregion2 are two peatland forestation areas 15
located in the middle and south of Finland, respectively. In subregion1 and subregion2, there were decreases in the fractional coverage of Peat Bogs of more than 20 %, and the decreases were mainly compensated by Coniferous Forest. The decrease in the fractional coverage of Peat Bogs was 2 % less in subregion2 than that in subregion1, but the increase in the fractional coverage of Coniferous Forest was 5 % higher in 20
subregion2 than that in subregion1. The total increase in the fractional coverage of for-est types was about 16 % in both subregion1 and subregion2. Subregion3 is located in the east of subregion1. There was a 12 % decrease in the fractional coverage of Peat Bogs, but instead of an increase of forests, the fractional coverage of Transitional Woodland/Shrub increased by 14.3 %. Subregion4 is an area where the most intensive 25
BGD
11, 11249–11291, 2014
Biogeophysical impacts of peatland
forestation on regional climate changes in Finland
Y. Gao et al.
Title Page
Abstract Introduction
Conclusions References
Tables Figures
◭ ◮
◭ ◮
Back Close
Full Screen / Esc
Printer-friendly Version
Interactive Discussion
Discussion
P
a
per
|
Discus
sion
P
a
per
|
Discussion
P
a
per
|
Discussion
P
a
per
|
in the fractional coverage of Peat Bogs and a 16.3 % decrease in the fractional cover-age of forest types. Herein, one should notice that some uncertainties may arise from sampling in the FNFI1 and FNFI10 data. This applies especially for FNFI1, where the distance between inventory lines was as high as 26 km. Therefore, subregions that are smaller than 100 km×100 km may not be sufficient to represent the actual land cover
5
changes precisely. However, signals averaged over large areas do not reflect the dy-namics of the changes when diverse land cover changes are involved. Therefore, small subregions can be considered as hypothetical scenarios to represent different kinds of land cover changes and their local climate impacts.
Moreover, the FNFI data only covers the land surface in Finland without consider-10
ing inland lakes. Therefore, the land sea mask in the model domain is adopted from CLC (2006). In addition, the land cover conditions of the area outside Finland in the model domain are the same as those, i.e., based on CLC (2006) and GLCCD, in Gao et al. (2014) and thus identical in both simulations. Additionally, in order to allocate the surface parameters to appropriate land cover classes, the standard GLCCD land cover 15
classes are related to the ten land cover classes in the FNFI maps through comparing the definitions of land cover classes (Table 2).
2.3 Modifications in REMO LSS in this study
Most of the surface parameters follow the built-in parameter values. However, large deviations were found when comparing the parameterised albedo with the observed 20
albedo. Moreover, the method for background albedo parameterisation is not suitable for land-use change studies because the vegetation albedo and the soil albedo maps are both derived from satellite albedo data that were measured in 2001–2004 with respect to land cover over that period. A new method, Land Use Character Shifts (LUCHS), has been proposed for land cover change studies (Preuschmann, 2012). 25
BGD
11, 11249–11291, 2014
Biogeophysical impacts of peatland
forestation on regional climate changes in Finland
Y. Gao et al.
Title Page
Abstract Introduction
Conclusions References
Tables Figures
◭ ◮
◭ ◮
Back Close
Full Screen / Esc
Printer-friendly Version
Interactive Discussion
Discussion
P
a
per
|
Discus
sion
P
a
per
|
Discussion
P
a
per
|
Discussion
P
a
per
|
feasible for high-latitude areas, where snow cover prevents the possibility of deriving background albedo values from satellite albedo data. Hence, a simplified method is developed in this study to derive the background albedo values of the ten land cover classes in FNFI land cover maps. It is based on the assumption that the vegetation albedo map and the soil albedo map in current REMO LSS are feasible to describe 5
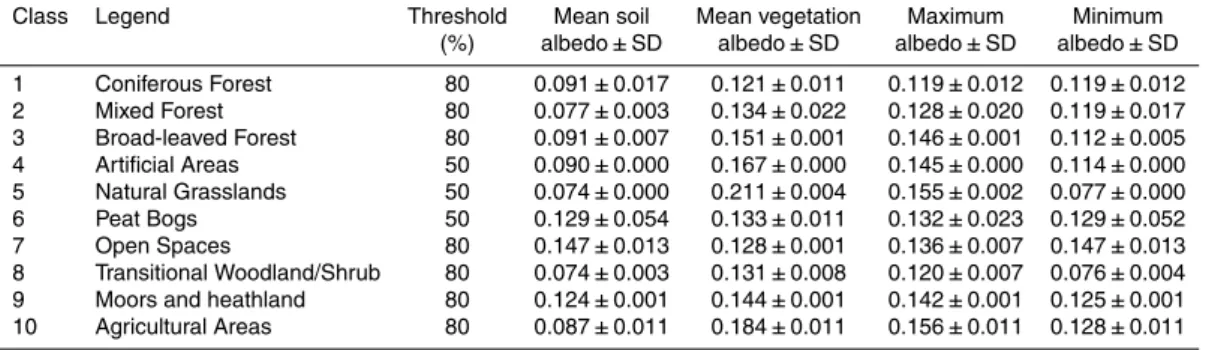
the albedo values of the land cover condition in FNFI10, because the two datasets are overlapping in time. Therefore, the soil albedo and the vegetation albedo values, in model gridboxes that satisfy a requirement of 80 % coverage of one land cover class in FNFI10, are averaged to represent the soil and vegetation albedo values of that land cover class. The 80 % threshold was decreased to 50 % for Natural Grasslands, Peat 10
Bogs and Artificial Areas, as none of the model gridboxes have an 80 % coverage of those land cover classes in Finland. The derived albedo values and the standard de-viations for each land cover class in FNFI maps are shown in Table 3. The maximum background albedos, calculated based on the derived soil and vegetation albedo for FNFI land cover classes, are then compared with the summertime albedo of similar 15
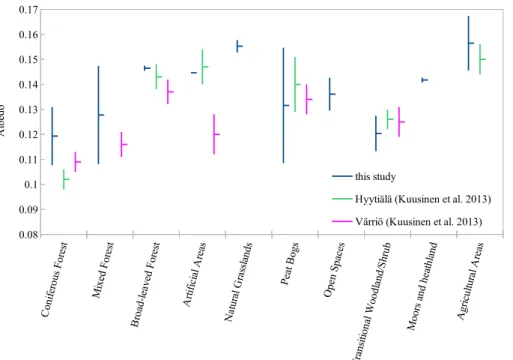
land cover classes for a southern (Hyytiälä; 61◦51′N and 24◦17′E) and a northern (Värriö; 67◦48′N and 27◦52′E) Finnish observation stations. The station values are estimated by a linear unmixing approach with the land-use and forestry maps in com-bination with the MODIS BRDF/albedo product (Kuusinen et al., 2013). The derived and observed albedo values show good agreement for Peat Bogs, Mixed Forest, Tran-20
sitional Woodland/Shrub and Agricultural Areas, as well as for Artificial Areas. Although the maximum albedo values of Coniferous Forest and Broad-leaved Forest in this study are roughly around 0.01 higher than those in Kuusinen et al. (2013), they are reason-able for considering albedo differences between land cover classes (Fig. 3). The three land cover classes (Natural Grasslands, Moors and heathland, Open Spaces) are not 25
found at the two stations; however, they take up only small proportions in the FNFI land cover maps.
BGD
11, 11249–11291, 2014
Biogeophysical impacts of peatland
forestation on regional climate changes in Finland
Y. Gao et al.
Title Page
Abstract Introduction
Conclusions References
Tables Figures
◭ ◮
◭ ◮
Back Close
Full Screen / Esc
Printer-friendly Version
Interactive Discussion
Discussion
P
a
per
|
Discus
sion
P
a
per
|
Discussion
P
a
per
|
Discussion
P
a
per
|
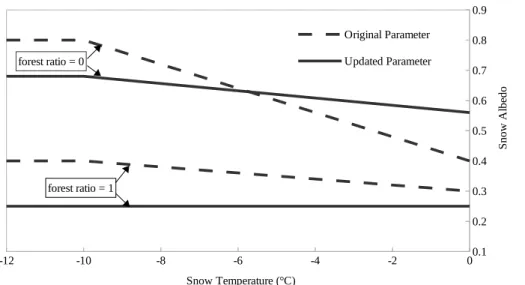
the surface albedo in REMO LSS is a function of background albedo, snow albedo and snow depth. The snow albedo depends linearly on snow surface temperature and fr (Kotlarski, 2007). Based on previous studies (Køltzow, 2007; Räisänen et al., 2014; Roesch et al., 2001), the amin (T =0◦C) and amax (T ≤ −10◦C) of non-forested area
(fr=0) in this study were increased from 0.4 to 0.56 and decreased from 0.8 to 0.68, 5
respectively; in addition, theamin (T =0◦C) andamax(T ≤ −10◦C) of fully forested area (fr=1) were both decreased to 0.25 (Fig. 4). The linear relationship with snow surface temperature and forest ratio is still adopted.
Moreover, the three parameters for describing the subgrid heterogeneity of soil hy-drology (Hagemann and Gates, 2003), Beta,Wmin andWmaxwere calculated in a
sub-10
grid scale of 6 km resolution. It is one-third of the 18 km REMO resolution. The reason for this is that the spatial resolution of the FNFI land cover maps is around three times lower compared to that of the default GLCCD land cover map.
Corrections were also made to some of the surface parameters of Coniferous Forest and Mixed Forest, to obtain a better mutual consistency of the surface parameters for 15
the three forest types. For Coniferous Forest, the fractional green vegetation cover in the dormancy season and in the growing seasons and the forest ratio were set to 0.91, 0.91, 0.8, respectively, as proposed for Fennoscandia by Claussen et al. (1994). For Mixed Forest, the fractional green vegetation cover and LAI in the dormancy season were revised to be half of those parameters in the growing season.
20
3 Experiment design
Two simulations were conducted with the FNFI1 and FNFI10 land cover maps rep-resenting the land cover conditions before and after peatland forestation activities in Finland, respectively. The simulations were driven with 6 hourly lateral boundary con-ditions from ECWMF ERA-Interim reanalysis data (Simmons et al., 2007) from 1 Jan-25
tem-BGD
11, 11249–11291, 2014
Biogeophysical impacts of peatland
forestation on regional climate changes in Finland
Y. Gao et al.
Title Page
Abstract Introduction
Conclusions References
Tables Figures
◭ ◮
◭ ◮
Back Close
Full Screen / Esc
Printer-friendly Version
Interactive Discussion
Discussion
P
a
per
|
Discus
sion
P
a
per
|
Discussion
P
a
per
|
Discussion
P
a
per
|
peratures and soil moistures. The last 15 year (1 December 1981–30 November 1996) out of the 18 year forward simulations were adopted for further analysis. The analysed period starts from 1 December in order to keep all the three winter months continuous. The simulated first one-and-a-half years were excluded in order to minimise the influ-ences of the initial boundary conditions on simulated climate conditions, which have 5
a much quicker adaptation speed than deep soil temperature. The model grid is in an 18 km resolution horizontally and extends over 27 vertical levels (up to 25 km). The model time step was set to 90 s and the time steps of output variables are 6 hourly for 3-D variables and hourly for 2-D variables. Daily data covering 24 h is processed from 18:00 UTC of previous day to 17:00 UTC of the current day. For 6 hourly data, 10
18:00 UTC of the previous day and 00:00 UTC, 06:00 UTC and 12:00 UTC of the cur-rent day were used for daily values. For this study domain, the growing season and the dormancy season cover the period from May to October and from November to April, respectively.
4 Results
15
The land cover change effects on regional climate conditions in Finland are analysed based on the differences in climate variables between the post-drainage and pre-drainage simulations (FNFI10 – FNFI1). This “delta change approach” is adopted to eliminate the uncertainties related to model bias (Gálos et al., 2011; Jacob et al., 2008).
4.1 Effects on climate over Finland
20
The differences in monthly averaged daily mean two-metre air temperature (T2 m) are quite heterogeneous temporally and spatially (Fig. 5). The most noticeable difference inT2 m, up to 0.43 K, takes place in the most intensive peatland forestation area in the middle west of Finland in April. The warming is also evident in February and March, with differences of 0.2 K in this area. However,T2 mturns to show a slight cooling,
BGD
11, 11249–11291, 2014
Biogeophysical impacts of peatland
forestation on regional climate changes in Finland
Y. Gao et al.
Title Page
Abstract Introduction
Conclusions References
Tables Figures
◭ ◮
◭ ◮
Back Close
Full Screen / Esc
Printer-friendly Version
Interactive Discussion
Discussion
P
a
per
|
Discus
sion
P
a
per
|
Discussion
P
a
per
|
Discussion
P
a
per
|
erally less than 0.1 K, in a few parts of this area from May to October. There are also two regions in northern Finland that show opposite changes compared to the peatland forestation area in the middle west of Finland with cooling in spring and warming in the growing season. This is because of decreased forest cover and increased fraction of Peat Bogs in those two areas from FNFI1 to FNFI10 based land cover maps. An in-5
crease of less than 0.2 K is seen inT2 min the southeast of Finland in July and August,
as well as in the very south of Finland throughout the growing season, which are mainly due to the change from Mixed Forest to Coniferous Forest and the increased Artificial Areas, respectively. The 15 year averaged monthly precipitation shows only small dif-ferences, less than 10 mm month−1, in varied patterns in the model domain from April 10
to August (Fig. 6).
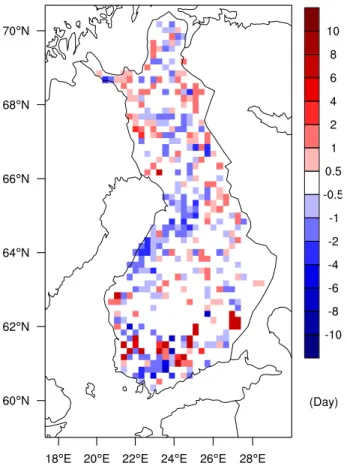
The snow clearance day is also an important indicator of springtime climate change in high-latitude areas (Peng et al., 2013). Therefore, the snow clearance day for each gridbox in Finland is determined for the 15 years. The snow clearance day is defined here as the first day after which the total number of snow-covered days does not ex-15
ceed the total number of snow-free days, and the selection of this day ends before midsummer in a year. The differences between the 15 year averaged snow clearance days of the two simulations (Fig. 7) show almost the same pattern as the differences in
T2 m in April (Fig. 5). In the peatland forestation area in the middle west of Finland, the
snow clearance days are mostly advanced from 0.5 to 3 days and in a few gridboxes 20
advanced by up to 5 days in the 15 year mean. The two small areas in the north of Fin-land with reverse Fin-land cover changes in comparison to peatFin-land forestation show up to two-day delays in general. In the very south of Finland, the snow clearance days are also generally advanced in accordance with the warming seen inT2 m, but delayed in several scattered gridboxes, due to increased fraction of Artificial Areas at the expense 25
BGD
11, 11249–11291, 2014
Biogeophysical impacts of peatland
forestation on regional climate changes in Finland
Y. Gao et al.
Title Page
Abstract Introduction
Conclusions References
Tables Figures
◭ ◮
◭ ◮
Back Close
Full Screen / Esc
Printer-friendly Version
Interactive Discussion
Discussion
P
a
per
|
Discus
sion
P
a
per
|
Discussion
P
a
per
|
Discussion
P
a
per
|
4.2 Effects on climate over five subregions
T2 m and precipitation, as well as several closely related climate variables (surface albedo, net surface solar radiation, snow depth, ET) for the five subregions were pro-cessed into 11 day running means to reduce the influence of day-to-day variations. The differences between the simulations in each of the regionally averaged climate 5
variables were further averaged over the 15 years (Fig. 8). Herein, the date informa-tion (day of year, DOY) represents the middle contributing day of the 11 day averaging period.
T2 m of subregion1 shows a warming of 0.1 K to 0.2 K from February till the end of
March, and an evident peak from early April to early May (DOY 95 to DOY 125), which 10
reaches a maximum of 0.5 K in late April.T2 mof subregion2 has the same trend as sub-region1 throughout the whole year, but the warming is much smaller and the biggest difference occurs in the beginning of April being only 0.12 K. This is consistent with the differences in snow depth. The decrease of snow depth in subregion1 is two to three times larger than that in subregion2, and the snow-cover period in subregion2 15
is shorter along with an earlier maximum difference in snow depth. Moreover, those characteristics of the differences in snow depths are in agreement with the differences in surface albedo because snow is the key factor that controls the surface albedo in the snow-cover period. From the beginning of May to the beginning of October,T2 m turns to show a cooling of less than 0.1 K in subregion1 and subregion2, because the cooling 20
caused by ET exceeds the warming caused by the slightly lower albedo. The variability of the differences in net surface solar radiation in the growing season is induced by the variability of cloud cover rather than surface albedo. In November, December and January, the differences inT2 m vary in both directions. In high-latitude areas, incoming
solar radiation is quite small and cloud cover fraction is high in late autumn and win-25
BGD
11, 11249–11291, 2014
Biogeophysical impacts of peatland
forestation on regional climate changes in Finland
Y. Gao et al.
Title Page
Abstract Introduction
Conclusions References
Tables Figures
◭ ◮
◭ ◮
Back Close
Full Screen / Esc
Printer-friendly Version
Interactive Discussion
Discussion
P
a
per
|
Discus
sion
P
a
per
|
Discussion
P
a
per
|
Discussion
P
a
per
|
temperature inversion under a clear sky, manifesting itself as extreme cold surface air temperature. Thus, the variability of the differences in cloud cover caused by short-term variations in the climate contributes to varied differences inT2 m in this period.
The differences inT2 m for subregion3 show a warming of less than 0.1 K from DOY 91 to DOY 120, but also a warming in an even smaller magnitude throughout the grow-5
ing season. The difference in surface albedo in subregion3 is close to 0, although the difference in snow depth is similar to that of subregion2 but with a time lag of around 15 days in the most intensive point. In subregion4, the snow depth shows a quite small in-crease from the beginning of January till the end of March, which is consistent with the increase in surface albedo and explains the slight decrease of up to 0.1 K inT2 m, from
10
the middle of February till the end of March. Subregion5 displays the opposite char-acteristics compared to subregion1 and subregion2 for all the investigated variables. The absolute differences in snow depth of subregion5 are smaller than those of subre-gion1, but larger than those of subregion2. Because subregion5 is located in the north of Finland, the biggest difference of snow depth occurs later than that of subregion1. 15
The magnitude of the maximum differences inT2 min snow-cover period of subregion5
also lies between that of subregion1 and subreigon2 and happens later than that of subregion1.
The differences ofT2 m in the growing season depend on the surplus of energy
bal-ance terms, where ET manifests itself as latent heat flux. In general, the increase of 20
ET amount in subregion2 is slightly higher than that in subregion1. As a consequence, the decrease ofT2 m in subregion2 is slightly larger than that in subregion1 during the
growing season when the albedo difference is quite small. The decreased ET and the slightly decreased surface albedo together result in a slight warming in the growing season in the other subregions. The extents of warming in the other subregions fol-25
low the magnitudes of the decreased ET amounts because the differences in surface albedo are almost the same in the growing season.
BGD
11, 11249–11291, 2014
Biogeophysical impacts of peatland
forestation on regional climate changes in Finland
Y. Gao et al.
Title Page
Abstract Introduction
Conclusions References
Tables Figures
◭ ◮
◭ ◮
Back Close
Full Screen / Esc
Printer-friendly Version
Interactive Discussion
Discussion
P
a
per
|
Discus
sion
P
a
per
|
Discussion
P
a
per
|
Discussion
P
a
per
|
the dormancy season, when they are close to 0 mm day−1. In the growing season, the
increase in precipitation of subregion1 occurs during a longer period and has a larger magnitude than that of subregion2. There are slight increases in the precipitation in subregion3 and also in subregion4, whereas the precipitation of subregion5 shows a decreasing tendency in the growing season, with the biggest differences less than 5
0.2 mm day−1.
Furthermore, the maximum and minimum differences of gridpoint-wise and region-ally averaged 11 day running mean ofT2 m over 15 years for subregion1 were
investi-gated as complements for the regionally averaged 15 year mean differences of subre-gion1 (Fig. 9).T2 m shows a maximum difference in gridpoint-wise of nearly 2 K in the 10
snow-melting period over the 15 years, which is 1 K higher than the maximum diff er-ence in regionally averagedT2 m over the 15 years and four times as much as that in the 15 year mean of regionally averagedT2 m. The timings of the three kinds of max-imum differences in spring deviate from each other from 3 to 10 days. The minimum differences show only a small deviation between the gridpoint-wise and regional mean 15
values over the 15 years. During the snow-melting period, the minimum differences of regionally averagedT2 m is above 0, but not the gridpoint-wiseT2 m. The springtime
differences between regional mean and gridpoint-wise extremes elucidate that, even within one subregion with homogenous characteristics related to peatland forestation, the spring warming ofT2 mis temporally and spatially heterogeneous. This implies that
20
local effects are more pronounced than the regional and temporal statistics can re-veal. For the rest of the year, the differences between the maximum (minimum) of the gridpoint-wise and regionally averagedT2 m are small and of more regional nature. In
the period between November and January, the large variations of maximum (mini-mum)T2 m are contributed by the inversion effects due to short-term variations in the 25
climate.
BGD
11, 11249–11291, 2014
Biogeophysical impacts of peatland
forestation on regional climate changes in Finland
Y. Gao et al.
Title Page
Abstract Introduction
Conclusions References
Tables Figures
◭ ◮
◭ ◮
Back Close
Full Screen / Esc
Printer-friendly Version
Interactive Discussion
Discussion
P
a
per
|
Discus
sion
P
a
per
|
Discussion
P
a
per
|
Discussion
P
a
per
|
One is between the maximum temperature difference day (DOY) and the maximum surface albedo difference day (DOY). The other is between the inflection day of total albedo (that is, the day when surface albedo just finishes a fast decrease from its wintertime level, DOY) and the snow clearance day (DOY). The maximum temperature difference days match with maximum albedo difference days in 6 years, and the rest of 5
the years generally show a delayed maximum temperature difference day compared to the maximum albedo difference day, with a maximum deviation of 14 days. In general, the snow clearance day correlates well with the inflection point of surface albedo. For most years, the differences are less than 6 days, but three years show differences up to around 20 days. In those years, sporadic snowfall with a small accumulated snow 10
depth cannot really introduce differences in total surface albedo over the subregion but influences the determination of the snow clearance day.
5 Discussion
The differences in temperature and precipitation, as well as the closely related vari-ables such as surface albedo, snow depth, net surface solar radiation and ET are 15
examined in this study to evaluate the peatland forestation effects through changes in biogeophysical characteristics. Surface albedo shows a decrease of up to 0.064 in peatland forestation areas during snow-cover period and a slight decrease in the growing season, whereas LAI, roughness length, fractional green vegetation cover and forest ratio increase throughout the year after peatland forestation. Those changes lead 20
to an increase in springtimeT2 m, which occurs locally in accordance with the decrease
in surface albedo. In the growing season, an increase in ET related to the increased LAI and fractional green vegetation cover leads to more energy consumed by latent heat flux than gained by slightly lower albedo. Additionally, higher roughness length can play a role by increasing turbulent mixing and consequently the magnitudes of 25
BGD
11, 11249–11291, 2014
Biogeophysical impacts of peatland
forestation on regional climate changes in Finland
Y. Gao et al.
Title Page
Abstract Introduction
Conclusions References
Tables Figures
◭ ◮
◭ ◮
Back Close
Full Screen / Esc
Printer-friendly Version
Interactive Discussion
Discussion
P
a
per
|
Discus
sion
P
a
per
|
Discussion
P
a
per
|
Discussion
P
a
per
|
is basically controlled by large-scale meteorology. From the analysis of the results in the five subregions, the differences in the climate variables show that their magnitudes depend on the extent of land cover changes, while the timings of the extremes mostly depend on geographical locations (latitudes) that define the radiation balance through the seasonal cycle. Results also illustrate a positive feedback induced by peatland 5
forestation between lower surface albedo and warmerT2 min the snow-melting period.
The warming caused by lower surface albedo in snow-cover period due to more forest leads to a quicker and earlier snow melting; meanwhile, the surface albedo is reduced and consequently the surface air temperature is increased. Additionally, the maximum difference in the gridpoint-wise 11 day running mean of T2 m in spring warming period
10
over the 15 years reaches 2 K in subregion1, which is four times of the 15 year mean of the corresponding regionally averaged values. This illustrates that the spring warming effect from peatland forestation is highly heterogeneous spatially and temporally.
To examine the realism of the simulated surface air temperature differences due to peatland forestation, monthly temperature trends over 40 years (1959–1998) were cal-15
culated linearly based on monthly mean temperature maps over Finland, which were interpolated from observational data and in 10 km resolution (Aalto et al., 2013). The observation based on temperature trends show around 0.1 K decade−1stronger spring
warming in the peatland forestation area in the middle west of Finland than the sur-rounding areas in February, March and April (Fig. 11), which is consistent with the 20
simulatedT2 m. However, while the observations show the largest warming in March, the modelled difference inT2 m is largest in April. This is because of the cold
tempera-ture bias in the dormancy season in REMO simulations over this domain (Gao et al., 2014). The negative temperature differences in the simulations for the two areas in the north of Finland are mainly due to imperfections in the FNFI-based land cover maps. 25
BGD
11, 11249–11291, 2014
Biogeophysical impacts of peatland
forestation on regional climate changes in Finland
Y. Gao et al.
Title Page
Abstract Introduction
Conclusions References
Tables Figures
◭ ◮
◭ ◮
Back Close
Full Screen / Esc
Printer-friendly Version
Interactive Discussion
Discussion
P
a
per
|
Discus
sion
P
a
per
|
Discussion
P
a
per
|
Discussion
P
a
per
|
The differences in simulated net surface solar radiation averaged over subregion1 (Fig. 8) agrees rather well with the general trend of differences in net surface solar radi-ation calculated from observradi-ational data between peatland areas and closed forested areas in southern and northern Finland in Lohila et al. (2010), except for the varia-tions in the growing season. The maximum differences in the observed net surface 5
solar radiation in north and south of Finland are around 40 W m−2 (on DOY 70) and 80 W m−2 (on DOY 120), respectively. The maximum difference of 6.5 W m−2 occurs on DOY 107 in the simulated net surface solar radiation averaged over subregion1. Only around 20 % of subregion1 changed from peatland to forests, which probably explains the smaller magnitude of the maximum differences in the simulated results. 10
Thus, supposing peatland forestation would have occurred on the entire subregion1, the maximum difference in net surface solar radiation could be roughly estimated to be five times larger and reach 32.5 W m−2. The timing of the maximum difference in simulated results agrees better with observational data for northern Finland because of the cold temperature bias in the dormancy season. The evolution of the differences 15
in both simulated and observation based net surface solar radiation in spring can be divided into three phases: a slow increase, a quick increase and a quick drop. For the simulated net surface solar radiation, the slow increase occurs from the beginning of January until the end of March, and appears to be mostly induced by the differences in snow depth on land cover classes. The following quick increase occurs in a much 20
shorter period in April, within 10 to 20 days. The quick drop of the differences in net surface solar radiation follows the strong decrease of snow cover. The quick increase and quick drop are mainly attributed to snow melting, which is very sensitive to warmed air temperature.
There are a number of model uncertainties affecting the outcome of this work. Al-25
BGD
11, 11249–11291, 2014
Biogeophysical impacts of peatland
forestation on regional climate changes in Finland
Y. Gao et al.
Title Page
Abstract Introduction
Conclusions References
Tables Figures
◭ ◮
◭ ◮
Back Close
Full Screen / Esc
Printer-friendly Version
Interactive Discussion
Discussion
P
a
per
|
Discus
sion
P
a
per
|
Discussion
P
a
per
|
Discussion
P
a
per
|
mean summertime albedo for Coniferous Forest is only 0.079 in Hollinger et al. (2010), while it is 0.119 in our study. We used a summer albedo for Broad-leaved Forest of 0.146, which is higher than the albedo values for Deciduous in Kuusinen et al. (2013), but it is still lower compared to 0.156 for aspen in Betts and Ball (1997) and 0.152 for deciduous in Hollinger et al. (2010). The cropland albedo is 0.189 in Hollinger 5
et al. (2010), and it is much higher than the cropland albedo of 0.156 used in our study. In the middle boreal zone of Finland, the albedo of Peat Bogs and the albedo of forest are, on average, 0.145 and 0.115 in Solantie (1988), respectively. Thus, compared to those values, our lower albedo for Peat Bogs and higher albedo for forest (even only considering Coniferous Forest) may underestimate the warming effect contributed by 10
more absorbed solar radiation. However, it is hard to say because higher temperatures could enhance ET. Furthermore, even albedo values of same land cover class could be different in different parts of Finland. In Solantie (1988), the mean albedo of barren bogs in southern Finland and of the concentric raised bogs in the middle of Finland is only 0.128. Also, recent studies show that forest albedo is influenced by stand density 15
and understory in different sites (Bernier et al., 2011).
In wintertime, the snow albedo scheme is much more important than the background albedo in determining the surface albedo for high-latitude areas. The snow albedo scheme in REMO does not adequately represent the complex conditions over forests, with the linear dependence on snow surface temperature. Snow properties and canopy 20
conditions, such as snow water content, grain size and snow pack thickness, as well as impurities on the snow surface, have a strong influence on snow albedo (Wiscombe and Warren, 1980). Moreover, there is no vertical structure of forests in REMO where the process of snow intercepted by canopy is crucial (Roesch et al., 2001). The canopy of forests is also important in causing a night-time warming by the shelter effect in areas 25
BGD
11, 11249–11291, 2014
Biogeophysical impacts of peatland
forestation on regional climate changes in Finland
Y. Gao et al.
Title Page
Abstract Introduction
Conclusions References
Tables Figures
◭ ◮
◭ ◮
Back Close
Full Screen / Esc
Printer-friendly Version
Interactive Discussion
Discussion
P
a
per
|
Discus
sion
P
a
per
|
Discussion
P
a
per
|
Discussion
P
a
per
|
land cover maps. This can lead to underestimation of the surface runoffbecause the differences between the two surface parameters, Wmax andWmin are smaller over the model domain compared to those when using a 10 times finer resolution to represent the subgrid hydrologic heterogeneity with GLCCD or CLC (2006). The influence on surface runoffcould also affect the precipitation and ET through soil moisture and be 5
related to energy fluxes (Hagemann et al., 2013).
Furthermore, uncertainties can also arise from the FNFI land cover maps due to sampling and the translations between land cover classes in different land cover maps.
6 Summary
To get a clear picture of the peatland forestation effects on the climate in Finland is im-10
portant for future forest management to consider economic aspects and global warm-ing mitigation. In this paper, we investigated the long-term biogeophysical effects of peatland forestation on near-surface climate conditions in Finland by using a historical (1920s) and a present-day (2000s) land-use map based on Finnish National Forest Inventory data in a regional climate model REMO. The differences between the two 15
simulations in surface air temperature and precipitation were examined. The results show that peatland forestation induces a spring warming effect and a slight cooling effect in the growing season, but a varied pattern with less than 10 mm month−1diff er-ences in precipitation over Finland from April to September. The temperature response in spring in simulation results is well in line with that seen in observational maps. In 20
the most intensive peatland forestation area in the middle west of Finland, the monthly averaged daily mean surface air temperature shows a warming effect of around 0.2 K in February and March and up to 0.43 K in April, whereas a cooling effect of, in general, less than 0.1 K is found from May till October. Consequently, the snow clearance days in model gridboxes over that area are advanced up to 5 days in the mean of 15 years. Fur-25
run-BGD
11, 11249–11291, 2014
Biogeophysical impacts of peatland
forestation on regional climate changes in Finland
Y. Gao et al.
Title Page
Abstract Introduction
Conclusions References
Tables Figures
◭ ◮
◭ ◮
Back Close
Full Screen / Esc
Printer-friendly Version
Interactive Discussion
Discussion
P
a
per
|
Discus
sion
P
a
per
|
Discussion
P
a
per
|
Discussion
P
a
per
|
ning means of simulated temperature, surface albedo, net surface solar radiation and snow depth, as well as precipitation and ET, were averaged over 15 years. Results show a positive feedback induced by peatland forestation between decreased surface albedo and increased surface air temperature in the snow-melting period. Overall, de-creased albedo in the snow-melting period and inde-creased ET in the growing period 5
as a result of peatland forestation are the most important biogeophysical aspects that cause changes in surface air temperature. The extent of these climate effects depends on the intensity and geological locations of peatland forestation.
In the future, for the aim of getting a more precise assessment of the biogeophysi-cal impacts of peatland forestation on regional climate conditions, more accurate land 10
cover maps and land surface parameters are essential. Also, a more robust land sur-face scheme could enhance the representation of interactions between land sursur-face and climate.
Appendix A: Methods in deriving FNFI land cover maps
The sample of FNFI1 (1921–1924) consisted of inventory lines oriented from south-15
west to northeast at a distance of 26 km across most parts of the country. The total length of measured lines was 13 348 km, and the total number of assessed land fig-ures was 93 922. In the CLC-classification method, mean tree height and crown cover are two important criteria for classifying land-use classes. However, because crown cover was not measured in FNFI1, the growing stock volume corresponding to crown 20
cover thresholds were estimated using naturally regenerated forests and unditched pine mires in FNFI9 (1996–2003) and in FNFI10 (2004–2010), according to vegetation zone, site type, mean height and dominant tree species. Afterwards, fractions of the ten land cover classes that were used in this study were derived for the FNFI1 sample in FNFI1 by considering land-use class, estimated growing stock volume classes, mean 25
BGD
11, 11249–11291, 2014
Biogeophysical impacts of peatland
forestation on regional climate changes in Finland
Y. Gao et al.
Title Page
Abstract Introduction
Conclusions References
Tables Figures
◭ ◮
◭ ◮
Back Close
Full Screen / Esc
Printer-friendly Version
Interactive Discussion
Discussion
P
a
per
|
Discus
sion
P
a
per
|
Discussion
P
a
per
|
Discussion
P
a
per
|
For the interpolation, the FNFI1 sample lines were split into slices with 1 km intervals in a S-N direction. The fractions of the ten land cover classes in each slice on inventory line (1380 m on average) were then used in calculating sample variograms. These sample variograms are fitted into a variogram model to derive kriging predictions using the R version 2.15.2 package gstat (Pebesma, 2004; R Core Team, 2012). The block 5
kriging was carried out separately for the fraction of each of the ten land cover classes with isotropic exponential (or spherical) variogram model and a block size of 50 km×
50 km. A raster map in 3 km resolution was then produced for the coverage of the ten land cover classes.
In FNFI10, a systematic cluster sample (more details can be found at http://www. 10
metla.fi/ohjelma/vmi/vmi10-otanta-en.htm) of 69 388 plots was measured (Korhonen et al., 2013). The distance between clusters of plots (10–14 plots/cluster) varied be-tween 5 km (in southern Finland) and 11 km (in northern Finland). The classification of FNFI10 dataset was processed in a similar way to the FNFI1 data, with the exception that crown cover thresholds for classifying land-use classes can be used directly in 15
FNFI10 because it is assessed. To derive the 3 km×3 km grid map, the cluster means of the proportions of the ten land cover classes were first calculated and then the same interpolation method was used as for FNFI1.
Acknowledgement. The study was funded by Helsinki University Centre for Environment
(HENVI). We are also grateful to Stefan Weiher from Brandenburg Technical University, Ger-20
many, and Stefan Hagemann from Max Planck Institute for Meteorology, Germany, for their valuable comments on this work.
References
Aalto, J., Pirinen, P., Heikkinen, J., and Venäläinen, A.: Spatial interpolation of monthly climate data for Finland: comparing the performance of kriging and generalized additive models, 25
BGD
11, 11249–11291, 2014
Biogeophysical impacts of peatland
forestation on regional climate changes in Finland
Y. Gao et al.
Title Page
Abstract Introduction
Conclusions References
Tables Figures
◭ ◮
◭ ◮
Back Close
Full Screen / Esc
Printer-friendly Version
Interactive Discussion
Discussion
P
a
per
|
Discus
sion
P
a
per
|
Discussion
P
a
per
|
Discussion
P
a
per
|
Bala, G., Caldeira, K., Wickett, M., Phillips, T. J., Lobell, D. B., Delire, C., and Mirin, A.:
Com-bined climate and carbon-cycle effects of large-scale deforestation, P. Natl. Acad. Sci. USA,
104, 6550–6555, 2007.
Bathiany, S., Claussen, M., Brovkin, V., Raddatz, T., and Gayler, V.: Combined biogeophysical
and biogeochemical effects of large-scale forest cover changes in the MPI earth system
5
model, Biogeosciences, 7, 1383–1399, doi:10.5194/bg-7-1383-2010, 2010.
Bernier, P. Y., Desjardins, R. L., Karimi-Zindashty, Y., Worth, D., Beaudoin, A., Luo, Y., and Wang, S.: Boreal lichen woodlands: a possible negative feedback to climate change in east-ern North America, Agr. Forest Meteorol., 151, 521–528, 2011.
Betts, A. K. and Ball, J. H.: Albedo over the boreal forest, J. Geophys. Res.-Atmos., 102, 28901– 10
28909, 1997.
Betts, R. A.: Offset of the potential carbon sink from boreal forestation by decreases in surface
albedo, Nature, 408, 187–190, 2000.
Betts, R. A., Falloon, P. D., Goldewijk, K. K., and Ramankutty, N.: Biogeophysical effects of land
use on climate: model simulations of radiative forcing and large-scale temperature change, 15
Agr. Forest Meteorol., 142, 216–233, 2007.
Bonan, G. B.: Forests and climate change: forcings, feedbacks, and the climate benefits of forests, Science, 320, 1444–1449, 2008.
Claussen, M., Lohmann, U., Roeckner, E., and Schulzweida, U.: A global data set of land-surface parameters, MPI Report No. 135, Max Planck Institute for Meteorology, Hamburg, 20
Germany, 33 pp., 1994.
Déqué, M., Jones, R. G., Wild, M., Giorgi, F., Christensen, J. H., Hassell, D. C., Vidale, P. L., Rockel, B., Jacob, D., Kjellström, E., De Castro, M., Kucharski, F., and Van den Hurk, B.: Global high resolution versus Limited Area Model climate change projections over Eu-rope: quantifying confidence level from PRUDENCE results, Clim. Dynam., 25, 653–670, 25
doi:10.1007/s00382-005-0052-1, 2005.
Davies, H. C.: A laterul boundary formulation for multi-level prediction models, Q. J. Roy. Meteor. Soc., 102, 405–418, 1976.
Dümenil, L. and Todini, E.: A rainfall-runoff scheme for use in the Hamburg climate model,
in: Advances in Theoretical Hydrology-a Tribute to James Dooge, European Geophysical 30
Society Series on Hydrological Sciences, 1, edited by: O’Kane, J. P., Elsevier Science, Am-sterdam, The Netherlands, 9, 129–157, 1992.
BGD
11, 11249–11291, 2014
Biogeophysical impacts of peatland
forestation on regional climate changes in Finland
Y. Gao et al.
Title Page
Abstract Introduction
Conclusions References
Tables Figures
◭ ◮
◭ ◮
Back Close
Full Screen / Esc
Printer-friendly Version
Interactive Discussion
Discussion
P
a
per
|
Discus
sion
P
a
per
|
Discussion
P
a
per
|
Discussion
P
a
per
|
Feddema, J. J., Oleson, K. W., Bonan, G. B., Mearns, L. O., Buja, L. E., Meehl, G. A., and Wash-ington, W. M.: The importance of land-cover change in simulating future climates, Science, 310, 1674–1678, 2005.
Gálos, B., Mátyás, C., and Jacob, D.: Regional characteristics of climate change altering effects
of afforestation, Environ. Res. Lett., 6, 044010, doi:10.1088/1748-9326/6/4/044010, 2011.
5
Göttel, H., Alexander, J., Keup-Thiel, E., Rechid, D., Hagemann, S., Blome, T., Wolf, A., and Jacob, D.: Influence of changed vegetations fields on regional climate simulations in the Barents Sea Region, Climatic Change, 87, 35–50, 2008.
Gao, Y., Weiher, S., Markkanen, T., Pietikäinen, J.-P., Gregow, H., Henttonen, H. M., Jacob, D., and Laaksonen, A.: Implementation of the CORINE land use classification in the regional 10
climate model REMO, Boreal Environ. Res., accepted, 2014.
Ge, J. and Zou, C.: Impacts of woody plant encroachment on regional climate in the southern Great Plains of the United States, J. Geophys. Res.-Atmos., 118, 9093–9104, 2013.
Hökkä, H., Kaunisto, S., Korhonen, K. T., Päivänen, J., Reinikainen, A., and Tomppo, E.: Suomen suometsät 1951–1994, Metsätieteen aikakauskirja, 2B, Finnish Forest Research 15
Institute, Helsinki, Finland, 201–357, 2002.
Hagemann, S.: An improved land surface parameter dataset for global and regional climate models, MPI Report No. 336, Max Planck Institute for Meteorology, Hamburg, Germany, 17 pp., 2002.
Hagemann, S. and Gates, L. D.: Improving a subgrid runoffparameterization scheme for climate
20
models by the use of high resolution data derived from satellite observations, Clim. Dynam., 21, 349–359, 2003.
Hagemann, S., Botzet, M., Dümenil, L., and Machenhauer, B.: Derivation of global GCM bound-ary conditions from 1 KM land use satellite data, MPI Report No. 289, Max Planck Institute for Meteorology, Hamburg, Germany, 34 pp., 1999.
25
Hagemann, S., Loew, A., and Andersson, A.: Combined evaluation of MPI-ESM land surface water and energy fluxes, J. Adv. Model. Earth Syst., 5, 259–286, 2013.
Hollinger, D. Y., Ollinger, S. V., Richardson, A. D., Meyers, T. P., Dail, D. B., Martin, M. E., Scott, N. A., Arkebauer, T. J., Baldocchi, D. D., Clark, K. L., Curtis, P. S., Davis, K. J., De-sai, A. R., Dragoni, D., Goulden, M. L., Gu, L., Katul, G. G., Pallardy, S. G., Paw U, K. T., 30
BGD
11, 11249–11291, 2014
Biogeophysical impacts of peatland
forestation on regional climate changes in Finland
Y. Gao et al.
Title Page
Abstract Introduction
Conclusions References
Tables Figures
◭ ◮
◭ ◮
Back Close
Full Screen / Esc
Printer-friendly Version
Interactive Discussion
Discussion
P
a
per
|
Discus
sion
P
a
per
|
Discussion
P
a
per
|
Discussion
P
a
per
|
Ilvessalo, Y.: Suomen metsät. Tulokset vuosina 1921–1924 suoritetusta valtakunnan metsien arviomisesta (summary in english: the forests of Finland. Results of the general survey of the forests of the country carried out during the years 1921–1924), Communicationes ex Instituto Quaestionum Forestalium Finlandiae 11, Valtioneuvoston kirjapaino, 1927.
Ilvessalo, Y.: Suomen metsät vuosina 1921–24 vuosiin 1951–53: kolmeen valtakunnan metsien 5
inventointiin perustuva tutkimus (the forests of Finland from 1921–24 to 1951–53. A survey based on three national forest inventories), Communicationes Instituti Forestalis Fenniae, Finnish Forest Research Institute, Helsinki, Finland, 47, 277 pp., 1956.
IPCC: Climate Change 2013: The Physical Science Basis. Working Group 1 Contribution to the Fifth Assessment Report of the Intergovernmental Panel on Climate Change, Cambridge, 10
UK and New York, NY, USA, 1535 pp., 2013.
Jacob, D. and Podzun, R.: Sensitivity studies with the regional climate model REMO, Meteorol. Atmos. Phys., 63, 119–129, 1997.
Jacob, D., Van den Hurk, B. J. J. M., Andrae, U., Elgered, G., Fortelius, C., Graham, L. P., Jackson, S. D., Karstens, U., Köpken, Chr., Lindau, R., Podzun, R., Rockel, B., Rubel, F., 15
Sass, B. H., Smith, R. N. B., and Yang, X.: A comprehensive model inter-comparison study investigating the water budget during the BALTEX-PIDCAP period, Meteorol. Atmos. Phys., 77, 19–43, 2001.
Jacob, D., Bärring, L., Christensen, O. B., Christensen, J. H., De Castro, M., Déqué, M., Giorgi, F., Hagemann, S., Hirschi, M., Jones, R., Kjellström, E., Lenderink, G., Rockel, B., Sánchez, 20
E., Schär, C., Seneviratne, S. I., Somot, S., Van Ulden, A., and Van den Hurk, B.: An inter-comparison of regional climate models for Europe: model performance in present-day cli-mate, Climatic Change, 81, 31–52, doi:10.1007/s10584-006-9213-4, 2007.
Jacob, D., Kotova, L., Lorenz, P., Moseley, C., and Pfeifer, S.: Regional climate modeling activi-ties in relation to the CLAVIER project, Idöjárás, 112, 141–153, 2008.
25
Køltzow, M.: The effect of a new snow and sea ice albedo scheme on regional climate model
simulations, J. Geophys. Res.-Atmos., 112, D07110, doi:10.1029/2006JD007693, 2007. Kaakinen E. and Salminen, P.: Mire conservation and its short history in Finland, in: Finland –
land of mires, The Finnish Environment, 23, edited by: Lindholm, T. and Heikkilä, R., Finnish Environment Institute, Helsinki, Finland, 229–238, 2006.
30