BGD
9, 14327–14364, 2012
Climate and peat accumulation over the last millennium
D. J. Charman et al.
Title Page
Abstract Introduction
Conclusions References
Tables Figures
◭ ◮
◭ ◮
Back Close
Full Screen / Esc
Printer-friendly Version
Interactive Discussion
Discussion
P
a
per
|
Dis
cussion
P
a
per
|
Discussion
P
a
per
|
Discussio
n
P
a
per
|
Biogeosciences Discuss., 9, 14327–14364, 2012 www.biogeosciences-discuss.net/9/14327/2012/ doi:10.5194/bgd-9-14327-2012
© Author(s) 2012. CC Attribution 3.0 License.
Biogeosciences Discussions
This discussion paper is/has been under review for the journal Biogeosciences (BG). Please refer to the corresponding final paper in BG if available.
Climate-related changes in peatland
carbon accumulation during the last
millennium
D. J. Charman1, D. W. Beilman2, M. Blaauw3, R. K. Booth4, S. Brewer5, F. M. Chambers6, J. A. Christen7, A. Gallego-Sala8,9,10, S. P. Harrison9,11, P. D. M. Hughes12, S. T. Jackson13, A. Korhola14, D. Mauquoy15,
F. J. G. Mitchell16, I. C. Prentice11,17, M. van der Linden18, F. De Vleeschouwer19, Z. C. Yu4, J. Alm20, I. E. Bauer21, Y. M. C. Corish16, M. Garneau22, V. Hohl1, Y. Huang23, E. Karofeld24, G. Le Roux19, J. Loisel4, R. Moschen25,
J. E. Nichols26,27, T. M. Nieminen28, G. M. MacDonald29, N. R. Phadtare30,
N. Rausch31, ¨U. Sillasoo32, G. T. Swindles33, E.-S. Tuittila14, L. Ukonmaanaho28, M. V ¨aliranta14, S. van Bellen15, B. van Geel34, D. H. Vitt35, and Y. Zhao36
1
Department of Geography, College of Life and Environmental Sciences, University of Exeter, EX4 4RJ, UK
2
Department of Geography, University of Hawai‘i M ¯anoa, Honolulu, HI 96822, USA
3
School of Geography, Archaeology and Palaeoecology, Queen’s University Belfast, Belfast BT7 1NN, UK
4
BGD
9, 14327–14364, 2012
Climate and peat accumulation over the last millennium
D. J. Charman et al.
Title Page
Abstract Introduction
Conclusions References
Tables Figures
◭ ◮
◭ ◮
Back Close
Full Screen / Esc
Printer-friendly Version
Interactive Discussion
Discussion
P
a
per
|
Dis
cussion
P
a
per
|
Discussion
P
a
per
|
Discussio
n
P
a
per
|
5
Department of Geography, University of Utah, Salt Lake City UT 84112, USA
6
Centre for Environmental Change and Quaternary Research, DNSS, University of Gloucestershire, Cheltenham, GL50 4AZ, UK
7
Centro de Investigaci ´on en Matem ´aticas, A. P. 402, 36000 Guanajuato, Gto., Mexico
8
QUEST, Department of Earth Sciences, University of Bristol, Bristol, BS8 1RJ, UK
9
School of Geographical Sciences, University of Bristol, Bristol, BS8 1SS, UK
10
Department of Earth and Ecosystem Sciences, Lund Universitet, S ¨olvegatan 12, 223 62 Lund, Sweden
11
Department of Biological Sciences, Macquarie University, North Ryde, NSW 2109, Australia
12
School of Geography, University of Southampton, Highfield, Southampton, Hants, SO17 1BJ, UK
13
Department of Botany, University of Wyoming, Laramie, WY 82071, USA
14
Department of Environmental Sciences, P.O. Box 65, University of Helsinki, 00014 Helsinki, Finland
15
School of Geosciences, University of Aberdeen, Elphinstone Road, Aberdeen AB24 3UF, UK
16
Botany Department, Trinity College Dublin, Dublin 2, Ireland
17
Grantham Institute, and Division of Ecology and Evolution, Imperial College, Silwood Park Campus, Ascot, SL5 7PY, UK
18
BIAX Consult, Hogendijk 134, 1506 AL Zaandam, The Netherlands
19
CNRS, EcoLab/Campus Ensat, Avenue de l’Agrobiopole, BP 32607, Auzeville Tolosane, 31326 Castanet-Tolosan, France
20
The Finnish Forest Research Institute, P.O. Box 68, 80101 Joensuu, Finland
21
Sir Wilfred Grenfell College, Memorial University of Newfoundland, Corner Brook, Newfoundland, A2H 6P9, Canada
22
D ´epartement de G ´eographie and Institut des Sciences de l’Environnement, Universit ´e du Qu ´ebec `a Montr ´eal, GEOTOP UQAM, C. P. 8888 Succ Centre-ville, Montr ´eal, Qu ´ebec, H3C 3P8, Canada
23
Department of Geological Sciences, Brown University, Providence, RI 02912, USA
24
University of Tartu, Institute of Ecology and Earth Sciences, Lai 40, Tartu 51005, Estonia
25
Institute of Bio- and Geosciences 3, Agrosphere, Research Centre Juelich (Forschungszentrum J ¨ulich), J ¨ulich 52428, Germany
26
BGD
9, 14327–14364, 2012
Climate and peat accumulation over the last millennium
D. J. Charman et al.
Title Page
Abstract Introduction
Conclusions References
Tables Figures
◭ ◮
◭ ◮
Back Close
Full Screen / Esc
Printer-friendly Version
Interactive Discussion
Discussion
P
a
per
|
Dis
cussion
P
a
per
|
Discussion
P
a
per
|
Discussio
n
P
a
per
|
27
Lamont-Doherty Earth Observatory at Columbia University, Palisades, NY 10964, USA
28
The Finnish Forest Research Institute, P.O. Box 18, 01301 Vantaa, Finland
29
Institute of the Environment and Department of Geography, UCLA, Los Angeles, CA 90095, USA
30
Wadia Institute of Himalayan Geology, Dehra Dun, India
31
Keltenstr. 8, 76307 Karlsbad, Germany
32
Institute of Ecology, Tallinn University, Uus-Sadama 5, Tallinn 10120, Estonia
33
School of Geography, University of Leeds, Leeds, LS2 9JT, UK
34
Institute for Biodiversity and Ecosystem Dynamics, P.O. Box 94248 1090 GE Amsterdam, The Netherlands
35
Department of Plant Biology, Southern Illinois University, Carbondale, IL 62901, USA
36
MOE Key Laboratory of West China’s Environmental System, Lanzhou University, Lanzhou, China
Received: 2 October 2012 – Accepted: 8 October 2012 – Published: 17 October 2012
Correspondence to: D. J. Charman ([email protected])
BGD
9, 14327–14364, 2012
Climate and peat accumulation over the last millennium
D. J. Charman et al.
Title Page
Abstract Introduction
Conclusions References
Tables Figures
◭ ◮
◭ ◮
Back Close
Full Screen / Esc
Printer-friendly Version
Interactive Discussion
Discussion
P
a
per
|
Dis
cussion
P
a
per
|
Discussion
P
a
per
|
Discussio
n
P
a
per
|
Abstract
Peatlands are a major terrestrial carbon store and a persistent natural carbon sink during the Holocene, but there is considerable uncertainty over the fate of peatland carbon in a changing climate. It is generally assumed that higher temperatures will in-crease peat decay, causing a positive feedback to climate warming and contributing to
5
the global positive carbon cycle feedback. Here we use a new extensive database of peat profiles across northern high latitudes to examine spatial and temporal patterns of carbon accumulation over the past millennium. Opposite to expectations, our results indicate a small negative carbon cycle feedback from past changes in the long-term ac-cumulation rates of northern peatlands. Total carbon accumulated over the last 1000 yr
10
is linearly related to contemporary growing season length and photosynthetically active radiation, suggesting that variability in net primary productivity is more important than decomposition in determining long-term carbon accumulation. Furthermore, northern peatland carbon sequestration rate declines over the climate transition from the Me-dieval Climate Anomaly (MCA) to the Little Ice Age (LIA), probably because of lower
15
LIA temperatures combined with increased cloudiness suppressing net primary pro-ductivity. Other factors including changing moisture status, peatland distribution, fire, nitrogen deposition, permafrost thaw and methane emissions will also influence future peatland carbon cycle feedbacks, but our data suggest that the carbon sequestration rate could increase over many areas of northern peatlands.
20
1 Introduction
Peatlands contain around 600 gigatonnes of carbon (Gt C) that has accumulated since the last glacial maximum in northern mid-high latitudes, tropical regions and temper-ate areas of the Southern Hemisphere, and the steady accumulation of carbon has
been a small but persistent sink for atmospheric CO2 throughout the Holocene (Yu,
25
BGD
9, 14327–14364, 2012
Climate and peat accumulation over the last millennium
D. J. Charman et al.
Title Page
Abstract Introduction
Conclusions References
Tables Figures
◭ ◮
◭ ◮
Back Close
Full Screen / Esc
Printer-friendly Version
Interactive Discussion
Discussion
P
a
per
|
Dis
cussion
P
a
per
|
Discussion
P
a
per
|
Discussio
n
P
a
per
|
is important for understanding the past and future global carbon cycle and it has gener-ally been assumed that because temperature drives increasing decay (Ise et al., 2008; Dorrepaal et al., 2009), peatlands could be part of the positive feedback from the global carbon cycle (Friedlingstein et al., 2006). A key objective in improving understanding of the global carbon cycle in climate models is to be able to simulate past observed
5
atmospheric CO2changes.
There is growing interest in the last millennium as a climate-modelling target, and es-pecially in the assessment of the sensitivity of the global carbon cycle to climate warm-ing (Abe-Ouchi and Harrison, 2009; Jungclaus et al., 2010). In the Northern Hemi-sphere, the transition from the generally warmer Medieval Climate Anomaly (MCA) to
10
the cooler Little Ice Age (LIA) (Mann et al., 2008, 2009; Jansen et al., 2007) was
associ-ated with a ca. 7–10 ppmv decline in atmospheric CO2concentration (Ahn et al., 2012).
This pattern supports the existence of a positive global climate–carbon cycle feedback, as suggested by coupled climate–carbon cycle models (Friedlingstein et al., 2006; Den-man et al., 2007). However, estimates of the magnitude of the climate sensitivity of the
15
global carbon cycle based on data from the last millennium vary from 1.7–21.4 (Frank
et al., 2010) to 40–60 ppm CO2K−1(Cox and Jones, 2008). Carbon cycle models also
vary greatly in their assessment of this feedback (Friedlingstein et al., 2006), although recent estimates (Jungclaus et al., 2010) suggest sensitivity within the lower end of this
range (3.2–12 ppm CO2K−1). The causes of the reduction in CO
2concentrations
dur-20
ing the MCA–LIA transition are poorly known, but reduced soil heterotrophic respiration is assumed to be important (Jungclaus et al., 2010; Pongratz et al., 2009). However, the models do not specifically take into account possible climate-related variations in the rate of peatland carbon sequestration.
Peatlands have sequestered and exchanged atmospheric carbon over millennia
25
(MacDonald et al., 2006; Frolking and Roulet, 2007), with the largest store in north-ern extratropical peatlands, an estimated 545 GtC (Yu et al., 2010). The annual uptake
of CO2by peatlands, previously estimated as around 0.076 GtC yr−
1
BGD
9, 14327–14364, 2012
Climate and peat accumulation over the last millennium
D. J. Charman et al.
Title Page
Abstract Introduction
Conclusions References
Tables Figures
◭ ◮
◭ ◮
Back Close
Full Screen / Esc
Printer-friendly Version
Interactive Discussion
Discussion
P
a
per
|
Dis
cussion
P
a
per
|
Discussion
P
a
per
|
Discussio
n
P
a
per
|
to 36 ppm atmospheric CO2over 1000 yr, based on a simple conversion from change
in carbon pool to atmospheric CO2 of 1 Gt C =2.123 ppm. However, over millennial
timescales, carbon uptake of this magnitude would be compensated by ocean
out-gassing processes, so that the actual effect on the atmosphere is only 20–35 % of this
total over periods of 200–2000 yr (Archer et al., 2009), or 7–12 ppm atmospheric CO2
5
over a 1000 yr period. Variations in the size of the peatland sink could therefore have
a significant cumulative effect on global atmospheric CO2concentrations over the last
millennium, of the same order of magnitude as the observed changes.
In this study, we compiled peat core data from northern peatlands to estimate changes in carbon accumulation over the last millennium and to explore the spatial
10
relationship between climate and the total size of the carbon sink accumulated over this period. Further analysis on a subset of well-dated cores allowed an analysis of temporal variation in carbon accumulation in relations to the MCA–LIA climate changes estimated from palaeoclimate records. We use these data to help understand the rela-tionships between climate and peatland carbon accumulation and to assess the
direc-15
tion and strength of the peatland carbon cycle feedback.
2 Methods
2.1 Site selection and carbon measurement
A list of Northern Hemisphere, extra-tropical peatland profiles with published and un-published carbon accumulation data was compiled (Tables 1 and 2) for sites that met
20
the following criteria:
1. At least 3 evenly spaced dates (including210Pb, tephra, spheroidal carbonaceous
particles, pollen markers or 14C (pre- or postdating the period of nuclear bomb
testing), and the uncut peat surface) and spanning the last ca. 1000 yr. Most of the sites had more than 5 dates (Table 2) but we also rejected some sites where
BGD
9, 14327–14364, 2012
Climate and peat accumulation over the last millennium
D. J. Charman et al.
Title Page
Abstract Introduction
Conclusions References
Tables Figures
◭ ◮
◭ ◮
Back Close
Full Screen / Esc
Printer-friendly Version
Interactive Discussion
Discussion
P
a
per
|
Dis
cussion
P
a
per
|
Discussion
P
a
per
|
Discussio
n
P
a
per
|
a satisfactory age-depth model could not be produced, because of age reversals or other problems.
2. Contiguous bulk density measurements at<5 cm resolution.
Application of these criteria resulted in the selection of 24 sites that were used in sub-sequent analyses of the temporal changes in carbon accumulation through the last
5
millennium (Table 2). A second tier of sites (Table 1) was used for the millennium car-bon inventory analysis against climate indices. These sites met the following criteria:
1. A basic age-depth model for the last millennium;
2. Contiguous bulk density measurements but not necessarily at high resolution.
A total of 90 sites met these criteria and were used in the climate-carbon inventory
10
analyses (Tables 1 and 2). The sites in both data sets are widely distributed geograph-ically and broadly representative of the climate space occupied by northern peatlands (Fig. 1).
Bulk density was measured on carefully cut fresh or frozen material using freeze drying or oven drying of samples of known volume. Sample sizes varied depending
15
on the sampling method and core size and sample resolution varied from 0.5 to 5 cm3
(Table 2). In all cases samples were large enough to accurately measure bulk density and were taken contiguously to enable reliable estimates of dry mass accumulation over time. Carbon density was derived from bulk density multiplied by the carbon con-tent for each sample. Where carbon data were not available we assumed that 50 %
20
of the organic fraction (measured by standard loss-on-ignition analysis at 500◦C) was
organic carbon. A carbon value of approx. 50 % is routinely used for peat (Gorham, 1991; Vitt et al., 2000) and is reasonable compared to the mean carbon content of the
nine sites for which we have measured values in this study (46.6 ±0.33), and other
studies in Western Canada (Yu et al., 2009) (51.8 %) and West Siberia (Beilman et al.,
25
BGD
9, 14327–14364, 2012
Climate and peat accumulation over the last millennium
D. J. Charman et al.
Title Page
Abstract Introduction
Conclusions References
Tables Figures
◭ ◮
◭ ◮
Back Close
Full Screen / Esc
Printer-friendly Version
Interactive Discussion
Discussion
P
a
per
|
Dis
cussion
P
a
per
|
Discussion
P
a
per
|
Discussio
n
P
a
per
|
To provide an assessment of hydrological differences among the peatlands in our
analyses we classified sites as either bogs or fens. Although differences between these
two peatland types are related to the relative influence of different water sources (i.e.
groundwater, surface water, precipitation), thresholds used for distinction between the two types are regionally varied. For our site classification, we used a relatively
conser-5
vative approach, including onlySphagnum-dominated systems that lacked vegetative
or morphological evidence of minerotrophic conditions in our “ombrotophic” category. Sites characterized as ombrotrophic included raised bogs, blanket bogs, and the ex-tensive bog systems of Western Siberia (Kremenetski et al., 2003).
2.2 Chronology and age modelling
10
All sites were 14C dated using selected above-ground plant remains, except for site
68 where bulk peat was 14C dated. For modern (post AD 1950) 14C dates, the NH1
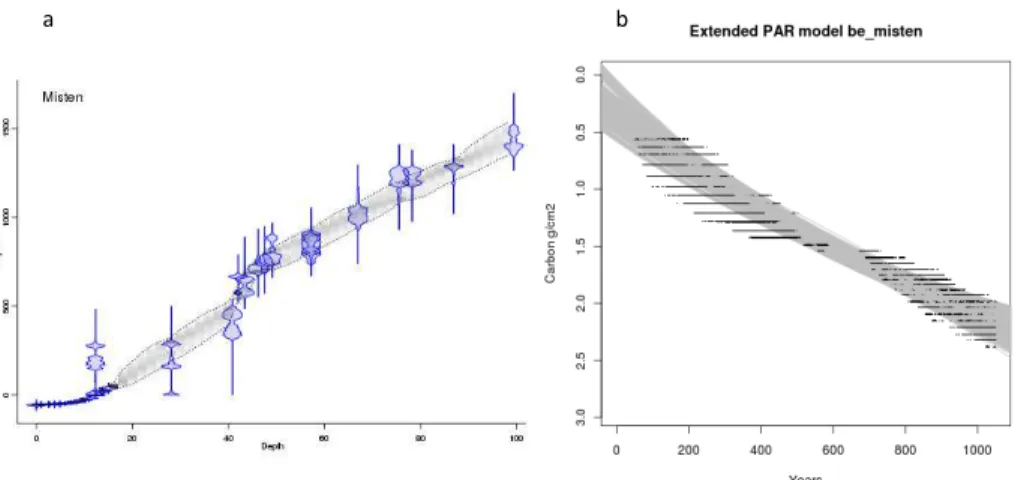
postbomb calibration curve was used (Hua and Barbetti, 2004). Remaining dates were calibrated using IntCal09 (Reimer et al., 2009). Age-models for the temporal analysis were based on the program “Bacon”, a flexible Bayesian age-depth modeling approach
15
which uses prior information on plausible accumulation rates and their variability and autocorrelation over time (Blaauw and Christen, 2005, 2011). Peat cores were divided into contiguous 2 cm segments, and linear accumulation rates were calculated for all individual segments sequentially down the core. Age-models were developed based on several million iterations, followed by thinning to remove any autocorrelation between
20
individual model runs, yielding ca. 5000–8000 iterations for each site (Fig. 2a).
2.3 Spatial analysis of carbon accumulation
Total carbon accumulation over the 1000 yr was estimated based on a data set of the 90 radiocarbon-dated peat profiles (Tables 1 and 2). The post-1000 yr carbon pool
is the difference between total carbon additions from photosynthesis and cumulative
25
BGD
9, 14327–14364, 2012
Climate and peat accumulation over the last millennium
D. J. Charman et al.
Title Page
Abstract Introduction
Conclusions References
Tables Figures
◭ ◮
◭ ◮
Back Close
Full Screen / Esc
Printer-friendly Version
Interactive Discussion
Discussion
P
a
per
|
Dis
cussion
P
a
per
|
Discussion
P
a
per
|
Discussio
n
P
a
per
|
We analysed the relationship between total carbon accumulation over the last 1000 yr
and climate parameters using a 0.5◦grid, derived from the CLIMATE 2.2 data (Kaplan
et al., 2003). Climate parameters included growing degree days above 0◦C (GDD0),
cumulative photosynthetically active radiation during the growing season (PAR0), PAR
over the growing season, growing season length (days) and the moisture index P/Eq,
5
where P is annual precipitation and Eqis annually integrated equilibrium
evapotranspi-ration calculated from daily net radiation and temperature (Prentice et al., 1993). PAR was calculated from latitude and sunshine hours (Prentice et al., 1993; Harrison et al., 2010).
2.4 Temporal variation in carbon accumulation
10
A composite carbon accumulation curve was constructed based on the subset of 24 well-dated, high-resolution sites with continuous records for the past 1000 yr (Table 2). The Bayesian age-depth models allowed chronological uncertainty to be included in carbon accumulation curves (Fig. 2b). All age depth models were converted to carbon accumulation using bulk density and carbon or LOI measurements.
15
We derived different estimates of variability in carbon accumulation rates based on
different assumptions about autogenic processes of long term decay (Clymo, 1984)
and ecosystem maturity (Yu et al., 2003). Carbon accumulation rates calculated from our age-depth models and carbon density do not take account of autogenic peat
ac-cumulation processes, most importantly the effect of long-term decay. Dead plant
ma-20
terial decays rapidly in the surface layers, as the most labile organic matter is bro-ken down quickly by microbial activity. Decomposition rates are much slower (though not zero) in the permanently saturated zone, which contains more recalcitrant organic matter (Clymo, 1984; Belyea and Baird, 2006). If productivity and decay are constant, measured apparent accumulation rates will be higher for more recent peat, and the
25
BGD
9, 14327–14364, 2012
Climate and peat accumulation over the last millennium
D. J. Charman et al.
Title Page
Abstract Introduction
Conclusions References
Tables Figures
◭ ◮
◭ ◮
Back Close
Full Screen / Esc
Printer-friendly Version
Interactive Discussion
Discussion
P
a
per
|
Dis
cussion
P
a
per
|
Discussion
P
a
per
|
Discussio
n
P
a
per
|
because of autogenic limits on the height of the peat surface (Yu et al., 2003). We excluded carbon accumulation changes in the uppermost peat (conservatively approx-imated here as peat formed after 1850) where relatively rapid aerobic decay is still taking place.
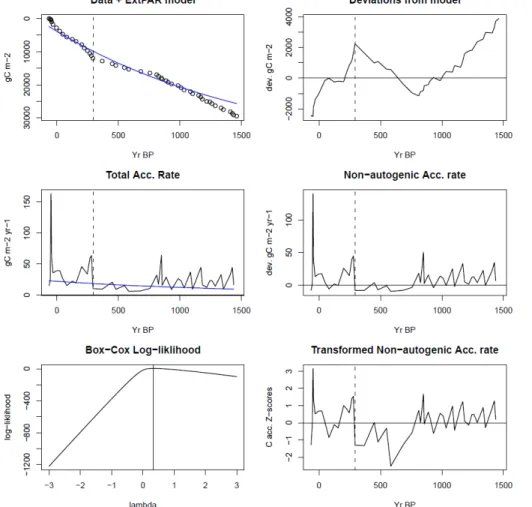
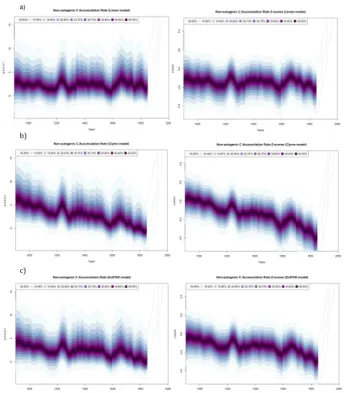
The changes in accumulation rates for each site were expressed as differences
be-5
tween observed accumulation and those derived from three models: (1) linear decay model (i.e. no autogenic processes); (2) The Clymo model, which includes long-term decay only (Clymo, 1984):
M=
P
c
ac
(1−e−act) (1)
whereM is the accumulated carbon, Pc is the peat added to the catotelm each year
10
(g C cm−2), ac is the catotelm decay constant and t is time; (3) the Extended Peat
Accumulation Rate (ExtPAR) model (Yu et al., 2003), which includes long term decay and ecosystem maturity:
M=
P
c
ac−bc
(e−bct
−e−act) (2)
where the parameters are the same as those listed above, with the addition ofbc, a
co-15
efficient that allows the accumulation rate to be modified. Each curve fitting exercise
produces estimated values for Pc, ac and bc. There are several other more complex
models that could be applied to account for long-term decay but it is often difficult or
impossible to determine the most appropriate one, given the subtle variations in the carbon accumulation curves (Belyea and Baird, 2006). Our intention here is to test
20
whether observed variations in the raw carbon accumulation data could be explained by long-term decay and ecosystem maturity.
Decay models were fit individually to each carbon accumulation curve derived from the Bacon routine. For the linear model, the fitting was carried out using ordinary least-squares. For the Clymo and ExtPAR model, optimization was carried out using an
BGD
9, 14327–14364, 2012
Climate and peat accumulation over the last millennium
D. J. Charman et al.
Title Page
Abstract Introduction
Conclusions References
Tables Figures
◭ ◮
◭ ◮
Back Close
Full Screen / Esc
Printer-friendly Version
Interactive Discussion
Discussion
P
a
per
|
Dis
cussion
P
a
per
|
Discussion
P
a
per
|
Discussio
n
P
a
per
|
iterative orthogonal sampling technique that samples the entire parameter space, then uses a least squares fit to obtain a subset of the parameter space. This subset is then sampled in the next iteration, to produce an increasingly well defined parameter space. All following analyses were applied to results from all three versions (Fig. 3).
The number of age models varied by over an order of magnitude between sites (from
5
ca. 2300 to ca. 44 000). To avoid biases towards sites with a higher number of age-models, a single age-model was randomly sampled from each site. The accumulation rates were interpolated onto a regular time step by taking the median value in a moving window (half-window of 25 yr) with a step of 10 yr, to avoid bias toward sites with higher sampling resolution. Finally, a time series of accumulation rates was calculated as the
10
median of the 24 interpolated accumulation rates (one per site). This was repeated 10 000 times to provide a fair sampling of the available age models, and gave a matrix of median time series on a regular time step. Finally, this matrix was used to calculate the median and percentile values of the accumulation rates for each time.
The effect of this Monte Carlo resampling of the possible age-models (and
asso-15
ciated accumulation rate curves) is to give greater weight to the sites with the best-constrained chronologies. In each iteration of the resampling, we took one age-model and set of accumulation rates from each site. Sites that are well-constrained will provide age-models that are similar in each iteration, and poorly constrained sites will provide
age-models that are widely different. The end result of this is that well-constrained sites
20
will effectively have a greater weight in the overall composite.
To avoid any bias toward sites with generally very high accumulation rates, a second composite was made, based on transformed values. This followed the methodology used previously for charcoal data (Marlon et al., 2010): (1) Minimax transformation of the original accumulation rate time series; (2) Box–Cox transformation to normalise the
25
time series; (3)z-score calculation. The compositez-scores were estimated using the
BGD
9, 14327–14364, 2012
Climate and peat accumulation over the last millennium
D. J. Charman et al.
Title Page
Abstract Introduction
Conclusions References
Tables Figures
◭ ◮
◭ ◮
Back Close
Full Screen / Esc
Printer-friendly Version
Interactive Discussion
Discussion
P
a
per
|
Dis
cussion
P
a
per
|
Discussion
P
a
per
|
Discussio
n
P
a
per
|
3 Results and discussion
3.1 Spatial relationships between carbon accumulation and climate
Warming would be expected to increase carbon accumulation in high-latitude ecosys-tems because net primary productivity (NPP) increases with the length of the growing season. The growing season for northern peatlands is appropriately defined as the
pe-5
riod of the year with air temperatures above freezing, because bryophytes begin pho-tosynthesis at this threshold, and are the dominant peat-former in most of our sites. Photosynthetically active radiation (PAR), determined by latitude and cloudiness, is the driver of photosynthetic carbon fixation and may also be an important control on NPP. However, higher temperatures could also increase peat decomposition rates through
10
accelerated microbial activity (Ise et al., 2008; Dorrepaal et al., 2009).
Linear regression ofCagainst PAR0 yielded the strongest relationship:
C=0.0055PAR0−3.82 (3)
with an R2 of 0.33 (Fig. 5a). In single-predictor regressions,C showed a weaker
re-lationship with GDD0 (R2= 0.13, Fig. 5b) and no significant relationship with P/Eq
15
(P =0.19, Fig. 5c). Residuals from Eq. (3) showed no systematic relation to either
GDD0 orP/Eqand inclusion of these additional predictors in a multiple linear
regres-sion yielded non-significant regresregres-sion coefficients. The correlation between PAR0 and
GDD0 is high (0.83), owing to the growing season length that is shared by both vari-ables. We checked the influence of two apparent outliers with higher PAR0 values
20
on our conclusions. These are the two southernmost sites from Dhakuri (India) and
Pinhook (USA). Removing these two sites does not affect the significance of the
rela-tionship between PAR0 and 1kaC(P <0.0001) but changes ther2 from 0.34 to 0.24
and slightly changes the slope from 0.0055 to 0.0049. Thus it is still explains more of the variation than GDD0. The influence of these two sites is not insignificant but
re-25
moving them does not impact our main conclusions concerning PAR. Without the two
BGD
9, 14327–14364, 2012
Climate and peat accumulation over the last millennium
D. J. Charman et al.
Title Page
Abstract Introduction
Conclusions References
Tables Figures
◭ ◮
◭ ◮
Back Close
Full Screen / Esc
Printer-friendly Version
Interactive Discussion
Discussion
P
a
per
|
Dis
cussion
P
a
per
|
Discussion
P
a
per
|
Discussio
n
P
a
per
|
with a change inr2from 0.18 to 0.13 and a reduction in slope from 0.0086 to 0.0073.
Again, this would not change our main conclusions.
Our analyses thus show that total carbon accumulation over the past 1000 yr is lin-early related to contemporary PAR integrated over the growing season (PAR0) (Fig. 5a) and that this relationship is stronger than that with growing season warmth expressed
5
as accumulated temperature (GDD0, growing degree days above zero) (Fig. 5b). The
implied effect of a warmer climate is to increase NPP to a greater extent than
decom-position, suggesting a negative climate feedback in peatlands. Because no relationship was found between total carbon accumulation and moisture, we infer that although an adequate moisture supply is necessary for the presence of peat, above this threshold
10
the effect on carbon accumulation is secondary relative to growing season temperature
and light conditions, at least for millennial averages over large spatial scales. Some of the unexplained variability in carbon accumulation probably reflects local hydrological factors, not captured by the large scale moisture index, as well as other local con-trols. Peatlands do not occur, for example, in climatically-suitable locations with steep
15
slopes. Local topographic and drainage features, as well as internal dynamics, create heterogeneity in peat accumulation that is not represented by our data. Furthermore, our sampling is necessarily biased toward peatlands that exist today, and we there-fore cannot establish the threshold for cessation of carbon accumulation resulting from a reduction in moisture balance. Despite these caveats, it is clear that the changes in
20
moisture balance are unlikely to be an important control on peat accumulation during the recent past.
The results suggest that spatial variability in peatland carbon accumulation over the last 1000 yr is primarily controlled by spatial variation in NPP, which in turn is driven by growing season length (related to temperature) and growing season PAR. There is
25
a statistically significant correlation between large scale spatial variability inSphagnum
moss productivity and PAR0 that supports this hypothesized mechanism (Loisel et al.,
2012). PAR0 incorporates both a PAR and temperature effect through growing
BGD
9, 14327–14364, 2012
Climate and peat accumulation over the last millennium
D. J. Charman et al.
Title Page
Abstract Introduction
Conclusions References
Tables Figures
◭ ◮
◭ ◮
Back Close
Full Screen / Esc
Printer-friendly Version
Interactive Discussion
Discussion
P
a
per
|
Dis
cussion
P
a
per
|
Discussion
P
a
per
|
Discussio
n
P
a
per
|
over the unfrozen season. The reduced r2 (0.13, p <0.0001) compared with PAR0
(r2 = 0.33), suggests that PAR has an effect independent of temperature. A much
weaker relationship with growing season length (r2 = 0.08, p <0.01) implies
grow-ing season length is of subsidiary importance. Taken together, these results support our hypothesis that peatland carbon accumulation is driven by PAR over the growing
5
season.
3.2 Temporal changes in carbon accumulation
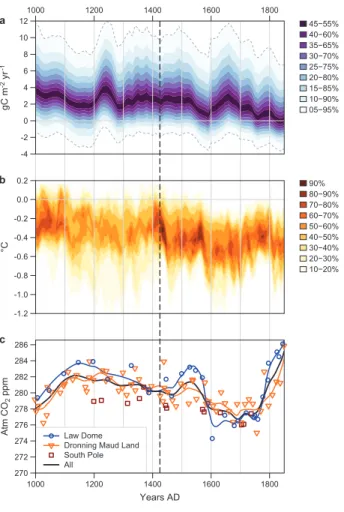
There is an overall downward trend in the composite carbon accumulation rates from
AD 1000 to 1850 (slope−0.0026 g C m−2yr−2,p <0.0001), implying reduced peat
ac-cumulation during the LIA (Fig. 6a). The downward trend is present in the raw data
10
as well as in the curves that include long-term decay and ecosystem maturity at in-dividual sites, showing that the direction of change is insensitive to any assumptions concerning long term ecosystem processes (Fig. 4). The magnitude of this change
differs depending on the time period chosen. Here we compare long term median
val-ues for the periods 1000–1425 and 1425–1850 AD, broadly corresponding to the times
15
used to define the MCA and LIA (Mann et al., 2008, 2009; Jansen et al., 2007). We
also compare the difference at the start (1000) and end (1850) of this period based
on the slope of a regression line through the data. Using both approaches means that the analyses are robust to short term fluctuations in the data. If long-term decay is
taken into account, the difference between the mean median accumulation rates
be-20
tween these two periods is 2.43 (±0.92) g C m−2yr−1. The estimate for this is smaller
(1.01±0.89 g C m−2yr−1) if some of the decay is compensated for by ecosystem
ma-turity at individual sites (Fig. 4). The difference between the start (1000) and end of the
data (1850) is 6.05±5.40 and 3.15±5.08 g C m−2yr−1 respectively for a decay only,
or decay plus ecosystem maturity model (Fig. 4). Shorter term changes in the carbon
25
BGD
9, 14327–14364, 2012
Climate and peat accumulation over the last millennium
D. J. Charman et al.
Title Page
Abstract Introduction
Conclusions References
Tables Figures
◭ ◮
◭ ◮
Back Close
Full Screen / Esc
Printer-friendly Version
Interactive Discussion
Discussion
P
a
per
|
Dis
cussion
P
a
per
|
Discussion
P
a
per
|
Discussio
n
P
a
per
|
changes are not sufficiently robust to draw firm conclusions about changes in carbon
accumulation on (sub)centennial timescales.
3.3 Climate controls on carbon accumulation
One explanation for the reduction in carbon accumulation between the MCA and LIA is that decreased temperatures reduced NPP through shorter growing seasons (reduced
5
GDD0). Shorter growing seasons would also reduce accumulated PAR0 assuming light levels remained unchanged. We tested this hypothesis by using the spatial relationship between total 1000 yr carbon accumulation and climate variables shown in Fig. 5 to
calculate the effect of MCA–LIA cooling from palaeoclimate records (Fig. 6b) on carbon
accumulation and comparing it with the observed changes in carbon accumulation
10
(Fig. 6a).
We used the IGBP-DIS soil carbon gridded dataset (http://daac.ornl.gov/SOILS/ guides/igbp-surfaces.html) to select all grid cells occupied by northern peatlands, and summed their carbon accumulation rates as predicted by PAR0 from Eq. (1) (multi-plied by the grid cell areas) to estimate the total carbon sink in northern peatlands.
15
“Peatlands” were defined as 0.5×0.5 degree grids north of 40◦N that contain 10 min
IGBP Soil C grids that are all>31 kg C m−2(Wania et al., 2009). This is conservative,
designed to focus on the biggest peatland areas that dominate the global peatland C cycle. PeatStash (Gallego-Sala et al., 2010) was used to calculate the accumulated PAR0 by summing the daily PAR0 over the growing season (days above freezing) for
20
each peatland grid cell. The daily PAR0 is obtained by integrating the instantaneous PAR between sunrise and sunset (Harrison et al., 2010). The seasonal accumulated PAR0 depends on latitude and cloudiness, and indirectly on temperature, because the temperature determines the length of the growing season, i.e. which days are included in the seasonal accumulated PAR0 calculation.
25
We calculated changes in GDD0 and PAR0 that would result from the change in temperature inferred from the palaeoclimate reconstructions over the last 1000 yr
BGD
9, 14327–14364, 2012
Climate and peat accumulation over the last millennium
D. J. Charman et al.
Title Page
Abstract Introduction
Conclusions References
Tables Figures
◭ ◮
◭ ◮
Back Close
Full Screen / Esc
Printer-friendly Version
Interactive Discussion
Discussion
P
a
per
|
Dis
cussion
P
a
per
|
Discussion
P
a
per
|
Discussio
n
P
a
per
|
calculations to those made for carbon accumulation over the same time periods. The
median temperature difference between the two periods 1000–1425 and 1425–1850
is 0.116±0.02◦C. We calculated the influence of this change in temperature on the
duration of the growing season (Fig. 7a), and applied this to the relationships between carbon accumulation, GDD0 and PAR0 derived from the spatial analysis (Fig. 5a, b).
5
Changes in PAR0 and GDD0 for each peatland grid cell were calculated by adding
0.116◦C to the input climate dataset used in PeatStash.
The results suggest that the sensitivity of GDD0 and PAR0 to temperature is too small for either of these to provide the sole explanation for the observed change in
carbon accumulation rate over the last 1000 yr. Over the peatland areas, a 0.116◦C
in-10
crease results in a mean change of+18.5 GDD0 (5–95 % range, 12.3–24.7 GDD0),
which is predicted by the regression equation to result in a mean increase of
0.16 g C m−2 yr−1 (from 0.11 to 0.21 g C m−2 yr−1). PAR0 increases by 13.5 mol
photons m−2season−1 (range 0–37.4 mol photons m−2season−1), which is predicted
by the regression equation to result in an increase of 0.07 g C m−2yr−1 (from 0 to
15
0.21 g C m−2yr−1). If the magnitude of temperature change estimated from the
North-ern Hemisphere records is assumed to be correct, it is therefore unlikely that the
ob-served changes in carbon accumulation of 1.0–2.4 g C m−2yr−1are a result of
temper-ature and growing season changes alone. The conclusion is similar if the magnitude of temperature change over the period 1000–1850 is used for this calculation. In this
20
case, a temperature change of−0.266◦C is associated with a reduction in carbon
ac-cumulation of 3.2–6.1 g C m−2yr−1. However, mean changes in GDD0 would be 43
GDD, and 31 mol photons m−2season−1in PAR0, resulting in predicted carbon
accu-mulation reductions of only 0.37 and 0.17 g C m−2yr−1 respectively. It is possible that
Northern Hemisphere averages underestimate temperature changes in peatland
re-25
gions, as estimates of maximum MCA-LIA difference range from>0.3 to as much as
1.8◦C in a few locations (Mann et al., 2009). Repeating the analysis with a larger 1◦C
BGD
9, 14327–14364, 2012
Climate and peat accumulation over the last millennium
D. J. Charman et al.
Title Page
Abstract Introduction
Conclusions References
Tables Figures
◭ ◮
◭ ◮
Back Close
Full Screen / Esc
Printer-friendly Version
Interactive Discussion
Discussion
P
a
per
|
Dis
cussion
P
a
per
|
Discussion
P
a
per
|
Discussio
n
P
a
per
|
but still less than the 1.0–1.4 g C m−2 yr−1reduction in carbon accumulation shown in
the data over the MCA-LIA.
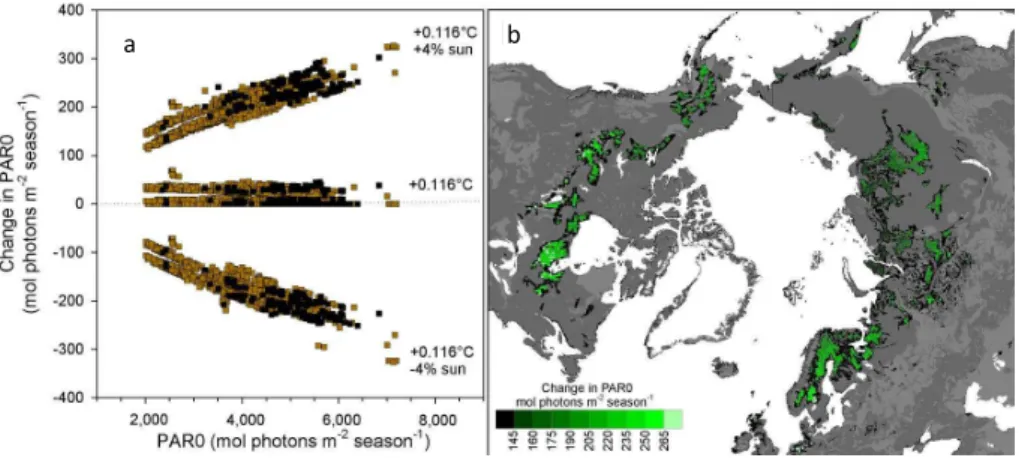
If temperature change alone is not the driver of carbon accumulation changes, an ad-ditional hypothesis is that reduced PAR from an increase in growing-season cloudiness significantly reduced NPP during the LIA causing a fall in peatland carbon
accumula-5
tion. We therefore also examined the sensitivity of PAR0 and carbon accumulation
to changes in cloudiness (Fig. 7) by altering in addition to 0.116◦C warming the
an-nual sunshine hours by a range of± percent of the input climate dataset. Sensitivity
tests (Fig. 7a) show that a 4 % increase in sunshine hours on top of the influence of
a +0.116◦C change (equivalent to 199 mol photons m−2season−1) could result in an
10
average change of +1.1 g C m−2yr−1 over the peatland areas. These are averages;
the change in PAR0 has a 5–95 % range of 137–255 mol photons m−2season−1 and
change in carbon accumulation between 0.8 and 1.4 g C m−2yr−1 for this sensitivity
analysis. A geographical pattern emerges in these simulations where greater sensi-tivity of PAR0 to temperature and cloudiness occurs in lower latitudes (Fig. 7b). The
15
existence of a positive relationship between PAR0 and peat carbon accumulation is further supported by Fig. 7a, which shows that high soil carbon grid cells in the inde-pendent soil carbon density data are located in areas with higher PAR0.
Our finding that spatial patterns of carbon accumulation can be explained by spatial variability in climate, specifically PAR0, implies that the temporal variations in carbon
20
accumulation over the last millennium may also be explained by the same climatic vari-ables. The data are consistent with this space for time substitution argument in that the warmer MCA has higher rates of carbon accumulation than the cooler LIA. I.e. longer, warmer growing seasons in the MCA increased carbon accumulation in comparison to the LIA. That the MCA was warmer than the LIA is not contested (Jansen et al.,
25
2007), but we also suggest from our sensitivity analysis, that temperature alone cannot explain the magnitude of the change in observed carbon accumulation over the last millennium. Changes in PAR received by the plants from cloudiness or some other
BGD
9, 14327–14364, 2012
Climate and peat accumulation over the last millennium
D. J. Charman et al.
Title Page
Abstract Introduction
Conclusions References
Tables Figures
◭ ◮
◭ ◮
Back Close
Full Screen / Esc
Printer-friendly Version
Interactive Discussion
Discussion
P
a
per
|
Dis
cussion
P
a
per
|
Discussion
P
a
per
|
Discussio
n
P
a
per
|
diffusivity are also required to generate the observed changes, assuming that temporal
sensitivity is the same as that derived from spatial relationships. We explored the po-tential reduction of PAR by late-lying snow cover by calculating the PAR for days without
snow and with temperature>0◦C. The correlation between snow-free PAR0 and total
carbon accumulated over the last 1000 yr was not significant (p=0.23), so cloudiness
5
is the more likely cause of change in PAR and carbon accumulation. The idea that the Northern Hemisphere LIA was characterised by greater summer cloudiness is con-sistent with historical documentary data (Grove, 2004), although recent findings from
δ13C in Fennoscandian tree ring studies suggest that there may have been regional
differentiation of this tendency (Young et al., 2010; Gagen et al., 2011).
10
3.4 Changes in the strength of the peatland carbon sink
An average decrease of 1.01 to 2.43 g C m−2
yr−1
in carbon sequestration rates in peat-lands between the MCA and the LIA represents a reduction in the strength of the sink
of 0.0035 to 0.0085 Gt C yr−1, assuming a total northern peatland area of 350 million
ha (Gorham, 1991; Tarnocai et al., 2009). This should be compared with our estimate
15
of the median net accumulation rate between 1000 and 1850 of 26.1 (sd. 1.47) g C m−2
yr−1 or 0.091 (sd. 0.005) Gt C yr−1. This latter figure is similar to the average figure
of 0.096 Gt C yr−1(29 g C m−2yr−1) estimated for the whole of the Holocene (Gorham,
1991). Neither of these figures for long-term net accumulation take into account the very slow long-term decay of the deeper peat layers. Decay of this store might reduce
20
the actual average net ecosystem carbon balance to around 0.042 Gt C yr−1(Yu, 2011)
for the last millennium, depending on how much peat had accumulated before AD 1000, its permafrost status, and its average age and long-term decay rate. Thus, a reduction
in carbon sink of 0.0035 and 0.0085 Gt C yr−1represents a decrease of about 8 % and
20 % in net ecosystem carbon balance of northern peatlands. This is an average figure
25
for the two 425-yr periods chosen to represent the MCA and LIA here. The extremes in
BGD
9, 14327–14364, 2012
Climate and peat accumulation over the last millennium
D. J. Charman et al.
Title Page
Abstract Introduction
Conclusions References
Tables Figures
◭ ◮
◭ ◮
Back Close
Full Screen / Esc
Printer-friendly Version
Interactive Discussion
Discussion
P
a
per
|
Dis
cussion
P
a
per
|
Discussion
P
a
per
|
Discussio
n
P
a
per
|
and 1850 is 5.9±5.2 to 3.9±5.1 g C m−2yr−1or 33 to 45 % reduction in the strength
of the CO2sink.
The main decrease in atmospheric CO2 concentrations of approximately 6 ppm
oc-curred over the period 1150 to 1750 (using the average curve in Fig. 6c). For this
time period the decline in peatland carbon sink is between 2.79 (±4.88) and 0.77 (±
5
4.87) g C m−2yr−1, equivalent to 0.0027 to 0.0097 Gt C yr−1 if applied to all northern
peatlands. Assuming a linear decline in strength of the peatland sink over this period,
this would represent a change equivalent to about 0.38 (±2.41) to 1.38 (±2.41) ppm
in the atmosphere. Although this is a small change, because the observed decline in
atmospheric CO2 is unequivocally attributed to increased land carbon storage by the
10
concomitant increase (Elsig et al., 2009) in theδ13C of atmospheric CO2, the reduced
carbon sequestration in northern peatlands has to be added to the amount of CO2
reduction to be explained by carbon uptake, presumably as a result of suppressed decomposition of soil organic matter or increased NPP, in other terrestrial ecosystems.
4 Conclusions and implications
15
We have shown that there has been a small negative feedback to climate from changes in Northern Hemisphere peat accumulation over the last 1000 yr. The direction of the peat accumulation – climate feedback is supported by large scale spatial patterns of peat accumulation over the past 1000 yr in relation to modern climate gradients. North-ern peatlands sequestered carbon at a higher rate during the MCA than during the
20
LIA. This suggests that carbon accumulation in northern peatlands may also change in response to future anthropogenic climate warming. Our spatial analyses indicate that
the strength of any feedback effect could depend on changes in cloud cover as well
as changes in temperature and growing season length. Continued carbon accumula-tion depends on sustained adequate moisture availability to maintain peatland growth.
25
BGD
9, 14327–14364, 2012
Climate and peat accumulation over the last millennium
D. J. Charman et al.
Title Page
Abstract Introduction
Conclusions References
Tables Figures
◭ ◮
◭ ◮
Back Close
Full Screen / Esc
Printer-friendly Version
Interactive Discussion
Discussion
P
a
per
|
Dis
cussion
P
a
per
|
Discussion
P
a
per
|
Discussio
n
P
a
per
|
projections suggest that most of the high latitudes will experience higher summer tem-perature and higher precipitation, with decreases in soil moisture for some regions (Meehl et al., 2007). Mid-latitude peatlands in locations such as Western Europe are most vulnerable, especially as summer precipitation is projected to decrease. If the threshold between presence and absence of peatlands on the gradient of
precipita-5
tion/equilibrium evapotranspiration ratio is crossed (Fig. 5c), some peatland areas (in-cluding some of the blanket bogs characteristic of extremely oceanic climates; Gallego-Sala et al., 2010; Gallego-Gallego-Sala and Prentice, 2012) may stop growing. Changes in peatland extent in response to climate change occurred in the past, including during the last millennium (Finkelstein and Cowling, 2011) and will occur in future
(Gallego-10
Sala and Prentice, 2012). Our analysis suggests that a reduction in peatland area in the mid-latitudes could be compensated by increased carbon accumulation across the very large areas of peatland in higher latitude regions, but only if the majority of these
peatlands retain sufficient moisture and there is no significant increase in cloud cover.
Current projections of cloud cover are highly uncertain for the northern peatland
re-15
gions; some areas are projected to have less cloud and others more cloud (Meehl et al., 2007). A further compensating factor for peatland loss is that peatlands may increase in extent in high-latitude areas that are currently too cold and dry for peat formation. Other major uncertainties concerning feedbacks between peatlands and climate change still exist including changes in fire regimes, nitrogen deposition, permafrost thaw and the
20
role of methane emissions. We might expect climate changes at some of the sites used in our analysis to move beyond the climate envelope explored here, and this could af-fect their contribution to the carbon budget. However, based on our analyses of carbon accumulation over the past millennium, we suggest that carbon sequestration may in-crease in many high-latitude peatlands in response to future climate warming over the
25
next century.
Acknowledgement. This paper is a contribution to the continuing work of PArCH
BGD
9, 14327–14364, 2012
Climate and peat accumulation over the last millennium
D. J. Charman et al.
Title Page
Abstract Introduction
Conclusions References
Tables Figures
◭ ◮
◭ ◮
Back Close
Full Screen / Esc
Printer-friendly Version
Interactive Discussion
Discussion
P
a
per
|
Dis
cussion
P
a
per
|
Discussion
P
a
per
|
Discussio
n
P
a
per
|
workshops in 2009 (Vihula, Estonia and Dartington, England) funded by the US National Sci-ence Foundation through a grant to S.T.J. for a Workshop on Peatland Archives of Holocene Carbon and Climate Variability (EAR-0907815), the QUEST (Quantifying and Understanding the Earth System) programme of the UK National Environmental Research Council (NERC), INQUA Project 0804, the International Geosphere-Biosphere Programme (IGBP) Past Global 5
Changes (PAGES) project and the UK Quaternary Research Association.
References
Abe-Ouchi A. and Harrison, S. P.: Constraining the carbon-cycle feedback using palaeodata: the PalaeoCarbon Modelling Intercomparison Project, EOS 90, p. 140, 2009.
Ahn, J., Brook, E. J., Mitchell, L., Rosen, J., McConnell, J. R., Taylor, K., Etheridge, D., and 10
Rubino, M.: Atmospheric CO2 over the last 1000 yr: a high-resolution record from the west antarctic ice sheet (WAIS) divide ice core, Global Biogeochem. Cy., 26, GB2027, doi:10.1029/2011GB004247, 2012.
Archer, D., Eby, M., Brovkin, V., Ridgwell, A., Cao, L., Mikolajewicz, U., Caldeira, K., Mat-sumoto, K., Munhoven, G., Montenegro, A., and Tokos, K.: Atmospheric lifetime of fossil 15
fuel carbon dioxide, Annu. Rev. Earth Pl. Sc., 37, 117–34, 2009.
Bauer, I. E., Bhatti J. S., Swanston, C., Wieder, R. K., Preston, C. M.: Organic matter accu-mulation and community change at the peatland-upland interface: inferences from14C and
210
Pb dated profiles, Ecosystems, 12, 636–653, 2009.
Beilman, D. W., MacDonald, G. M., Smith, L. C., Reimer, P. J.: Carbon accumulation in 20
peatlands of west siberia over the last 2000 yr, Global Biogeochem. Cy., 23, GB1012, doi:10.1029/2007gb003112, 2009.
Belyea, L. R. and Baird, A. J.: Beyond “the limits to peat bog growth”: cross-scale feedback in peatland development, Ecol. Monogr., 76, 299–322, 2006.
Blaauw, M. and Christen, J. A.: Radiocarbon peat chronologies and environmental change, 25
Appl. Statist., 54, 805–816, 2005.
Blaauw, M. and Christen, J. A.: Flexible paleoclimate age-depth models using an autoregres-sive gamma process, Bayesian Analysis, 6, 457–474, 2011.
BGD
9, 14327–14364, 2012
Climate and peat accumulation over the last millennium
D. J. Charman et al.
Title Page
Abstract Introduction
Conclusions References
Tables Figures
◭ ◮
◭ ◮
Back Close
Full Screen / Esc
Printer-friendly Version
Interactive Discussion
Discussion
P
a
per
|
Dis
cussion
P
a
per
|
Discussion
P
a
per
|
Discussio
n
P
a
per
|
Cox, P. and Jones, C.: Illuminating the modern dance of climate and CO2, Science, 321, 1642– 1644, 2008.
de Vleeschouwer, F., Piotrowska, N., Sikorski, J., Pawlyta, J., Cheburkin, A., Le Roux, G., Lamentowicz, M., Fagel, N., and Mauquoy, D.: Multiproxy evidence of “little ice age” palaeoenvironmental changes in a peat bog from northern poland, Holocene, 19, 625–637, 5
2009.
de Vleeschouwer, F., Sikorski, J., and Fagel, N.: Development of lead-210 measurement in peat using polonium extraction, a procedural comparison, Geochronometria, 36, 108–115, 2010. de Vleeschouwer, F., Pazdur, A., Luthers, C., Streel, M., Mauquoy, D., Wastiaux, C., Le
Roux, G., Moschen, R., Blaauw, M., Pawlyta, J., Sikorski, J., and Piotrowska, N.: A mil-10
lennial record of environmental change in peat deposits from the misten bog (East Belgium). Quatern. Int., 268, 44–57, 2012.
Denman, K. L., Brasseur, G., Chidthaisong, A., Ciais, P., Cox, P. M., Dickinson, R. E., Hauglus-taine, D., Heinze, C., Holland, E., Jacob, D., Lohmann, U., Ramachandran, S., da Silva Dias, P. L., Wofsy, S. C., and Zhang, X.: Couplings between changes in the climate system 15
and biogeochemistry, in: Climate Change 2007: The Physical Science Basis. Contribution of Working Group I to the Fourth Assessment Report of the Intergovernmental Panel on Climate Change, edited by: Solomon, S. et al., Cambridge University Press, Cambridge, 499–587, 2007.
Dorrepaal, E., Toet, S., van Logtestijn, R. S. P., Swart, E., van de Weg, M. J., Callaghan, T. V., 20
and Aerts, R.: Carbon respiration from subsurface peat accelerated by climate warming in the subarctic, Nature, 460, 616–619, 2009.
Elsig, J., Schmitt, J., Leuenberger, D., Schneider, R., Eyer, M., Leuenberger, M., Joos, F., Fi-scher, H., and Stocker, T. F.: Stable isotope constraints on Holocene carbon cycle changes from an Antarctic ice core, Nature, 461, 507–510, 2009.
25
Finkelstein, S. A. and Cowling, S. A.: Wetlands, temperature, and atmospheric CO2 and CH4 coupling over the past two millennia, Global Biogeochem. Cy., 25, GB1002, doi:10.1029/2010GB003887, 2011.
Frank, D. C., Esper, J., Raible, C. C., B ¨untgen, U., Trouet, V., Stocker, B., and Joos, F. : Ensem-ble reconstruction constraints on the global carbon cycle sensitivity to climate, Nature, 63, 30
527–530, 2010.
BGD
9, 14327–14364, 2012
Climate and peat accumulation over the last millennium
D. J. Charman et al.
Title Page
Abstract Introduction
Conclusions References
Tables Figures
◭ ◮
◭ ◮
Back Close
Full Screen / Esc
Printer-friendly Version
Interactive Discussion
Discussion
P
a
per
|
Dis
cussion
P
a
per
|
Discussion
P
a
per
|
Discussio
n
P
a
per
|
Lindsay, K., Matthews, H. D., Raddatz, T., Rayner, P., Reick, C., Roeckner, E., Schnitzler, K.-G., Schnur, R., Strassmann, K., Weaver, A. J., Yoshikawa, C., and Zeng, N.: Climate–carbon cycle feedback analysis: results from the C4MIP model intercomparison, J. Climate, 19, 3337–3353, 2006.
Frolking, S. and Roulet, N. T.: Holocene radiative forcing impact of northern peatland carbon 5
accumulation and methane emission, Glob. Change Biol., 13, 1079–1088, 2007.
Gagen, M., Zorita, E., McCarroll, D., Young, G. H. F., Grudd, H., Jalkanen, R., Loader, N. J., Robertson, I., and Kirchhefer, A.: Cloud response to summer temperatures in Fennoscandia over the last thousand years, Geophys. Res. Lett., 38, L05701, doi:10.1029/2010gl046216, 2011.
10
Gallego-Sala, A. V. and Prentice, I. C.: Blanket peat biome endangered by climate change, Nature Clim. Change, doi:10.1038/nclimate1672, 2012.
Gallego-Sala, A. V., Clark, J. M., House, J. I., Orr, H. G., Prentice, I. C., Smith, P., Farewell, T., and Chapman, S. J.: Application of a global bioclimatic envelope model to assess the impact of climate change on the distribution of blanket peatlands in Great Britain, Climate Res. 34, 15
C911, doi:10.3354/cr00911, 2010.
Gorham, E.: Northern peatlands, role in the carbon cycle and probable responses to climatic warming, Ecol. Appl., 1, 182–195, 1991.
Grove, J. M.: Little Ice Ages. Ancient and Modern, Routledge, London, 2004.
Harrison, S. P., Prentice, I. C., Barboni, D., Kohfeld, K. E., Ni, J., and Sutra, J. P. : Ecophysio-20
logical and bioclimatic foundations for a global plant functional classification, J. Veg. Sci., 21, 300–317, 2010.
Hua, Q. and Barbetti, M.: Review of tropospheric bomb 14C data for carbon cycle modeling and age calibration purposes, Radiocarbon, 46, 1273–1298, 2004.
Hughes, P. D. M., Blundell, A., Charman, D. J., Bartlett, S., Daniell, J. R. G., Wojatschke, A., 25
and Chambers, F. M.: An 8500 cal. year multi-proxy climate record from a bog on Bonav-ista North Peninsula, Newfoundland: contributions of melt-water discharge and solar forcing, Quaternary Sci. Rev., 25, 1208–1227, 2006.
Ise, T., Dunn, A. L., Wofsy, S. C., Moorcroft, P. R.: High sensitivity of peat decomposition to climate change through water-table feedback, Nat Geosci., 1, 763–766, 2008.
30
BGD
9, 14327–14364, 2012
Climate and peat accumulation over the last millennium
D. J. Charman et al.
Title Page
Abstract Introduction
Conclusions References
Tables Figures
◭ ◮
◭ ◮
Back Close
Full Screen / Esc
Printer-friendly Version
Interactive Discussion
Discussion
P
a
per
|
Dis
cussion
P
a
per
|
Discussion
P
a
per
|
Discussio
n
P
a
per
|
Science Basis. Contribution of Working Group I to the Fourth Assessment Report of the Inter-governmental Panel on Climate Change, edited by: Solomon, S. et al., Cambridge, University Press, Cambridge, 433–497, 2007.
Jungclaus, J. H., Lorenz, S. J., Timmreck, C., Reick, C. H., Brovkin, V., Six, K., Segschneider, J., Giorgetta, M. A., Crowley, T. J., Pongratz, J., Krivova, N. A., Vieira, L. E., Solanki, S. K., 5
Klocke, D., Botzet, M., Esch, M., Gayler, V., Haak, H., Raddatz, T. J., Roeckner, E., Schnur, R., Widmann, H., Claussen, M., Stevens, B., and Marotzke, J.: Climate and carbon-cycle variability over the last millennium, Clim. Past, 6, 723–737, doi:10.5194/cp-6-723-2010, 2010.
Kaplan, J. O., Bigelow, N. H., Bartlein, P. J., Christensen, T. R., Cramer, W., Harrison, 10
S. P., Matveyeva, N. V., McGuire, A. D., Murray, D. F., Prentice, I. C., Razzhivin, V. Y., Smith, B., Walker, D. A., Anderson, P. M., Andreev, A. A., Brubaker, L. B., Edwards, M. E., Lozhkin, A. V., and Ritchie, J.: Climate change and Arctic ecosystems II: Modeling, palaeodata-model comparisons, and future projections, J. Geophys. Res. Atmos., 108, 8171, doi:10.1029/2002JD002559, 2003.
15
Kremenetski, K. V., Velichko, A. A., Borisova, O. K., MacDonald, G. M., Smith, L. C., Frey, K. E., and Orlova, L. A.: Peatlands of the west siberian lowlands: current knowledge on zonation, carbon content and late quaternary history, Quaternary Sci. Rev. 22, 703–723, 2003. Le Roux, G., Aubert, D., Stille, P., Krachler, M., Kober, B., Cheburkin, A., Bonani, G., and
Shotyk, W.: Recent atmospheric Pb deposition at a rural site in southern germany assessed 20
using a peat core and snowpack, and comparison with other archives, Atmos. Environ., 39, 6790–6801, 2005.
Loisel, J., Gallego-Sala, A. V., and Yu, Z.: Global-scale pattern of peatland sphagnum growth driven by photosynthetically active radiation and growing season length, Biogeosciences Discuss., 9, 2169–2196, doi:10.5194/bgd-9-2169-2012, 2012.
25
MacDonald, G. M., Beilman, D. W., Kremenetski, K. V., Sheng, Y. W., Smith, L. C., and Velichko, A. A.: Rapid early development of circumarctic peatlands and atmospheric CH4 and CO2variations, Science, 314, 285–288.
Mann, M. E., Zhang, Z. H., Hughes, M. K., Bradley, R. S., Miller, S. K., Rutherford, S., and Ni, F. B.: Proxy-based reconstructions of hemispheric and global surface temperature varia-30
BGD
9, 14327–14364, 2012
Climate and peat accumulation over the last millennium
D. J. Charman et al.
Title Page
Abstract Introduction
Conclusions References
Tables Figures
◭ ◮
◭ ◮
Back Close
Full Screen / Esc
Printer-friendly Version
Interactive Discussion
Discussion
P
a
per
|
Dis
cussion
P
a
per
|
Discussion
P
a
per
|
Discussio
n
P
a
per
|
Mann, M. E., Zhang, Z. H., Rutherford, S., Bradley, R. S., Hughes, M. K., Shindell, D., Am-mann, C., Faluvegi, G., and Ni, F. B.: Global signatures and dynamical origins of the little ice age and medieval climate anomaly, Science, 326, 1256–1260, 2009.
Marlon, J. R., Bartlein, P. J., Carcaillet, C., Gavin, D. G., Harrison, S. P., Higuera, P. E., Joos, F., Power, M. J., and Prentice, I. C.: Climate and human influences on global biomass burning 5
over the past two millennia, Nat. Geosci., 1, 697–702, 2008.
Mauquoy, D., Engelkes, T., Groot, M. H. M., Markesteijn, F., Oudejans, M. G., van der Plicht, J., and van Geel, B.: High-resolution records of late Holocene climate change and carbon ac-cumulation in two North-West European ombrotrophic peat bogs, Palaeogeogr. Palaeoecol., 186, 275–310, 2002.
10
Meehl, G. A., Stocker, T. F., Collins, W. D., Friedlingstein, P., Gaye, A. T., Gregory, J. M., Ki-toh, A., Knutti, R., Murphy, J. M., Noda, A., Raper, S. C. B., Watterson, I. G., Weaver A. J., and Zhao, Z.-C.: Global climate projections, in: Climate Change 2007: The Physical Science Basis. Contribution of Working Group I to the Fourth Assessment Report of the Intergov-ernmental Panel on Climate Change, edited by: Solomon, S. et al., Cambridge Univ. Press, 15
Cambridge, 747–845, 2007.
Moschen, R., K ¨uhl, N., Rehberger, I., and L ¨ucke, A.: Stable carbon and oxygen isotopes in sub-fossil sphagnum: assessment of their applicability for palaeoclimatology, Chem. Geol., 259, 262–272, 2009.
Pongratz, J., Reick, C. H., Raddatz, T., and Claussen, M.: Effects of anthropogenic land cover 20
change on the carbon cycle of the last millennium, Global Biogeochem. Cy., 23, GB4001, doi:10.1029/2009GB003488, 2009.
Prentice, I. C., Sykes, M. T., and Cramer, W.: A simulation model for the transient effects of climate change on forest landscapes, Ecol. Model., 65, 51–70, 1993.
Rausch, N., Ukonmaanaho, L., Nieminen, T. M., Krachler, M., and Shotyk, W.: Comparison of 25
atmospheric deposition of copper, nickel, cobalt, zinc and cadmium recorded by Finnish peat cores with monitoring data and emission records, Environ. Sci. Technol., 39, 5989–5998, 2005.
Reimer, P. J., Baillie, M. G. L., Bard, E., Bayliss, A., Beck, J. W., Blackwell, P. G., Ramsey, C. B., Buck, C. E., Burr, G. S., Edwards, R. L., Friedrich, M., Grootes, P. M., Guilderson, T. P., Haj-30