the Afrotropical Mosquito Vector
Anopheles gambiae
Joa˜o Pinto1,2*, Amy Lynd2, Jose´ L. Vicente1, Federica Santolamazza3, Nadine P. Randle2, Gabriele Gentile4, Marta Moreno5, Fre´de´ric Simard6,7, Jacques Derek Charlwood8, Virgı´lio E. do Rosa´rio1, Adalgisa Caccone9, Alessandra della Torre3, Martin J. Donnelly21Centro de Mala´ria e outras Doenc¸as Tropicais, Instituto de Higiene e Medicina Tropical, Lisbon, Portugal,2Vector Group, Liverpool School of Tropical Medicine, Liverpool, United Kingdom,3Istituto Pasteur-Fondazione Cenci-Bolognetti, Sezione di Parassitologia, Dipartimento di Scienze di Sanita` Pubblica, Universita` di Roma - La Sapienza, Rome, Italy,4Dipartimento di Biologia, Universita` di Roma - Tor Vergata, Rome, Italy,5Centro Nacional de Medicina Tropical, Instituto de Salud Carlos III, Madrid, Spain,6Organisation de Coordination pour la lutte contre les Endemies en Afrique Centrale, Yaounde´, Cameroon,7Institut de Recherche pour le De´veloppement, Yaounde´, Cameroon,8DBL – Institute for Health Research and Development, Charlottenlund, Denmark,9Yale Institute for Biospheric Studies and the Department of Ecology and Evolutionary Biology, Yale University, New Haven, Connecticut, United States of America
How often insecticide resistance mutations arise in natural insect populations is a fundamental question for understanding the evolution of resistance and also for modeling its spread. Moreover, the development of resistance is regarded as a favored model to study the molecular evolution of adaptive traits. In the malaria vectorAnopheles gambiae two point mutations (L1014F and L1014S) in the voltage-gated sodium channel gene, that confer knockdown resistance (kdr) to DDT and pyrethroid insecticides, have been described. In order to determine whether resistance alleles result from single or multiple mutation events, genotyping of the kdr locus and partial sequencing of the upstream intron-1 was performed on a total of 288 A. gambiaeS-form collected from 28 localities in 15 countries. Knockdown resistance alleles were found to be widespread in West Africa with co-occurrence of both 1014S and 1014F in West-Central localities. Differences in intron-1 haplotype composition suggest thatkdralleles may have arisen from at least four independent mutation events. Neutrality tests provided evidence for a selective sweep acting on this genomic region, particularly in West Africa. The frequency and distribution of thesekdr haplotypes varied geographically, being influenced by an interplay between different mutational occurrences, gene flow and local selection. This has important practical implications for the management and sustainability of malaria vector control programs.
Citation: Pinto J, Lynd A, Vicente JL, Santolamazza F, Randle NP, et al (2007) Multiple Origins of Knockdown Resistance Mutations in the Afrotropical Mosquito VectorAnopheles gambiae. PLoS ONE 2(11): e1243. doi:10.1371/journal.pone.0001243
INTRODUCTION
The development of insecticide resistance is regarded as a favored empirical model to study the molecular evolution of adaptive traits. The onset of resistance is a relatively fast and well-documented event in many insect species, particularly those of medical and economic interest. In addition, the resistance phenotype is usually associated with a few major genes or gene classes and mutations therein that confer the trait [1]. Within this framework, particular attention has been given to determining how often resistance mutations arise in natural populations. This is a fundamental question for understanding the evolution of resistance and also for modeling its spread.
InCulex pipiens, there is evidence for a single origin of a duplication in esterase genes, conferring metabolic resistance to organopho-sphates, followed by global spread through migration [2]. A single origin and global dispersal of a P450 allele associated with resistance
to DDT was also described inDrosophila melanogaster[3]. Multiple
origins of resistance alleles involving different genes have also been documented in several insect species. These include point mutations
at the voltage-gated sodium channel gene ofBemisia tabaciandMyzus
persicae [4,5], c-aminobutyric acid (GABA) receptors in Tribolium castaneum[6] and esterase genes inLucilia cuprina[1].
In Anopheles gambiae sensu stricto, the principal Afrotropical malaria vector, two point mutations at the voltage-gated sodium
channel gene confer knockdown resistance (kdr) to DDT and
pyrethroid insecticides. Martinez-Torres et al. [7] identified a Leucine-Phenylalanine substitution at position 1014 (L1014F) of the gene encoding the S6 transmembrane segment of domain II of the sodium channel, in laboratory strains derived from field resistant samples of Burkina Faso and Ivory Coast. A second
mutation, a Leucine-Serine substitution at the same codon (L1014S), has been identified in a colony derived from specimens from Kenya [8].
Field surveys revealed a widespread distribution of the 1014F allele in West Africa [9,10]. In addition, significant differences were found in the frequency of this allele between two molecular forms, denoted M and S, that are considered units of incipient
speciation withinA. gambiae[11]. These forms are characterized by
sequence differences in transcribed and non-transcribed spacers of the ribosomal DNA. The S-form is the most widespread throughout Sub-Saharan Africa while the M-form is mostly
Academic Editor:Niyaz Ahmed, Centre for DNA Fingerprinting and Diagnostics, India
Received September 10, 2007; Accepted November 7, 2007; Published
November 28, 2007
Copyright:ß2007 Pinto et al. This is an open-access article distributed under the terms of the Creative Commons Attribution License, which permits unrestricted use, distribution, and reproduction in any medium, provided the original author and source are credited.
Funding:This work received financial support by the Foundation of Science and Technology-FEDER, Portugal (POCTI/ESP/44837/2002) and by the UNICEF/UNDP/ World Bank/WHO Special Programme for Research and Training in Tropical Diseases. JP was funded by Foundation of Science and Technology-FEDER, Portugal (SFRH/BPD/10086/2002). AC was also supported by YIBS-Ecosave funds and by the NIH grant NIH RO1AI046018.
Competing Interests:The authors have declared that no competing interests exist.
confined to the West part of Africa, from Senegal to Angola, with extensive overlapping distribution with the S-form. In general, the 1014F allele is common in the S-form but rare in the M-form, even when populations of both forms occur in sympatry [11,12]. In the few M-form populations where it has been found,
sequencing analysis of the upstream intron-1 of the kdr locus
showed that the 1014F allele apparently occurred through introgression with the S-form [13]. Less information is available on the distribution of the 1014S allele. It appears to be less widespread, occurring mainly within East Africa [14]. However, recent surveys have reported the co-occurrence of both 1014F and 1014S alleles in localities of Gabon, Cameroon and Uganda [15– 17].
The distribution and frequency of these mutations poses serious questions about the sustainability of insecticide-based vector control programs. This is particularly evident when one considers that pyrethroids are the only insecticides recommended by the World Health Organization for insecticide-treated materials and that DDT is being re-introduced for malaria control in several
countries [18]. Knowledge of the waykdrresistance is evolving in
A. gambiae is therefore of great epidemiological importance. Whether these mutations have arisen only once and are spreading throughout the species distribution or if multiple independent mutation events have occurred, remains to be understood. Also, it is central for control purposes to evaluate the role of local selection pressures and of migration in shaping the distribution and
frequency of kdralleles. This would allow to design more finely
tuned control strategies that take into account current and historical selection pressures and gene flow patterns.
In this study, we have genotyped thekdrlocus and sequenced
the upstream intron-1 in samples ofA. gambiaeS-form throughout
Sub-Saharan Africa in order to, i) establish a minimum number of
mutation events giving rise to kdr alleles, ii) characterize
heterogeneities in the geographic distribution of kdr alleles, and
iii) relate these to aspects of selection and patterns of population structure known for this species.
MATERIALS AND METHODS
Samples
DNA samples from individual females identified by PCR as A.
gambiae s.s.S-form [19], were obtained from 28 collection sites in 15 African countries (Figure 1, see also Table S1 in Supporting Information). Except for the sample from Cameroon that was composed by adults that emerged from field collected larvae, all the other samples were composed by field collected adults. Due to
sampling constraints inherent to the fact thatkdralleles are rarely
found in the M-form, this study dealt only with samples of A.
gambiaeS-form.
Genotyping and sequencing procedures
The kdr locus was genotyped either by allele-specific-PCR
(AS-PCR) or Hot Oligonucleotide Ligation Assay (HOLA) methods [7,8,20]. Genotypes were confirmed in a subset of samples by direct sequencing of a 293 bp (base pairs) fragment containing the
kdrlocus and the downstream intron-2, using primers Agd1 and
Agd2 [7,16]. Direct sequencing of the intron-1 was performed according to previously described protocols [10,13]. Sequences from both strands were obtained for each specimen, aligned in BIOEDIT v. 7.0.5.2. [21] and corrected manually. Part of the sequences have been produced in a previous study [10] (Table S1). In order to recover full haplotypes comprising both intron-1
sequences and corresponding kdr alleles from heterozygotes at
more than one site, a Bayesian approach based on a priori
predictions from the coalescent theory was used to reconstruct haplotypes from population genotypic data, implemented by the software Phase 2.1. [22]. Predicted haplotypes were confirmed by
cloning of a fragment of 568 bp containing thekdrlocus and all
segregating sites at intron-1 in a subset of individuals. Initial fragment amplification was carried out using primers kdrCL-F (AAATGTCTCGCCCAAATCAG) and kdrCL-R (GCACCTG-CAAAACAATGTCA), located upstream at positions 602–621 in the intron-1 and downstream at positions 1150–1169 at the end of the intron-2, respectively (nucleotide positions as in [13]). The
PCR mixture contained 16PCR Buffer (Promega, Madison WI,
USA), 2 mM of MgCl2, 200mM of a dNTPs equimolar mix, 1 U
TaqDNA polymerase (Promega, Madison WI, USA) and 0.25mM
of each primer, in a total volume of 50ml. Cycling conditions were
94uC for 5 min, followed by 35 cycles each with 94uC for 30 sec,
50uC for 35 sec and 72uC for 60 sec, followed by a final extension
step of 10 min at 72uC. Amplified products were cloned into pCR
2.1. TOPO TA vectors (Invitrogen, Carlsbad CA, USA). In order to obtain both haplotypes, three to five clones were sequenced for each individual.
Data analysis
Estimates of DNA polymorphism at the intron-1, including the number of segregating sites, number of haplotypes, haplotype diversity and nucleotide diversity, were obtained using DnaSP v. 4.10.9 [23]. The same software was used to perform neutrality tests in order to infer if selection is acting upon the analyzed
intron-1 region. Tajima’sDtest [24] compares two estimates ofh
( = 4Nemfor diploid organisms, whereNeis the effective population
size and m the mutation rate), one based on the number of
segregating sites and the other on the average number of pairwise nucleotide differences, that should be equal under the neutral mutation model. If selection is affecting the genomic region, estimates will differ, as selection will affect more readily the
number segregating sites. Fu and Li’s D* and F* tests [25]
compare two estimates ofh, based on the number of mutations
found in internal and external branches of the genealogy, respectively. In the presence of purifying selection, an excess of mutations in external branches is likely to occur as deleterious mutations are maintained at low frequencies. However, if balancing selection occurs this may result in a deficit of external
mutations. Fu [26] proposed the FSstatistic, which is based on
expectations of haplotype frequency distribution for a given value
of h derived from the average number of pairwise nucleotide
differences. When there is an excess of recent mutations, h
estimated by the mean number of pairwise nucleotide differences will tend to be smaller than that based on the number of alleles.
Negative values of FS are expected as an indication of genetic
hitchhiking or population growth [26].
Genealogical relations among haplotypes were estimated by constructing a parsimony network using the TCS software [27], which uses the parsimony algorithm of Templeton et al. [28] to perform a pairwise calculation of the number of mutational steps between haplotypes until a probability threshold of 95% is exceeded. To conduct this analysis, full haplotypes comprising
intron-1 and thekdrlocus retrieved from both cloning and gametic
phase analysis by Phase 2.1. were used.
In order to infer if recombination between the kdr locus and
polymorphic positions in the intron-1 could be a more likely cause for the origin of the observed haplotypes, two estimates of recombination rate were obtained. The population background recombination rater(r= 4Ner, whereris the rate of crossing over
haplotype is reconstructed as a mosaic of previously considered
haplotypes andris estimated from the average length of the mosaic
pieces (see also [30]). A median value ofrwas obtained from 100
randomly selected sequences and bootstrapped 95% confidence intervals were obtained for the estimates (10,000 replicates). The
minimum number of recombination events, Rm, in the history of
a sample was estimated by the ‘‘four-gamete test’’ method described by Hudson and Kaplan [31], as implemented in DnaSP.
RESULTS
A total of 288 A. gambiae S-form were analyzed (2N= 576
sequences), with a mean of 10 individuals per locality. Knockdown resistance associated alleles were not homogeneously present in the samples analysed (Figure 1; Table S1): i) in Western African
samples (2N= 202 sequences), from Nigeria to Senegal, the
L1014F was the only mutation found; ii) in the West-Central
region of Africa (2N= 254), comprising Angola, Gabon, Equatorial
Guinea and Cameroon, bothkdralleles co-occurred in 8 localities
surveyed. In this region, the 1014S allele was absent only in the
sample of Bioko island (2N= 14); iii) in East Africa (2N= 120), the
L1014S mutation was found only in the Kenyan sample (2N= 26)
and no 1014F alleles were found. Overall,kdralleles were present
in 23 out of the 28 localities sampled. Direct sequencing of thekdr
locus in 137 individuals confirmed the genotypes obtained either by HOLA or AS-PCR. No additional polymorphisms were detected.
Sequencing analysis of a 438 bp region of intron-1 revealed 8 polymorphic sites of which four were singletons (positions 528, 627, 697 and 786, as in [13]). No insertions or deletions were found. A total of 9 different intron-1 haplotypes were detected
(Genebank accession nuEU078886–EU078894). Of these, there
were three predominant haplotypes resulting from single step mutations at positions 702 (T/C) and 703 (C/T). Haplotype H1 (702T-703C, formerly S1 in [10]) was the most frequent and widespread (81.1% of all 576 sequences). In the West African region, it was fixed in localities from Benin, Ghana, Ivory Coast and Burkina Faso (Figure 1). It was also the only haplotype found in Asembo, Kenya, which was the only East African sample that Figure 1. Geographic distribution ofkdralleles and most common intron-1 haplotypes ofA. gambiae.Gray-shaded countries are those included in the study. White squares in the map are the approximate locations of collection sites. Pie charts show the relative frequencies ofkdrhaplotypes (i.e. kdralleles and corresponding intron-1 haplotypes), per country. Labels for eachkdrhaplotype are shown in the example pie chart, at the upper-left corner of the figure.
had the 1014S allele. Haplotype H2 (702T-703T, formerly S6 in
[10]) was found in both West-Central (23.2%, 2N= 254) and East
Africa (16.7%, 2N= 120), but it was absent in West African sites.
Haplotype H3 (702C-703C, formerly M1 in [10]), also had an extensive but patchier distribution. This haplotype occurred at
a higher frequency in East Africa (10.0%, 2N= 120) than in
West-Central (2.4%, 2N= 254) and Western (2.0%, 2N= 202) regions.
The remaining 6 haplotypes were found at very low frequencies
(,0.5%, 2N= 576) representing mostly local variants (Figure 2).
Geographical differences were also evident in the estimates of genetic diversity (Table S1). In Western African sites variation at the intron-1 was lowest, with an overall haplotype and nucleotide
diversity of 0.058 (SD:60.023) and nucleotide diversity of 0.00013
(SD: 60.00005). West-Central African and East African sites
showed similar levels of diversity, with overall haplotype diversity
of 0.422 (SD: 60.030) and 0.440 (SD:60.048), and nucleotide
diversity of 0.00102 (SD:60.00008) and 0.00232 (SD:60.00014),
respectively.
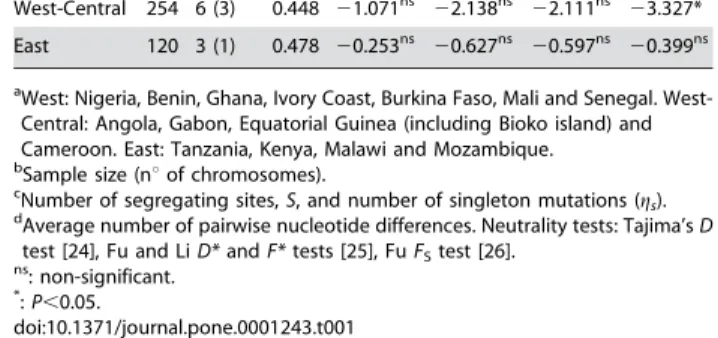
Given the above mentioned differences, neutrality tests were performed on three groups of samples that were pooled according to the West, West-Central and East African regions, rather than on single localities (Table 1). Significant departures from neutrality
were detected byFsboth in the West and West-Central regions,
but with a larger negative value for the West region. All other tests
were non-significant, with the exception of theF*value obtained
also for the West region. In the East region, values obtained for all tests were closest to the expectations of neutrality.
Sequencing of cloned fragments containing the kdrlocus and
intron-1 polymorphisms from 14 individuals confirmed the haplotypes predicted by the gametic phase analysis using Phase 2.1. software. Errors of misincorporation of nucleotides were estimated as 0.0017 per base pair, by comparing the cloned
sequences with those obtained by direct sequencing of PCR products. In addition, three haplotypes, instead of the expected two, were seen in 3 individuals. This may have been due to the
presence of male DNA in the female’s spermatheca or toin vitro
recombination by jumping PCR [32].
By reconstructing individual full haplotypes from intron-1
sequences and correspondent kdr genotypes, it was possible to
distinguish four different kdr haplotypes (Genebank accession
nuEU078895–EU078898). Their genealogical relations are
illus-trated in the TCS network in Figure 2. The network suggests four
independent mutation events giving rise to kdr haplotypes.
Haplotypes H1-1014F and H1-1014S derive from single muta-tional steps from the common ancestor H1-1014L. Haplotypes H2-1014S and H3-1014F are the result of two mutational steps,
Figure 2. TCS network showing the genealogical relations amongkdrhaplotypes ofA. gambiae.Each haplotype is represented by a circle with a size proportional to its frequency in the sample (in parenthesis, 2N= 576). Countries where the most rare haplotypes (i.e.frequency,0.5%) were found are also reported. Mutational steps are represented by lines with the indication of the mutation from the immediate ancestral haplotype (kdr mutations in bold). Dashed lines represent reticulation ambiguities (see Discussion). White circles: haplotypes carrying the wild-type 1014L allele. Gray circles: haplotypes carrying the 1014S allele at thekdrlocus (T-1104-C). Black circles: haplotypes carrying the 1014F allele at thekdrlocus (A-1105-T). doi:10.1371/journal.pone.0001243.g002
Table 1.Neutrality tests according to geographic region. . . . .
Regiona Nb S (g
s)c Kd D D* F* FS
West 202 3 (2) 0.059 21.416ns
22.241ns
22.333* 25.376* West-Central 254 6 (3) 0.448 21.071ns
22.138ns
22.111ns
23.327* East 120 3 (1) 0.478 20.253ns
20.627ns
20.597ns
20.399ns aWest: Nigeria, Benin, Ghana, Ivory Coast, Burkina Faso, Mali and Senegal.
West-Central: Angola, Gabon, Equatorial Guinea (including Bioko island) and Cameroon. East: Tanzania, Kenya, Malawi and Mozambique.
bSample size (n
uof chromosomes).
cNumber of segregating sites,
S, and number of singleton mutations (gs).
dAverage number of pairwise nucleotide differences. Neutrality tests: Tajima’sD
test [24], Fu and LiD*andF*tests [25], FuFStest [26]. ns: non-significant.
*:P
,0.05.
doi:10.1371/journal.pone.0001243.t001
...
...
....
...
...
....
...
...
....
...
...
....
...
...
but ambiguous connections were found for these tip haplotypes
(Figure 2). The geographic distribution ofkdrhaplotypes is shown
in Figure 1. The West Central African region presented the highest diversity, with H1-1014F, H1-1014S and H2-1014S co-occurring in sites from Gabon and northern Angola.
The estimate of background recombination rate, r, was
8.0161027(Bootstrap 95% CI: 1.6461027–2.2161026). In order
to account for recombination only between thekdrlocus and the
segregating sites in intron-1 discriminating the different kdr
haplotypes, analysis was repeated using only positions 702 and
703 in intron-1 and the kdr locus, giving an estimate of
r= 8.1361025(Bootstrap 95%CI: 2.3661025–1.8461024). The minimum number of recombination events in the history of
the sample was estimated as Rm= 1, corresponding to a single
recombination event between polymorphic positions 703 (yielding
intron-1 haplotypes H1 and H2) and 1104 (i.e.the kdrmutation
L1014S).
DISCUSSION
Analysis of the upstream intron-1 of thekdrlocus suggests at least
four independent origins ofkdralleles in the principal Afrotropical
malaria vector A. gambiae S-form. Two of these events are
unequivocal since they result from single-step mutations at the
kdrlocus from a common progenitor haplotype (H1) resulting in
two different phenotypes,i.e.the previously described aminoacidic
substitutions L1014F and L1014S [7,8]. The origins of the other
two kdr haplotypes are not as clear-cut, given the reticulations
obtained in the TCS network. Following the guidelines of Templeton et al. [23] and Crandall and Templeton [33] to
resolve network ambiguities, it could be hypothesized that thesekdr
haplotypes have arisen from mutations at the intron-1 in ancestors
already carrying the kdr mutation. However, these guidelines
might not be appropriate in this case, since they are based on a neutral model, in which the most frequent haplotypes are the oldest and thus more likely to give rise to tip haplotypes. These predictions do not hold when neutrality is violated, as it is probably the case of this dataset. Selection through insecticide
pressure will favor kdr alleles and remove wild-type alleles.
Therefore, the frequency of haplotypes carrying the wild-type allele will be lower than expected under neutrality, and so frequency need not reflect age. In this case, haplotypes H2-1014S and H3-1014 could therefore have been generated by two
additional mutation events at the kdr locus. It is also important
to note that given the low genetic variation found at the intron-1, the number of independent mutations detected may still be an underestimate of the actual number of mutation events that have occurred at thekdrlocus ofA. gambiae.
Two-stepkdrhaplotypes may also have arisen by recombination
between an intron-1 haplotype carrying akdrallele and a different
haplotype carrying the wild-type allele. Indeed, Hudson and
Kaplan’s [31] Rm predicted one recombination event that could
have given rise to H1-1014S and H2-1014S haplotypes. However, the voltage-gated sodium channel gene maps in Division 20C on the centromeric end of arm L of chromosome-2 [8], and recombination tends to be reduced in regions surrounding the centromere. In addition, although an earlier origin cannot be fully excluded, mutations originating resistance alleles are more likely to have arisen with the onset of selective pressures from insecticide use. This assumption is supported by the observation that a number of insect species share exactly the same resistance-associated polymorphisms, a situation unlikely to be met in the absence of insecticide selection [5,6]. Selective pressures at the
sodium channel of A. gambiaeshould thus be coincident with the
introduction of DDT in Africa in the mid-1940’s for both
agricultural and vector control purposes [18,34]. Assuming 12–24
generations per year forA. gambiae[35], this would imply about
700 to 1400 generations for recombination to have occurred. Taking 1024
as the upper confidence limit of the highest estimate
ofrobtained, one would expect a recombination event everyca.
10,000 generations, or 416 years assuming the overestimate of 24
generations per year forA. gambiae. This time-window is probably
not enough for recombination to have generated the observedkdr
haplotypes.
The H1-1014F kdr haplotype was the most widespread
throughout West and West-Central Africa. This extensive distribution together with the high frequencies found in West African sites, that also showed limited intron-1 diversity, suggest that dispersal through migration followed by local selection have
shaped the distribution and frequency of thiskdrhaplotype. It is
worth noting that the 1014F allele was also detected in East Africa (Uganda), but no information on the associated intron-1 haplotype
is available [17]. The more limited distribution of the two kdr
haplotypes carrying the 1014S allele raises the possibility of a more recent origin of this allele in West-Central Africa from at least two independent mutation events. However, while haplotype H2-1014S is confined to the West-Central African region, haplotype H1-1014S was also found in Kenya. Earlier studies indicated that
only a few major physical barriers limit gene flow between A.
gambiaepopulations [36]. However, genetic discontinuities within molecular forms have recently been detected in West Africa, associated with specific chromosomal arrangements or different
ecological zones [37–39]. Given the low resolution (i.e. low
polymorphism) of the intron-1 region analyzed and the un-availability of samples from intermediate Central African localities for this study, the possibility of independent mutations giving rise to East and West African H1-1014S haplotypes cannot be ruled out.
The H3-1014F haplotype was detected in only two individuals from Senegal and Nigeria, homozygous for the intron-1 H3
haplotype and 1014L/1014F heterozygous at the kdr locus.
Interestingly, in West Africa, haplotype H3 was shown to be almost exclusive of the M-form [10]. The few M-form samples
available from the sites surveyed in this study did not show anykdr
alleles (data not shown), which precluded the analysis of kdr
haplotypes in A. gambiae M-form. However, the occurrence of
additional independent kdr mutation events in the M-form has
been recently suggested for Bioko island [40] and further studies on this form are certainly needed.
Low genetic variation was observed in the intron-1 ofA. gambiae
when compared to other insect species that are also subjected to insecticide pressure [4,5]. The overall low genetic diversity in the intron-1 could reflect a ‘‘centromere effect’’ [41]. In addition, such low variation may be a consequence of a recent selective sweep [10,13]. A selective sweep occurs when an allele rapidly increases its frequency due to positive selection. Through genetic hitchhik-ing, the frequency of linked alleles in the flanking regions of the locus under selection can also increase, thus reducing genetic variation. Evidence of a selective sweep comes from the neutrality
tests. The highest departure from neutrality was detected by theFS
statistic, in the West African region. In a comparison of the tests
used,FSshowed the highest power in detecting departures from
neutrality under a genetic hitchhiking model [26]. The values closer to neutrality obtained for the other tests may thus indicate that selection is not acting directly on the intronic region, but
through genetic hitchhiking. The highestFSestimated for the West
West African region, making it the world’s third largest producer [42]. This increase was most likely followed by an increased use of
pyrethroid insecticides. Selection ofkdrresistance inA. gambiaein
cotton areas associated with the use of pyrethroids has been well documented [43].
No departures from neutrality were detected in East Africa, where only the 1014S allele was found at a single locality (Asembo, Kenya). Stump et al. [14] have shown that the presence of the 1014S allele pre-dates the use of pyrethroids in Asembo and report an increase in the frequency of this allele with the onset of a large scale permethrin-treated bednets trial. These findings coupled with the presence of a single intron-1 haplotype in this locality also suggest that a local selective sweep of the 1014S allele may have recently occurred in this area.
The geographic distribution ofkdrhaplotypes should reflect the
interplay between the evolutionary forces of mutation, gene flow and selection. InA. gambiaeS-form there is evidence suggesting that
at least four mutation events have originated kdr alleles. These
insecticide resistance associated alleles are widespread and reach high frequency, especially in West and West-Central Africa. Of particular relevance is the co-occurrence of both 1014F and 1014S alleles in the West-Central region, not only at the population but
also at the individual level (i.e.1014S/1014F heterozygotes). The
phenotypic outcome of these genotypes in terms of individual response to insecticides remains to be uncovered. More ecological studies are needed, relating levels of insecticide resistance with the
genotypic composition at the kdr locus and with the analysis of
other resistance mechanisms (e.g.metabolic, behavioral),
particu-larly for the West-Central African region. This would not only provide further insights into the molecular evolution of insecticide
resistance, but would also have important practical implications for vector control. It remains to be fully clarified the extent of the
contribution of kdr mutations to the resistance phenotype,
particularly in cases where non-target site resistance mechanisms are also present [8]. This information is essential for making use of
kdrfrequency variation as a measuring tool in insecticide resistance
monitoring systems. A clear definition of the role of different resistance mechanisms is therefore central to evaluate the impact of insecticide-based vector control programs aimed at lowering the malaria burden, the major health problem in developing countries from tropical regions.
SUPPORTING INFORMATION
Table S1 Collection sites, sample sizes,kdrallele frequencies and estimates of DNA polymorphism at the intron-1
Found at: doi:10.1371/journal.pone.0001243.s001 (0.11 MB DOC)
ACKNOWLEDGMENTS
The authors would like to thank all the collaborators that provided mosquito samples from some of the localities studied: M. Akogbeto, P. Alonso, T. Baldet, P.J. Cani, G. Carrara, C. Costantini, C. Curtis, I. Dia, J. Dossou-yovo, N. Elissa, J. Etang, F. Fortes, N’F. Sagnon and Y.T. Toure´.
Author Contributions
Conceived and designed the experiments: AC JP MD Ad. Performed the experiments: AC FS JP AL NR JV FS GG MM. Analyzed the data: JP MD Ad. Contributed reagents/materials/analysis tools: Vd JC. Wrote the paper: AC Vd FS JP AL NR MD JV FS Ad GG MM JC.
REFERENCES
1. Newcomb RD, Gleeson DM, Yong CG, Russell RJ, Oakeshott JG (2005) Multiple mutations and gene duplications conferring organophosphorus in-secticide resistance have been selected at theRop-1locus of the sheep blowfly,
Lucilia cuprina. J Mol Evol 60: 207–220.
2. Raymond M, Callanhan A, Fort F, Pasteur N (1991) Worldwide migration of amplified insecticide resistance genes in mosquitoes. Science 350: 151–153. 3. Daborn PJ, Yen JL, Bogwitz MR, Le Goff G, Feil E, et al. (2002) A single p450
allele associated with insecticide resistance in Drosophila. Science 297: 2253–2256.
4. Alon M, Benting J, Lueke B, Ponge T, Alon F, et al. (2006) Multiple origins of pyrethroid resistance in sympatric biotypes of Bemisia tabaci (Hemiptera: Aleyrodidae). Insect Biochem Mol Biol 36: 71–79.
5. Anstead JA, Williamson MS, Denholm I (2005) Evidence for multiple origins of identical insecticide resistance mutations in the aphidMyzus persicae. Insect Biochem Mol Biol 35: 249–256.
6. Andreev D, Kreitman M, Phillips TW, Beeman RW, ffrench-Constant RH (1999) Multiple origins of cyclodiene insecticide resistance inTribolium castaneum
(Coleoptera: Tenebrionidae). J Mol Evol 48: 615–624.
7. Martinez-Torres D, Chandre F, Williamson MS, Darriet F, Berge JB, et al. (1998) Molecular characterization of pyrethroid knockdown resistance (kdr) in the major malaria vectorAnopheles gambiae s.s.Insect Mol Biol 7: 179–184. 8. Ranson H, Jensen B, Vulule JM, Wang X, Hemingway J, et al. (2000)
Identification of a point mutation in the voltage-gated sodium channel gene of KenyanAnopheles gambiaeassociated with resistance to DDT and pyrethroids. Insect Mol Biol 9: 491–497.
9. Chandre F, Manguin S, Brengues C, Dossou-Yovo J, Darriet F, et al. (1999) Current distribution of a pyrethroid resistance gene (kdr) inAnopheles gambiae
complex from west Africa and further evidence for reproductive isolation of the Mopti form. Parassitologia 41: 319–322.
10. Gentile G, Santolamazza F, Fanello C, Petrarca V, Caccone A, et al. (2004) Variation in an intron sequence of the voltage-gated sodium channel gene correlates with genetic differentiation betweenAnopheles gambiae s.s.molecular forms. Insect Mol Biol 13: 371–377.
11. della Torre A, Tu Z, Petrarca V (2005) On the distribution and genetic differentiation ofAnopheles gambiae s.s.molecular forms. Insect Biochem Mol Biol 35: 755–769.
12. Fanello C, Petrarca V, della Torre A, Santolamazza F, Dolo G, et al. (2003) The pyrethroid knock-down resistance gene in theAnopheles gambiaecomplex in Mali and further indication of incipient speciation withinAn. gambiaes.s. Insect Mol Biol 12: 241–245.
13. Weill M, Chandre F, Brengues C, Manguin S, Akogbeto M, et al. (2000) Thekdr
mutation occurs in the Mopti form ofAnopheles gambiae s.s.through introgression. Insect Mol Biol 9: 451–455.
14. Stump AD, Atieli FK, Vulule JM, Besansky NJ (2004) Dynamics of the pyrethroid knockdown resistance allele in western Kenyan populations of
Anopheles gambiaein response to insecticide-treated bed net trials. Am J Trop Med Hyg 70: 591–596.
15. Etang J, Fondjo E, Chandre F, Morlais I, Brengues C, et al. (2006) First report of knockdown mutations in the malaria vectorAnopheles gambiaefrom Cameroon. Am J Trop Med Hyg 74: 795–797.
16. Pinto J, Lynd A, Elissa N, Donnelly MJ, Costa C, et al. (2006) Co-occurrence of East and West African kdr mutations suggests high levels of resistance to pyrethroid insecticides inAnopheles gambiaefrom Libreville, Gabon. Med Vet Entomol 20: 27–32.
17. Verhaeghen K, Van Bortel W, Roelants P, Backeljau T, Coosemans M (2006) Detection of the East and West Africankdrmutation inAnopheles gambiaeand
Anopheles arabiensisfrom Uganda using a new assay based on FRET/Melt Curve analysis. Malar J 5: 16.
18. Weissmann G (2006) DDT is back: let us spray! FASEB J 20: 2427–2429. 19. Fanello CF, Santolamazza F, della Torre A (2002) Simultaneous identification of
species and molecular forms of theAnopheles gambiaecomplex by PCR-RFLP. Med Vet Entomol 16: 461–464.
20. Lynd A, Ranson H, McCall PJ, Randle NP, Black WC 4th, et al. (2005) A simplified high-throughput method for pyrethroid knock-down resistance (kdr) detection inAnopheles gambiae. Malar J 4: 16.
21. Hall TA (1999) BioEdit: a user-friendly biological sequence alignment editor and analysis program for Windows 95/98/NT. Nucleic Acids Symp Ser 41: 95–98. 22. Stephens M, Smith N, Donnelly P (2001) A new statistical method for haplotype
reconstruction from population data. Am J Hum Genet 68: 978–989. 23. Rozas J, Sanchez-DelBarrio JC, Messeguer X, Rozas R (2003) DnaSP, DNA
polymorphism analyses by the coalescent and other methods. Bioinformatics 19: 2496–2497.
24. Tajima F (1989) Statistical method for testing the neutral mutation hypothesis by DNA polymorphism. Genetics 123: 585–595.
25. Fu YX, Li WH (1993) Statistical tests of neutrality of mutations. Genetics 133: 693–709.
26. Fu XY (1997) Statistical tests of neutrality of mutations against population growth, hitchhiking and background selection. Genetics 147: 915–925. 27. Clement M, Posada D, Crandall KA (2000) TCS: a computer program to
28. Templeton AR, Crandall KA, Sing CF (1992) A cladistic analysis of phenotypic associations with haplotypes inferred from restriction endonuclease mapping and DNA sequence data. III. Cladogram estimation. Genetics 132: 619–633. 29. Li N, Stephens M (2003) Modeling linkage disequilibrium and identifying
recombination hotspots using single-nucleotide polymorphism data. Genetics 165: 2213–2233.
30. Crawford DC, Bhangale T, Li N, Hellenthal G, Rieder MJ, et al. (2004) Evidence for substantial fine-scale variation in recombination rates across the human genome. Nat Genet 36: 700–706.
31. Hudson RH, Kaplan NL (1985) Statistical properties of the number of recombination events in the history of a sample of DNA sequences. Genetics 111: 147–164.
32. Kraytsberg Y, Khrapko K (2005) Single-molecule PCR: an artifact-free PCR approach for the analysis of somatic mutations. Expert Rev Mol Diagn 5: 809–815.
33. Crandall KA, Templeton AR (1993) Empirical tests of some predictions from coalescent theory with applications to intraspecific phylogeny reconstruction. Genetics 134: 959–969.
34. Wandinga SO (2001) Use and distribution of organochlorine pesticides. The future in Africa. Pure Appl Chem 73: 1147–1155.
35. Lehmann T, Hawley WA, Grebert H, Collins FH (1998) The effective population size of Anopheles gambiae in Kenya: implications for population structure. Mol Biol Evol 15: 264–276.
36. Lehmann T, Licht M, Elissa N, Maega BTA, Chimunbwa JM, et al. (2003) Population structure ofAnopheles gambiaein Africa. J Hered 94: 133–147. 37. Slotman MA, Mendez MM, della Torre A, Dolo G, Toure YT, et al. (2006)
Genetic differentiation between the BAMAKO and SAVANNA chromosomal forms of Anopheles gambiae as indicated by amplified fragment length poly-morphism analysis. Am J Trop Med Hyg 74: 641–648.
38. Slotman MA, Tripet F, Cornel AJ, Meneses CR, Lee Y, et al. (2007) Evidence for subdivision within the M molecular form ofAnopheles gambiae. Mol Ecol 16: 639–649.
39. Yawson AE, Weetman D, Wilson MD, Donnelly MJ (2007) Ecological zones rather than molecular forms predict genetic differentiation in the malaria vector
Anopheles gambiaes.s. in Ghana. Genetics 175: 751–761.
40. Reimer LJ, Tripet F, Slotman M, Spielman A, Fondjo E, et al. (2005) An unusual distribution of thekdrgene among populations ofAnopheles gambiaeon the island of Bioko, Equatorial Guinea. Insect Mol Biol 14: 683–688.
41. Stephan W, Langley CH (1989) Molecular genetic variation in the centromeric region of the X chromosome in three Drosophila ananassae populations. I. Contrasts between thevermilionandforkedloci. Genetics 121: 89–99. 42. Perret C, Bossard L (2006) Cotton. Atlas on regional integration in West Africa:
economy series. ECOWAS-SWAC/OECD Available: http://www.atlas-westafrica.org. Accessed.