ISSN: 2067-533X
INTERNATIONAL JOURNAL
OF
CONSERVATION SCIENCE
Volume 3, Issue 1, January-March 2012: 51-60 www.ijcs.uaic.ro
MANGROVE DISTRIBUTION AND MORPHOLOGY
CHANGES IN THE MULLIPALLAM CREEK,
SOUTH EASTERN COAST OF INDIA
Krishnakumar PONNAMBALAM1, Lakshumanan CHOKKALINGAM1*, Viveganandan SUBRAMANIAM1 , Jonathan MUTHUSWAMY PONNIAH2
1) Centre for Remote Sensing, Khajamalai Campus, Bharathidasan University,
Trichirapalli-620 023, India
2) Centro Interdisciplinario de Investigaciones y Estudios sobre Medio Ambiente y
Desarrollo (CIIEMAD), Instituto Politécnico Nacional (IPN), Calle 30 de Junio de 1520, Barrio la Laguna Ticomán, Del. Gustavo A. Madero, C.P.07340, México D.F., México
Abstract
The Mangrove forest is globally important for the productivity of the coastal environment and is a good nursery site for aquatic organisms. The objective of the present paper was to create thematic maps of the wetland ecosystem and to analyse its changes, while making Remote Sensing and GIS techniques contributions to the Mullipallam region. Remotely sensed satellite data were used to detect changes in the mangrove cover for a period of 16 years (1991-2007). We found that an area of about 165.4 ha of dense mangrove degraded from 1999 to 2007 due to anthropogenic and shoreline erosion but sparse mangroves area significantly increased during this period due conservation and restoration activities. A Morphodynamics study (1929-2007) found that the migration of the River Cauvery tributaries in the wetland system had shifted towards the eastern side of the creek and the confluence of River Koraiyar had migrated towards the N-NNE direction. We observed that in recent decades mangrove forest have swiftly degraded because of intensified human activities.
Keywords: Mangroves; Morphology; Conservation; Restoration; Muthupet.
Introduction
Mangroves are a small evergreen important habitat usually found in the inter-tidal zones of tropical and subtropical coasts. These plants known to play an important role in the protecting embankment against tide, to remove pollutants and they are good habitats and they also support feeding, breeding, spawning, hatching and nursing of aquatic organisms [1-4]. Globally, the mangroves are destroyed by natural phenomena (cyclones, tidal waves, coastal erosion, hyper salinity, eustatic sea level changes) and anthropogenic factors [5-7]. The anthropogenic responses to climate change have the potential to exacerbate the adverse effects of climate changes on mangrove ecosystems [8]. Mangrove destruction can also release large quantities of stored carbon and exacerbate global warming and other climate change causes [9, 10].
*
In India, mangroves spreads decreased from 6740 to 4460 sq. km [11]. However, human induced stresses, including agricultural runoff, aquaculture, saltpan, solid waste disposal, aforestation, oil spill, urbanization and changes in the hydrological patterns, have threatened the survival of mangroves. These repercussions have subsequently drawn considerable attention to the conservation and management of this unique estuarine ecosystem [12].
Mapping and monitoring of the mangrove forest decline has become an urgent need for many countries [13-20]. Remote sensing is used as a tool for monitoring the changes, especially in mangrove forests, because the hilly or swampy terrain is inaccessible and vast. It provides relatively accurate information regarding the status of the vegetation in the forest and is cost-effective and time saving. The Geographic Information System (GIS) and remote sensing tools are extensively used to understand the changes in mangrove areas and the recordings are used for planning and management [21]. Previous studies indicate that remote sensing has an advantage over traditional field investigation methods in monitoring wide-spread mangroves [22-24]. A number of satellite sensors were used to identify mangrove forests in various studies undertaken, including Landsat TM and ETM [25], IRS LISS-III [26-28] and Quick Bird [29].
The aim of the present study was to evaluate the changes in the mangroves, and in associated land areas, the shoreline and wetland morphology in the Mullipallam creek system in the south eastern coast of India.
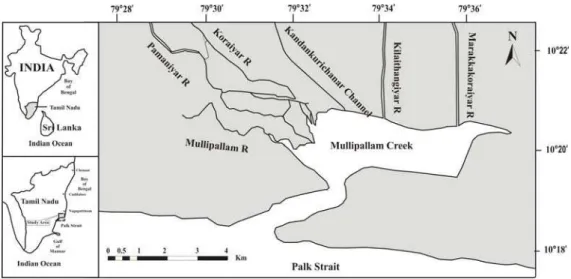
Study area
The Mullipallam creek is a semi enclosed coastal wetland surrounded by mangrove swamps and intertidal land situated on the southeastern coast of India, approximately 400 km south of Chennai. The study area spreads over 10º18′ to 10º22′ N latitude and 79º28′ to 79º36′ E longitude and is a medium tropical transition climate, characterized by a monthly average temperature of over 27ºC. The extensive mangrove habitat is estimated to be about 1,500 ha [30], and the creek is used for fishing and it serves as a nursery ground for marine fish and shrimps. The creek receives freshwater from five tributaries of the Cauvery River, such as the River Paminiyar, Kilathangiyar, Korayar and Marakkakorayar and the Kandankurichanar channel (Fig. 1).
The creek receives fresh water mostly during the north eastern monsoon season, from October to November [27, 28] but fresh water input into the creek is limited to the northeastern monsoon period [31]. The developmental activities around the Mullipallam creek area are very scanty, and the commercial activities include salt pans, aquaculture ponds, agricultural works etc. The multifarious uses and values of the Muthupet mangroves was reduced over a period of time due to direct and indirect natural and man-made activities [30].
Materials and methods
The remote sensing geo cover data set was downloaded from the global land cover facility (GLCF) (http://glcf.umd.edu), which is available free of cost. Geo cover is a collection of Landsat data that provides cloud free images collected for three years 1978, 1991 and 1999. Likewise, a P6 LISS III 2007 satellite image was also obtained from the National Remote Sensing Centre (NRSC). The baseline information was obtained from the Survey of India (SOI) topo-sheets. The monitoring of morphology and shoreline changes was based on the information from sources like the third military map (1930), the Survey of India map (1970), Landsat data 1991, 1999 and the LISS III 2007 image. The wetland features (i.e., mangroves, rivers, mudflat/tidal flat, aquaculture, saltpan) were mapped using Landsat and LISS III satellite imageries for the year of 1991, 1999 and 2007. Based on those images, the creek changes were analyzed and the accuracy of information was field tested by an intensive ground truth survey.
The multi-temporal satellite data in the present large scale study poses a number of challenges, which include geometric correction error, noise erasing from atmospheric effect, the errors due to changing in illumination geometer and instrument errors [32]. These errors were rectified through image pre-processing techniques, which included radiometric correction and geometric rectification. Subsequently, after the rectification process, the FCC (False Color Composite) was generated and enhanced through the histogram equalization method to distinguish the land use and land cover features. The image processing of the satellite data was carried out using ERDAS 8.1 image software. The supervised and unsupervised signature extraction techniques were used to classify the images in the present study. The supervised classification was carried out by using the maximum likelihood method by adopting different land use classes in the study area and further analysis was performed in the GIS (Arc GIS 9.1) software environment.
Result and discussion
Mangroves status
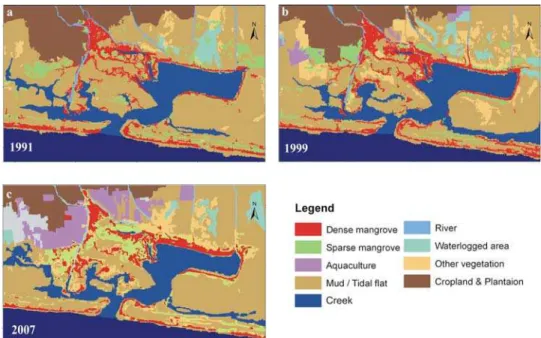
A broad classification of different types of vegetation and land use patterns was done and 10 different classes were identified. The land use features like dense mangroves, sparse mangroves, creek, river, mudflat/tidal flat, saltpan, aquaculture, waterlogged area, and other vegetation, such as the Prosopis categories, were identified from the satellite imagery. Analysis shows that the major land use in this area was aquaculture and saltpans. Land-use maps (Figures 2.b and c) show large areas of aquaculture farms and saltpans in the northern part of the study area that were previously crop lands, plantations and mud flat areas.
Table 1. Land-use / Land coverchanges during 1991-1999 & 1999-2007 in the Muthupet mangroves, South eastern coast of India
Classes 1991 Area
(in ha)
In % 1999 Area (in ha)
In % 2007 Area (in ha)
In % % change
(1991-1999)
% change
(1999-2007) Dense Mangroves 1025.2 7.9 1153.3 8.9 987.9 7.6 1.0 -1.3 Sparse Mangroves 819.0 6.3 717.5 5.5 908.8 7.0 -0.8 1.5
Saltpan - - - - 361.0 2.8 0.0 2.8
Aquaculture - - 211.0 1.6 989.3 7.6 1.6 6.0
Mud/Tidal flat 6545.0 50.7 5848.8 45.2 5603.2 43.2 -5.5 -2.0
Creek 1965.5 15.2 1984.3 15.3 1845.3 14.2 0.1 -1.1
River 178.2 1.4 141.6 1.1 140.3 1.1 -0.3 0.0
Water logged area 276.5 2.1 354.0 2.7 331.5 2.6 0.6 -0.1 Other vegetation 337.6 2.6 1044.5 8.1 883.8 6.8 5.5 -1.3 Upland (Plantation,
Cropland) 1752.8 13.6 1486.1 11.5 921.9 7.1 -2.1 -4.4
The total area of the dense mangrove forest increased to about 128.1 ha during the 1991 to 1999 period and decreased to about 165.4 ha during the 1999 to 2007 period, due to newly built aquaculture farms and shoreline erosion (Figure.5d). Earlier studies, based on the multispectral data, indicated that nearly 1514 ha of mangrove forest was present during 1988 [33]. Likewise, studies on wetland mapping along the Cauvery delta indicated that the mangrove area that was about 32 sq.km in 1976 was subsequently reduced to 19 sq.km in 1989 [34].
The total area occupied with mud/tidal flat was about 6545 ha in 1991 and subsequently it was reduced to 5848.8 ha in 1999. However, the increase in newly built aquaculture areas increased drastically from 211 ha (1999) to 989.3 ha (2007) (Fig. 2b and c; Table 1). The land areas that were converted to aquaculture farms were mostly cropland, mud flat and sparse mangrove classes. These changes occurred due to the population growth and the increase in socio-economic necessities that induced pressure on the coastal land use / land cover. The areas under dense mangroves decreased to about 165.4 ha, because of the problems caused by aquaculture, agriculture runoff, the limitation of freshwater input and to shoreline changes. A similar inference was also found in an earlier study made by Krithika et al. [35]. They revealed that a variety of anthropogenic inputs, including aquaculture (shrimp-farming effluent), and more diffuse and seasonal agricultural run-off affected the Muthupet mangrove environment. The creek size was reduced to about 139 ha between 1999 and 2007, as shown in Figure 2 (b and c). This happened due to siltation, high suspended sediment load and the sediment dynamic patterns of the wetland. The area covered by Sparse mangrove was estimated to 819 ha (6.3% of the total study area) in 1991, 717.5 ha (5.5%) in 1999 and 908.8 ha (7.0%) in 2007. There was a significant increase in sparse mangrove areas due to the restoration activity of the mangrove forest and a significant degradation of dense mangrove areas occurred due to human activities. However, restoration activities played a key role in establishing the overall spread of the mangrove cover.
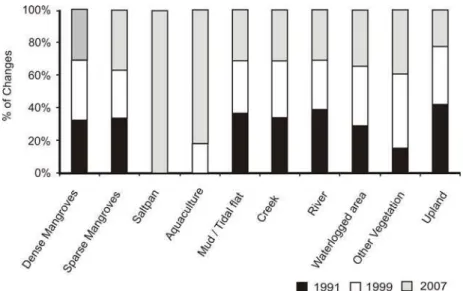
Fig. 3. Percentage of land use and land cover changes 1991- 2007
Morphology and shoreline changes
The morphodynamics of coastal systems consist of the nature and time-varying behavior of coastal landforms and the mechanisms that control the behavior within specific temporal and spatial scales. A morphodynamic analysis of the shoreline helps in understanding the evolution of new features in response to seasonal and episodic events that cause changes in wave direction, the sediment transport alongshore, bathymetry and shoreline orientation etc.
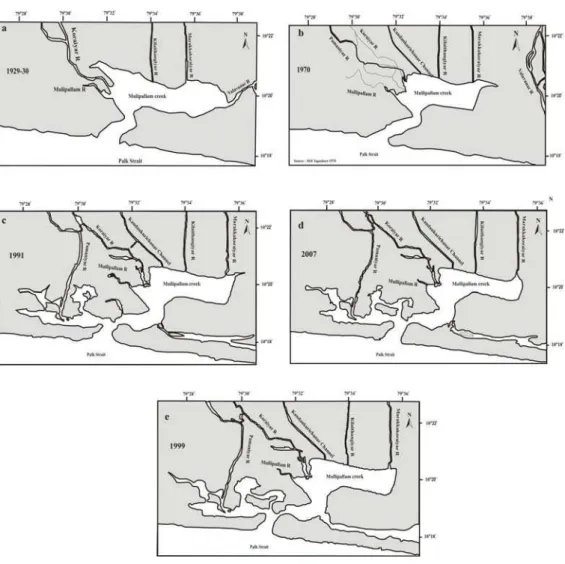
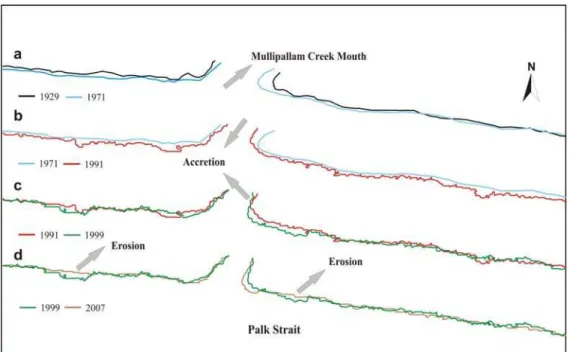
adjoining sea (Palk Strait). It lead to a significant decrease in size of the creek between 1929 and 2007. Moreover, the thick vegetation pattern and the height of the mangroves along the shoreline influenced the sediment accretion [36]. Similarly, earlier studies on coastal sediment distribution in the Palk Strait region during the arid period, indicated that there is not enough force to drain the suspended sediment particulate (SSP) matter from the creek. Hence, the creek is highly turbid during arid period (125-586 mg1-1) [27]. Because, during the arid period, the height of the mangroves and the vegetation pattern of the Mullipallam creek reduce the wind speed, only the subsequent monsoon currents helps in transporting the SSP to the Palk Strait. It was established that the accretion area was in the eastern part of the creek (Fig. 4).
Fig. 4. Morphology changes of the Mullipallam creek 1929-2007
it had joined in Seruthalaikadu creek, due to the changes and the sedimentological process in the creek morphology.
The accretion of the coast line along the Palk Strait is noticed on both the sides of the Mullipalam creek from 1929 to 1999 and it also supports the mangrove growth along the shoreline region (Figure.5a to c). A comparison between the images of 1999 and 2007 indicates a decrease in the mangrove vegetation along the shoreline, due to coastal erosion. In addition, the elongation and enlargement of the eastern part of the creek mouth had migrated to the west and southwest. However, the western part of the creek mouth also enlarged to the east, resulting in a reduction of the mouth size of the Mullipallam creek. Earlier studies, by Selvam et al. [28] indicated that the Mullipallam creek was about 2.5 Km wide and approximately 2 to 2.5 m deep in 1983. However, due to various processes (accretion/erosional), the mouth is currently just 1 Km wide and less than 1 m deep, due to silt deposits from the sea side (Palk Strait). Because the deposition of fine sediment was continuous, but the mouth of the creek was open throughout the year. The sedimentological studies inside the creek area had similar results, indicating the dominance of silt and clay [31].
Fig. 5. Shoreline changes map
Conclusions
Based on the results of the study of wetland uses and morphological changes, in the Mullipallam creek system the following observations were made:
• The Muthupet mangroves, creek morphology and shoreline have undergone drastic changes within a short period of approximately 80 years, caused both by natural and by anthropogenic activities.
• The Muthupet mangrove dense forest area decreased to 165.4 ha (1.3% of the total area), due to increase in aquaculture farm lands, saltpan and coastal erosion.
The present study indicates that systematic conservation strategies and restoration activity are urgently needed, in order to preserve the mangrove community and that periodical monitoring of coastal region using temporal satellite data should be performed in order to support the decision makers.
Acknowledgements
The authors wish to thank the Department of Science and Technology, Govt. of India, New Delhi for funding the project (No SR/FTP/ES-47/2006) and the Department of Forest, Govt. of Tamilnadu, Muthupet. MPJ wishes to thank EDI, COFAA-IPN and SNI, CONACYT, México.
References
[1] M. Chatterjee, M. Massolo, S.K. Sarkar, A.K. Bhattacharya, B.D. Bhattacharya, K.K. Satpathy, S. Saha, An assessment of trace metal contamination in intertidal sediment cores of sunderban mangrove wetland, India for evaluating the sediment quality guidelines,
Environmental Monitoring and Assessment, 150, 2008, pp.307-322.
[2] G.Neukermans, F. Dahdouh-Guebas, J.G. Kairo, N. Koedam, Mangrove Species and Stand Mapping in Gazi Bay (Kenya) using Quickbird Satellite Imagery, Spatial Science, 53 (1), 2008, pp. 75-85.
[3] S. Nayak, A. Bahuguna, Application of remote sensing data to monitoring mangrove and other coastal vegetation of India, Indian Journal of Marine Sciences, 30 (4), 2001, pp. 195-213.
[4] P. Lin, Mangrove Ecosystem in China, Sciences Publishing House, Beijing, China, 1997, p. iii-v.
[5] C. Giri, Z. Zhu, L.L. Tieszen, A. Singh, S. Gillette, J.A. Kelmelis, Mangrove forest distributions and dynamics (1975–2005) of the tsunami-affected region of Asia, Journal of Biogeography, 35, 2008, pp. 519–528.
[6] P. Saenger, E.J. Heger, J.D.S. Davie, Global status of mangrove ecosystems, Commission on Ecology, Paper no 3, IUCN, Switzerland, 1983, p. 80.
[7] W.E. Odum, R.E. Johannes, The response of mangrove to man-induced environmental stress, Tropical Marine Pollution, (eds. Ferguson-Wood E.J. and Johannes R.E.), Elsevier, Amsterdam, Oxford, New York, 1975, p. 52–62.
[8] E.L. Gilman, J. Ellison, N.C. Duke, Field, Threats to mangroves from climate change and adaptation options, Aquatic Botany, 89 (2), 2008, pp.1-14.
[9] * * *, Convention on Wetlands of International Importance Especially as Waterfowl Habitat, Ramsar Convention, Ramsar, Iran, 1971. www.ramsar.org
[10]E. Kristensen, S. Bouillon, T. Dittmar, C. Marchand, Organic Carbon Dynamics in Mangrove Ecosystems: A Review, Aquatic Botany, 89, 2008, pp.201-219.
[11]S. Nayak, A. Bahuguna, M.G. Shaikh, H.B. Chauhan, R.S. Rao, A.S. Arya, Coastal Environment, Scientific Note RSAM/SAC/COM/SN/11/92, Space Applications Centre, Ahmadabad, 1992, p. 114.
[12]V. Linneweber, L.D. De Lacerda, Mangrove Ecosystems: Function and Management, Springer-Verlag, Berlin, Germany, 2002.
[13]N.C. Duke, J.O. Meynecke, S. Dittmann, A.M. Ellison, K. Anger, U. Berger, S. Cannicci, K. Diele, K.C. Ewel, C.D Field, N. Koedam, S.Y. Lee, C. Marchand, I. Nordhaus, F. Dahdouh-Guebas, A world without mangroves?, Science, 317, 2007, pp. 41-42.
[14]J.M. Kovacs, J. Wang, F.F. Verdugo, Mapping mangrove leaf area index at the species level using IKONOS and LAI-2000 sensor for the Agua Brava Creek, Mexican Pacific,
[15]C. Munyati, Wetland change detection on the Kafue Flats, Zambia by classification of a multitemporal remote sensing image dataset, International Journal of Remote Sensing, 21, 2000, pp.1787–1806.
[16]C. Proisy, E. Mougin, F. Fromard, M.A Karam, Interpretation of polarimetric radar signatures of mangrove forests, Remote Sensing of Environment, 71, 2000, pp. 56–66. [17]J.Gao, A comparative study on spatial and spectral resolutions of satellite data mapping in
mangrove forests, International Journal of Remote Sensing, 20, 1999, pp.2823–2833. [18]P. Vanina, J. Iltis, N. Dessay, M. Lointier, O. Guelorget, L. Polidori, Mangrove mapping
in north-western Madagascar suing SPOT-XS and SIR-C radar data,Hydrobiologia, 413, 1999, pp. 127–133.
[19]E.W. Ramsey, J.R. Jensen, Remote sensing of mangrove wetlands: relating canopy spectra to site-specific data, Photogrammetric Engineering and Remote Sensing, 62, 1996, pp.939–948.
[20]J.R. Jensen, E. Ramsey, B.A. Davis, C.W. Thoemke, The measurement of mangrove characteristics in south-west Florida using SPOT multispectral data, Geocartography International, 2, 1991, pp.13–21.
[21]R. Ramasubramanian, L. Gnanappazham, T. Ravishankar, M. Navamuniyammal,
Mangroves of Godavari – analysis through remote sensing approach, Wetlands Ecology and Management, 14, 2005, 29–37.
[22]H. Akira, M. Marguerite, W. Roy, Hyper spectral image data for mapping wetland vegetation, Wetlands, 23, 2003, pp. 436–48.
[23]E.P. Green, C.D. Clark, P.J. Mumby, A.J. Edwards, A.C. Ellis, Remote sensing techniques for mangrove mapping, International Journal of Remote Sensing, 19, 1998, pp. 935–56. [24]S.A. Sader, A. Douglas, W.S. Liou, Accuracy of Landsat-TM and GIS rule-based methods
for forest wetland classification in Maine, Remote Sensing of Environment, 53, 1995, pp.133–44.
[25]G.L. Brian, S.D. Timothy, A technique for mapping mangroves with Landsat TM satellite data and Geographic Information System, Estuarine Coastal and Shelf Science, 43, 1996, pp.373–81.
[26]D.R. Satapathy, R.J. Krupadam, L. Pawan Kumar, S.R. Wate, The application of satellite data for the quantification of mangrove loss and coastal management in the Godavari estuary, East coast of India, Environmental Monitoring and Assessment, 134, 2007, pp.453-469.
[27]G.V.M. Gupta, Usha Natesan, M. V. Ramana Murthy, V.G. Sravan Kumar, S. Viswanathan, M.S. Bhat1, Ajay Kumar Ray, B.R. Subramanian, Nutrient budgets for Muthupet creek, southeastern India,Current Science, 90 (7), 2006, pp. 967-972.
[28]V. Selvam, Environmental classification of mangrove wetlands of India, Current Science,
84 (6), 2003, pp.757-765.
[29]L. Wang, W.P. Sousa, P. Gong, G.S. Biging, Comparison of IKONOS and QuickBird images for mapping mangrove species on the Caribbean coast of Panama, Remote Sensing of Environment, 91, 2004, pp.432–440.
[30]T.T. Ajithkumar, Characterization of aquaculture impact on mangrove environment with special reference to Muthupet mangroves, Southeast coast of India, in: Annual Progress Report of the CSIR, 1998,p .19.
[31]D. Janaki-Raman, M.P. Jonathan, S. Srinivasalu, J.S. Armstrong Altrin, S.P. Mohan, V. Ram-Mohan, Trace metal enrichments in core sediments in Muthupet mangrove, SE coast of India: Application of acid leachable technique, EnvironmentalPollution, 145, 2007, pp. 245-257.
[33]K. Selvaraj, V. Ram Mohan, M.P. Jonathan, S. Srinivasalu, Modification of coastal environment: Vedaranniyam wetland, South east coast of India, Journal of the Geological Society of India, 66, 2005, pp.535-538.
[34]* * *, Environmental impact on coastal wetland of Vedaranniyam-Tamil Nadu, Project Report, Institute of Remote Sensing, Anna University, Chennai, India, 1990, p. 66.
[35]K. Krithika, R. Purvaja, R. Ramesh, Fluxes of methane and nitrous oxide from an Indian mangrove, Current Sciences, 94 (2), 2008, pp. 218-224.
[36]A.P. Spanceley, Sedimentation pattern in a mangal on magnetic island near Townsville, North Queensland, Australia, Singapore Journal of Tropical Geography, 3, 1982, pp.100-107.