Operational Study and Simulation of a Biogas
Upgrading Plant
S. O. Masebinu, A. O. Aboyade, Member, IAENG, E. Muzenda, Member, IAENG
Samson O. Masebinu1, Akinwale O. Aboyade2, Edison Muzenda3
Abstract-The drive for finding alternative energy to supplement fossil based fuel within the South African energy sector has led to research on waste to energy in particular bio-methane as vehicular fuels. Biogas is produced from the anaerobic decomposition of organic matter with 40-70% vol. of methane. Biogas if upgraded, by removing the non-combustible component, can achieve 99% methane concentration which makes it a potent vehicle fuel and a direct substitute to natural gas. In this paper, a biogas upgrading plant operation that uses gas permeation technique for methane enrichment of biogas was studied and simulated. The effect of recycling permeate stream on methane recovery was studied. Recycling of the permeate stream improved the methane recovery of the simulated process by 18%. The overall methane recovery of the simulated process is 81.23%.
Keywords- Gas permeation, Biogas, Waste-to-Energy, Methane
recovery
I. INTRODUCTION
Biogas, a renewable and sustainable energy source, is typically produced by the anaerobic decomposition of organic matters in the absence of oxygen. There are two sources for biogas production and these are landfills and digester chambers [1]. Biogas comprises mainly methane (40% to 70% vol.), carbon dioxide, and traces of the pollutants hydrogen sulphide, nitrogen, oxygen, siloxane and water vapour. Bio-methane (after cleaning and enrichment) can be used for all applications designed for natural gas since both gases will have an approximate amount of methane concentration [2]. The global call for reduction in greenhouse gas emissions has led to better technical utilization of biogas like the transformation of the biogas into mechanical and heat energy other than just a direct emission into the atmosphere. In Brazil, biogas is mainly used as substitute for petrol and diesel in the automotive sector [3] while in Germany, electricity generation has up till recently being the main application of biogas production. Increasingly, the focus has now been on
Manuscript received March 05, 2014; revised March 26, 2014. This work is fully funded by South African National Energy Development Institute (SANEDI) and Novo as Industrial partners.
1S. O. Masebinu is with the department of Chemical Engineering,
University of Johannesburg, Doornfontein, South Africa ([email protected])
2A. O. Aboyade is an Energy and Sustainability specialist with Process
Energy and Environmental Technology Station (PEETS), Faculty of Engineering and the Built Environment, University of Johannesburg, Doornfontein Campus, South Africa ([email protected]).
E. Muzenda is is a part-time Energy and Environmental Engineering Specialist the with Process, Energy and Environmental Technology Station as well as Professor of Chemical Engineering, Department of Chemical of Chemical Engineering, Faculty of Engineering and the Built Environment, University of Johannesburg, Doornfontein, Johannesburg 2028, Tel: +27115596817, Fax: +27115596430, (Email: [email protected]).
upgrading to fuel grade bio-methane for use as vehicular fuel [4].
Biogas upgrading involves two major processes; cleaning and enrichment. The cleaning of the biogas consists of removal of corrosive products, mainly hydrogen sulphide, water, siloxanes and particles while the enrichment process is for removal of carbon dioxide that constitute about 30-45% volume of biogas composition. This elimination of carbon dioxide from the biogas as well as removal of other trace impurities increases the calorific value of the biogas. The cleaning of biogas can be carried out without enrichment as a stand-alone unit operation depending on the end usage of the biogas. However both cleaning and enrichment process can also be carried out in a unit operation like the membrane. Current technologies for cleaning of biogas and its subsequent methane enrichment are physicochemical methods such as absorption, adsorption, membrane and cryogenic separation.
The South African government is keen to exploit the possibility of biogas as a vehicular fuel to reduce its carbon footprint and provide an alternative fuel source for its transportation sector. At the C40 climate summit held in Johannesburg in February, 2014, two metro buses running on diesel dual fuel technology were show cased and it was said that by 2016, the city of Johannesburg will have 300 buses on diesel dual fuel technology using 50% bio-methane [5]. Furthermore, the South African Energy Development Institute (SANEDI) is funding research, and collaborating with private and public institutions to pursue a similar goal. As part of that objective, SANEDI funded a study to improve and expand on an existing project that upgrades landfill gas to compressed biogas (CBG). The biogas upgrading plant is operated by a private company in collaboration with the Ekurhuleni Municipality where the landfill is located. This paper presents an operational study of the plant, a model of the upgrading process and simulated result of the gas permeation process. ChemCAD software from Chemstation Inc. was used for simulation. The gas membrane software suite by Almeesoft Engineering Inc. was used for the programming and simulation of the membrane unit.
A. Biogas Utilization
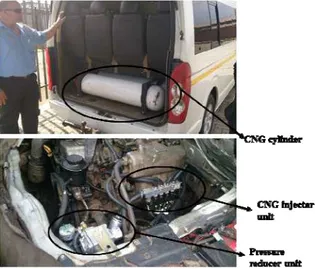
compressed natural gas (CNG). This modified bus engine can also run on bio-methane as an alternative to CNG. In general, bio-methane with at least 32.3MJ/Nm3 energy
content can be used in many natural gas combined heat and power (CHP) engines with little or no modification. However, most original vehicle manufacturers (OEM) of CNG vehicles require a minimum specification of 35.4MJ/Nm3 [7]. The recommended specification for
pipeline insertion is even higher at 38.2MJ/Nm3 [7]. Thus,
the use of biogas as substitute for natural gas in commercial or industrial applications requires a significant degree of upgrading.
Fig. 1 – Petrol & CNG fuelled bus
B. Biogas Composition and the Necessity to Upgrade
There are some significant differences between the properties of biogas and the natural gas Table I shows.
TABLE I
COMPARING THE PROPERTIES OF RAW AND UPGRADED BIOGAS WITH NATURAL GAS
*Natural gas values are based on Sasol’s specification. Sasol is the major supplier of natural gas to industries and gas stations in South Africa [8].
As Table 1 shows, the upgraded biogas resulted in an increase in heating value and the Wobbe index of the fuel. The Wobbe index is an important indicator of the
inter-changeability of fuel gases [9]. If two fuels have identical Wobbe Indices then for given pressure and valve settings, the energy output will also be identical. Typically variations up to 5% are allowed as this would not be noticeable by the consumer [10]. Thus for biogas to be a useful fuel for vehicle as substitute to natural gas it must be upgraded to achieve properties that are closer to that of natural gas. The Swedish biogas standard SS15-54-38 specify a maximum of 5% as the combined volume of carbon dioxide, oxygen and nitrogen in bio-methane if it is to be used as vehicular fuel [11]. In this context, the volume of nitrogen at 10% in the upgraded biogas as shown in Table 1 is too high. This is because the production of biogas in the landfill was very low at the time the measurements were recorded, and as such a high volume of air was absorbed into the biogas stream. When high nitrogen content fuel is used in vehicles, the catalytic converters in the exhaust system break down nitrogen gases forming nitrogen oxide which is 300 times more potent than carbon dioxide as a greenhouse gas [12]. A reasonable combination of various physicochemical processes is necessary to the successful upgrading of biogas [13]. The process must be cheap, reliable, efficient, low in material demand and have low energy consumption [14].
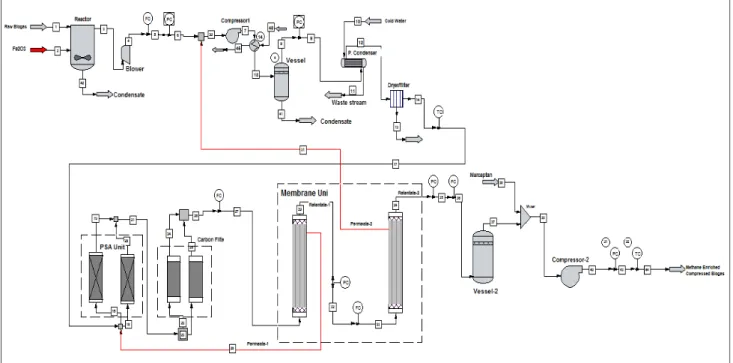
C. Overall Process Description
The raw biogas used in the upgrading process is currently generated from a closed landfill at Sebenza in the Ekurhuleni Municipality of South Africa. Pipes are bored into the landfill for extraction of the biogas generated by the natural decomposition of the organic fraction of the waste. TABLE I shows the composition of the biogas that is delivered to the upgrading plant. Figure 2 is the schematic diagram of a biogas upgrading plant. The biogas stream is made to go through two vessel packed with iron-III-oxide (Fe2O3) for preliminary desulphurization. The hydrogen
sulphide content in the biogas is reduced while it reacts with the iron-III-oxide to produce iron sulphide and condensate. The condensate is drained out of the vessel at its base while the iron sulphide is formed as precipitate. The precipitate formed gradually reduces the reactivity of the iron-III-oxide. There is no regeneration process for the reactant therefore after exhaustion, the vessel is emptied and the iron-III-oxide is replaced.
The resulting biogas stream is compressed with a two stage compressor into a vessel to about 12 bar, to ensure a uniform flow rate. Vapour content of the biogas is removed by cooling and drying of the gas. Possible particles and oil content in the biogas are removed by passing it through a mechanical filter and an oil separator since the compressor is an oil based compressor.
A pressure swing adsorption (PSA) unit is installed with activated alumina as a dehydrating agent. Activated alumina has high affinity for water though not as high as that of the molecular-sieve zeolite, but it can produce dried gases to less than 1 ppm moisture content [15]. An activated carbon filter unit receives the biogas from the PSA unit, for complete removal of hydrogen sulphide, siloxane and any other unwanted gas in the biogas stream. All unit operations up to this point is considered part of the cleaning process. The subsequent steps comprise of operations for enrichment.
Property Raw Upgraded Min. Max. Units
Energy content 16 32.9 38.1 43.5 MJ/m3 Wobbe Index 25 39.29 50.9 55.1 Relative density 0.95 0.55 0.7 T otal Sulphur - - - 0.7 mg/m3
C omposition
CH4 55 83.1-87.2 88 98 Vol. %
CO2 38.93 1.00-4.9 - 2 Vol. %
N2 5 7.69-10 - 3 Vol. %
T otal inerts - - - 5 Vol. %
O2 0.4 0.2 - -
-H2O 0.66 - - -
-H2S 0.002 - - 4 Vol. %
Odouring Agent
Figure 2 - Schematic flow diagram of a biogas upgrading plant
D. Gas Permeation through Membrane
The most important task to achieve a fuel grade biogas is the separation of carbon dioxide from the product gas stream. As previously mentioned in the introduction to this paper, several methods exist for the removal of carbon dioxide from biogas. Gas permeation technique is employed in the methane enrichment process. Gas permeation through membrane involves the separation of individual components of the gas on the basis of the difference in their rate of permeation through a thin membrane [15]. One major factor considered for adopting this technique, aside its high efficiency, is its material requirement. The membrane technique is a dry technique, it does not require any liquid especially water which is a highly demanded commodity in Ekurhuleni [16] and also does not produce any toxic liquid waste stream. The absence of phase and temperature change phenomenon which lowers the energy requirement as well as the absence of chemical additives which lead to low environmental impact are some other advantages of gas permeation technique [14], [17].
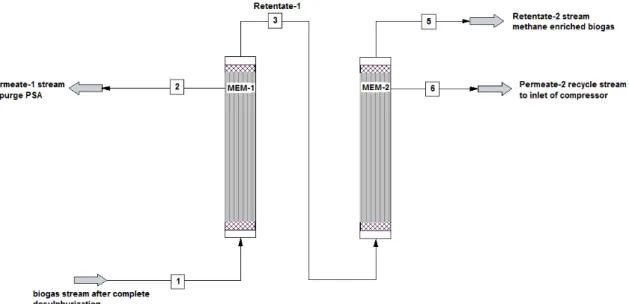
Fig. 3 shows the schematic diagram of the membrane. The membrane separation technique uses hollow fibre polymer membrane with different permeability for feed stream gas species contained in the biogas for enrichment. The rate of permeability of the different gas species is affected by the pressure gradient between the feed phase and the permeate phase. High pressure of the feed stream and low pressure of the permeate side of the membrane ensure a high flux of the biogas through the membrane. In a membrane, the separation is based on a difference in the rate of permeation
rather than on an absolute barrier to one component thus the recovered component that flows through the membrane (permeate) is never 100% pure [15]. Also since a finite partial pressure differential is required as the driving force, some portion of the permeating component remains in the residue gas (retentate) and 100% recovery is not possible [15]. Sufficient product gas quality can be achieved if adequate cleaning has been done before the enrichment process and enough membrane surface area is provided [13]. The membrane is fed from the bore side of MEM-1 at 10.311 bar & 36°C. The permeate stream of the first set of
Fig. 3- A schematic diagram depicting a double stage membrane unit
II. METHODOLOGY-SIMULATION OF THE PROCESS
In this work, the simulation of the cleaning process was done using ChemCAD, a steady state process simulator, from Chemstation. The simulator software has built-in process models than can effectively simulate the cleaning process. A built-in membrane model for gas permeation was not available in the standard version of ChemCAD; hence the membrane unit was programmed by Almeesoft Engineering and was interfaced with the simulator. The gas permeation software can calculate permeate and retentate stream of the system. The important process parameter for the simulation of the membrane are flow rates, temperature, feed composition, pressure ratio between the permeate and retentate side and stage cut (ratio of permeate to feed flow rate). The process specifications were data from the plant. The recovery of desired component, methane, is calculated as in
…………..(1)
Where is the stage cut, and is the feed and permeate fractions of the desired component respectively.
The cleaning of the biogas was done to remove water and hydrogen sulphide. The fractional conversion of the hydrogen sulphide, the limiting reactant, was 0.958. Complete desulphurization was done over a carbon filter. Activated alumina was used as the dehydrating agent for complete removal of water. Due to activated alumina strong affinity for water as compared to other gas species present in the biogas, it only adsorb water while other gas species flows through the adsorber during the dehydrating process in stream no. 12 in Table II.
The simulation considered was a double stage membrane configuration with and without recycling of the permeate stream. The membrane unit was simulated in two ways; as an enrichment only system, and as a stand-alone upgrading unit (comprising both cleaning and enrichment in one process step).
The enrichment process was simulated at a stage cut of 33.33%. Peng Robinson equation of state was assumed as the basis for the simulation with a counter-current flow mode operation which was fed from the bore side of the
membrane. In simulating the process, the composition, feed flow rate, pressure ratio, temperature and stage cut was specified. The composition of the feed biogas used for the simulation was as presented in Table I above.
The simulation also considered using the membrane as the upgrading unit that include both cleaning the biogas and its subsequent methane enrichment. A stage cut of 36.66% and 35.23% were defined as the stage cut for the first and second stage membrane simulation. The stage cut was chosen to achieve a close methane recovery to that of the plant been understudied. Carbon dioxide/methane selectivity is 9.35 and methane/nitrogen selectivity is 4.44 for the simulation. It is assumed there was no shell pressure drop but pressure drop on the permeate side was accounted for in the simulation. The fugacity of the gas species was calculated based on the equation of state for each simulated process. The viscosity, molecular weight, composition of the permeate and retentate stream and the methane recovery were results of the simulation.
III. RESULTS AND DISCUSSION
A. Biogas Cleaning
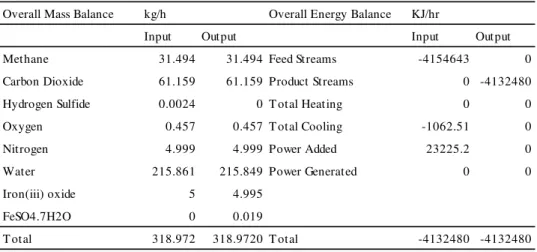
The simulated process result, mass and energy balances for the cleaning processes are presented in Tables II and III respectively. From the simulation, the cleaning process removed all hydrogen sulphide and water in the biogas. 0.0024kg of hydrogen sulphide was completely removed per hour during the process. The reaction of the hydrogen sulphide with 0.0055kg of iron III oxide produced 0.031kg hydrated Iron-II-sulphate. 0.4316kg of water was completely adsorbed over activated alumina per hour. The cleaning process simulated cannot remove nitrogen and oxygen. After cleaning, nitrogen, oxygen and carbon dioxide are the gases to be separated from methane in the enrichment process. The cleaned biogas at an inlet temperature and pressure of 27°C and 2 bar existed the
cleaning process after complete desulphurization at 38°C
TABLE II
STREAM TABLE FOR THE CLEANING OF BIOGAS
TABLE III
MASS AND ENERGY BALANCE OF THE CLEANING PROCESS
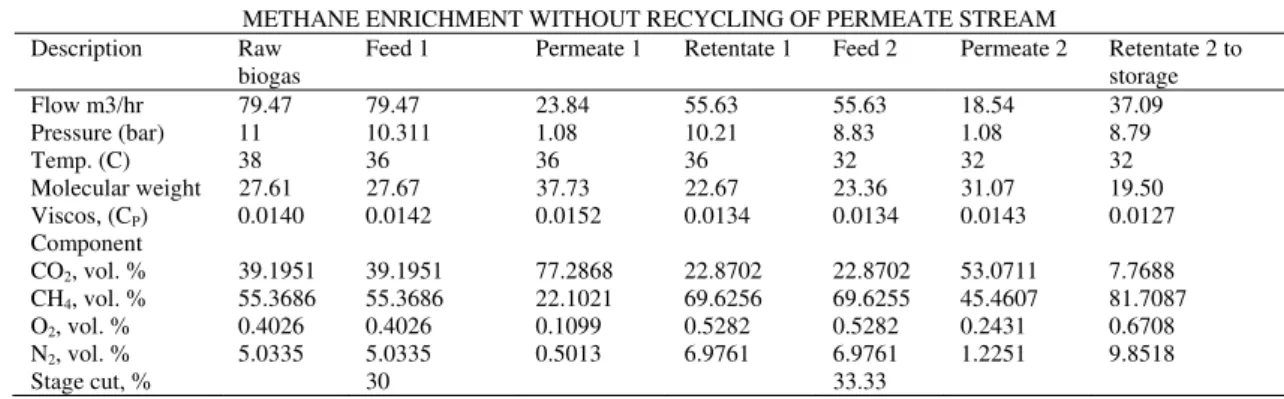
B. Biogas Enrichment
The enrichment process without recycling achieved 68.84% methane recovery as presented in Table IV. On the other hand, the enrichment process with recycling achieved 81.23% methane recovery as presented in Table V. 80.18% of carbon dioxide was removed during the enrichment process without recycling. The enrichment with recycling removed 78.42% of carbon dioxide. The difference in the percentage volume of carbon dioxide removed was because the permeate stream that was recycled contained more carbon dioxide as compared to the process that was not recycled. The percentage volume of oxygen increased from 0.4026 to 0.6708, a 66.62% increase during enrichment without recycling while the enrichment process with recycling had an increase from 0.4026 to 0.6423, a 59.37% increase. The recycling process reduces the oxygen content in the retentate stream by 4.4%. The percentage volume of nitrogen increased from 5.0335 to 9.8518, a 95.72%
increase during enrichment without recycling while the enrichment process with recycling had an increase from 5.0335 to 8.8365, a 75.56% increase. The recycling process reduces the nitrogen content in the rententate stream by 11.49%. It was also observed that the enrichment process with recycling yielded a methane recovery rate of 81.23% with an approximate heat value of 29.37MJ/m3 as compared
to that without recycling that resulted in 68.84% methane recovery. This recycling of the permeate stream increased the recovery of methane by 18%. Hence, methane recovery can be improved in a double stage gas permeation membrane by recycling the permeate stream for recompression. Also recycling of the permeate stream reduces the percentage increase of nitrogen and oxygen in the enriched bio-methane.
Stream No. 1 2 3 4 5 6 7 8 9 10 11 12 13 14 15
Stream Name Raw Biogas Fe2O3
Reactor2 feed
Desulphurise d biogas
Excess reactant
Stage 1 compression
stage2 compressio n
compressed
biogas out Water in water out Heat exchanger output
Removed vabpour
dehydrated biogas
Complete desulphriza tion
Cleaned biogas
Temp C 27 27 27.365 27.5837 27.5837 123.8412 193.6999 193.6999 15 40 40 38 38 38 38
Pres bar 2 1.081 2 2 2 6 12 12 3 3 12 11 11 11 11
Enth kcal/h -1.67E+05 -6171.8 -1.73E+05 -1.67E+05 -6214 -1.64E+05 -1.61E+05 -1.61E+05 -8.19E+05 -8.14E+05 -1.67E+05 -1585.3 -1.66E+05 -0.014152 -1.66E+05
Vapor mass frac. 1 0 1 1 0 1 1 1 0 0 0.99942 0 1 1 1
Total kmol/h 3.5693 0.0313 3.6003 3.5688 0.0313 3.5688 3.5688 3.5688 11.9585 11.9585 3.5688 0.0233 3.5455 0 3.5455
Total kg/h 98.5383 5 103.5407 98.5285 5.0136 98.5285 98.5285 98.5285 215.432 215.432 98.5285 0.4195 98.109 0.0001 98.1089
Total std L m3/h 0.186 0.001 0.1869 0.1859 0.001 0.1859 0.1859 0.1859 0.2154 0.2154 0.1859 0.0004 0.1855 0 0.1855
Total std V m3/h 80 0.7 80.7 79.99 0.7 79.99 79.99 79.99 268.03 268.03 79.99 0.52 79.47 0 79.47
Flow rates in kg/h
Methane 31.4938 0 31.4938 31.4938 0 31.4938 31.4938 31.4938 0 0 31.4938 0 31.4938 0 31.4938
Carbon Dioxide 61.1588 0 61.1588 61.1588 0 61.1588 61.1588 61.1588 0 0 61.1588 0 61.1588 0 61.1588
Hydrogen Sulfide 0.0024 0 0.001 0.0001 0 0.0001 0.0001 0.0001 0 0 0.0001 0 0.0001 0.0001 0
Oxygen 0.4569 0 0.4569 0.4569 0 0.4569 0.4569 0.4569 0 0 0.4569 0 0.4569 0 0.4569
Nitrogen 4.9995 0 4.9995 4.9995 0 4.9995 4.9995 4.9995 0 0 4.9995 0 4.9995 0 4.9995
Water 0.4316 0 0.4223 0.4195 0 0.4195 0.4195 0.4195 215.432 215.432 0.4195 0.4195 0 0 0
Iron(iii) oxide 0 5 4.9966 0 4.9945 0 0 0 0 0 0 0 0 0 0
FeSO4.7H2O 0 0 0.0119 0 0.0191 0 0 0 0 0 0 0 0 0 0
Overall Mass Balance kg/h Overall Energy Balance KJ/hr
Input Output Input Output
Methane 31.494 31.494 Feed Streams -4154643 0
Carbon Dioxide 61.159 61.159 Product Streams 0 -4132480
Hydrogen Sulfide 0.0024 0 T otal Heating 0 0
Oxygen 0.457 0.457 T otal Cooling -1062.51 0
Nitrogen 4.999 4.999 Power Added 23225.2 0
Water 215.861 215.849 Power Generated 0 0
Iron(iii) oxide 5 4.995
FeSO4.7H2O 0 0.019
TABLE IIV
METHANE ENRICHMENT WITHOUT RECYCLING OF PERMEATE STREAM Description Raw
biogas Feed 1 Permeate 1 Retentate 1 Feed 2 Permeate 2 Retentate 2 to storage
Flow m3/hr 79.47 79.47 23.84 55.63 55.63 18.54 37.09
Pressure (bar) 11 10.311 1.08 10.21 8.83 1.08 8.79
Temp. (C) 38 36 36 36 32 32 32
Molecular weight 27.61 27.67 37.73 22.67 23.36 31.07 19.50 Viscos, (CP) 0.0140 0.0142 0.0152 0.0134 0.0134 0.0143 0.0127
Component
CO2, vol. % 39.1951 39.1951 77.2868 22.8702 22.8702 53.0711 7.7688 CH4, vol. % 55.3686 55.3686 22.1021 69.6256 69.6255 45.4607 81.7087 O2, vol. % 0.4026 0.4026 0.1099 0.5282 0.5282 0.2431 0.6708 N2, vol. % 5.0335 5.0335 0.5013 6.9761 6.9761 1.2251 9.8518
Stage cut, % 30 33.33
TABLE V
METHANE ENRICHMENT WITH RECYCLING OF PERMEATE STREAM Description Raw
biogas Compressor suction with recycle stream
Compressor discharge/ Feed 1
Permeate 1 Retentate 1 Feed 2 Permeate 2 /Recycled for recompression
Retentate 2 to storage
Flow m3/hr 79.47 98.01 98.01 32.67 65.34 65.34 21.78 43.56
Pressure (bar) 1 1.083 8.62 1.08 8.53 8.51 1.08 8.46
Temp. (C) 38 27 32 32 32 30 30 30
Molecular weight 27.61 28.31 28.31 37.92 23.51 23.51 31.40 19.57 Viscos, (CP) 0.0140 0.0139 0.0141 0.0150 0.0134 0.0133 0.0143 0.0126 Component
CO2, vol. % 39.1951 41.8237 41.8237 77.9792 23.7488 23.7488 54.3279 8.4592 CH4, vol. % 55.3686 53.4954 53.4954 21.4824 69.4994 69.4994 44.3742 82.0621 O2, vol. % 0.4026 0.3698 0.3698 0.1020 0.5037 0.5037 0.2265 0.6423 N2, vol. % 5.0335 4.3111 4.3111 0.4364 6.2481 6.2481 1.0714 8.8365
Stage cut, % 33.33 33.33
C. Biogas Upgrading
The simulated upgrading process includes both the cleaning and the enrichment process. 99.8% of the water in the feed stream was removed while hydrogen sulphide was reduced to 1ppm in the retentate-2 stream. The concentration of oxygen rose by 69.68% from 0.4000 to 0.6787 and nitrogen by 84.05% from 5.0000 to 9.2023 in the retentate-2 stream in Table VI below. 82.29% of carbon dioxide was removed from biogas during the enrichment process. The simulated process resulted in 80.14% methane recovery with an approximate heat value of 24.97MJ/m3. Table VI is the
result of the simulated upgrading process.
The concentration of nitrogen was slightly reduced in all the simulated processes. This difference is due to the selectivity
chosen for the simulation and close kinematic diameter of methane and nitrogen. The methane/nitrogen selectivity was 4.44 and the kinematic diameter for methane and nitrogen are 3.8Å and 3.64Å respectively. When polymer based membrane is used for biogas enrichment as in the case of the plant under study close kinematic diameter causes the permeability characteristics of the gas species to be similar. The use of membrane for separation of nitrogen and methane is possible but solubility of each gas is used instead of it kinetic diameter. Methane, being more condensable than nitrogen, is about seven times more soluble in certain polymers. This solubility difference can be used to produce membranes that are four times more permeable to methane than nitrogen [18].
TABLE VII
BIOGAS UPGRADING PROCESS WITH RECYCLING OF PERMEATE STREAM Description Raw
biogas
Compressor suction with recycle stream
Compressor discharge /Feed 1
Permeate 1 Retentate 1 Feed 2 Permeate 2/Recycled for recompression
Retentate 2 to storage
Flow m3/hr 80 103 103 37.77 65.23 65.23 22.98 42.25
Pressure (bar) 1 1.083 10.311 1.08 10.23 8.82 1.08 8.78
Temp. (C) 27 28 36 36 36 33 33 33
Molecular weight 27.61 28.02 28.02 37.26 22.67 22.67 29.21 19.11 Viscos, (CP) 0.0140 0.0141 0.0142 0.0151 0.0134 0.0132 0.0141 0.0126
Composition
CO2 vol. % 38.9341 40.7648 40.7648 75.5061 20.6525 20.6525 46.4014 6.6451 CH4 vol. % 55.0000 54.1037 54.1037 22.5345 72.3796 72.3796 52.0209 83.4626 O2 vol. % 0.4000 0.3979 0.3979 0.1085 0.5357 0.05357 0.2730 0.6787 N2 vol. % 5.0000 4.2208 4.2208 0.4428 6.4080 6.4080 1.2544 9.2023 H2S vol. % 0.0020 0.0017 0.0017 0.0042 0.0002 0.0002 0.0005 0.000001 H2O vol. % 0.6639 0.5299 0.5299 1.4040 0.0239 0.0239 0.0497 0.0012
IV. CONCLUSION
Methane recovery for the enrichment processes with recycling of permeate was 81.23% and the process without recycling was 68.84%. The upgrading process had a methane recovery of 80.14%. The heat value of the enrichment process was approximately 29.37MJ/m3 and the
upgrading process was 24.97MJ/m3. Despite the slight
difference of 1.36% in the methane recovery between the enrichment and upgrading process, the heat value of the enrichment process is higher by 4.4MJ/m3 when compared
to the upgrading process. Recycling the permeate stream increased the methane recovery by 18% when compared to the simulation without recycling. Also recycling reduces the percentage increase of nitrogen and oxygen in the retentate-2 stream which is in this case the enriched bio-methane. Cleaning of biogas before upgrading ensures that a higher heat value is obtained per unit volume of the bio-methane produce.
This paper only considered effect of cleaning of biogas and recycling permeate stream on methane recovery for a double staged membrane. It does not considered the efficiency of the process and does not include energy demand for recycling of the permeate stream.
V. RECOMMENDATION
The desired methane recovery of the simulated process can be improved if the selectivity factor of the membrane for carbon dioxide/methane is increased and a technique for reduction of nitrogen is incorporated into the simulation.
ACKNOWLEDGEMENT
The authors wishes to acknowledge South African National Energy Development Institute (SANEDI) for providing funding for this project, the University of Johannesburg for providing conducive environment for research and learning and Dr. Alexander Narinsky of Almeesoft Engineering for providing the software for the gas permeation simulation.
REFERENCE
[1] Johansson, Nina. Production of liquid biogas, LBG, with Cryogenic and Conventional Upgrading Technology-Description of Systems and Evaluation of Energy Balances. Department of Technology & Society; Environmental & Energy Systems Studies, Lunds Universitet. Lunds : Lunds Universitet, 2008. p. 94.
[2] Nozic, Mirsada. Removal of Carbon dioxide from Biogas. Department of Chemical Engineering, Lund University. Lund, Sweden : Lund University, 2006. p. 5.
[3]Klaus von Mitzlaff. Engines for Biogas: Theory, Modification, Economic Operation. Wiesbaden:Vieweg : Deutsches Zentrum fur Entwicklungstechologien-GATE, 1988. p. 133. 3-528-02032-6.
[4] Eriksson, Philip and Olsson, Martin. The Potential of Biogas as Vehicle Fuel in Europe - A technological Innovation System Analysis of the Emerging Bio-methane Technology. Goteborg : Chalmers University of Technology, 2007. 1404-8167.
[5] Ntombi, Nkosi. Green Transport for Joburg. S1-National (01) [Newspaper]. Johannesburg, Gauteng, South Africa : The NEWAGE, February 10, 2014. Vol. V, 28, p. 6. www.thenewage.co.za.
[6] Herringshaw, Brian. A study of Biogas utilization Efficiency Highlighting Internal Combustion Electrical Generator Units. College of Food, Agricultural & Biological Engineerings, The Ohio State University. Ohio : Ohio State University, 2009. p. 28.
[7] McDonald, N. S. Biogas Composition and Clean-Up Option. New York : AgStar, 2012. Enhancing Environmental and Economic Sustainability Conference. pp. 127-129.
[8] Sasol. Home:product:gas. Sasol Web Site. [Online] Energy and Chemical Company. Sasol is the major supplier of natural gas to industries and gas stations in South Africa [Cited: 02 12, 2013.] http://www.sasol.co.za/products/gas/ natural-gas-0.
[9] Persson, Margareta. Evaluation of Upgrading Technique for Biogas. Lund Institute of Technology. Lund : swedish Gas Center, 2003. Report SGC 142. 1102-7371.
[10] Molino, A., et al., et al. Biogas upgrading via membrane process: Modelling of Pilot Plant Sclae and the End uses for the Grid Injection. 107, 2012, Fuels, pp. 585-592.
[11] Sustainable Transport Group. Biogas as Road Transport Fuel: An Assessment of the Potential Role of Biogas as a Renewable Transport Fuel. National Society for Clean Air & Environmental Protection. England : NSCA, 2006. ISBN 0-903-47461-1.
[12] Gislason, Stephen J. Air and Breathing. Canada : Alpha Education Books, 2011. 978-1-894787-73-4.
[13] Miltner, M., Makaruk, A. and Harasek, M. Application of Gas Permeation for Biogas Upgrade-Operational Experience of Feeding Biomethane into the Austrian Gas Grid. Institute of Chemical Engineering, Vienna University of Technology. Vienna : s.n., 2007. p. 7.
[14] Masebinu, S. O, Aboyade, A. O and Muzenda, E. Enrichment of Biogas for use as Vehicular Fuel: A Review of the Upgrading Techniques. [ed.] Parvinder S. Sandhu and Edison Muzenda. Cap Town : International Institute of Engineer, 2013. International Conference on Advances in Engineering Sciences and Applied Mathematics. pp. 127-136. 978-93-82242-51-2.
[15] Arthur, Kohl L. and Richard, Nielsen B. Gas Purification. New York : Gulf Publishing Company, 1997.
[16] Tindale, Mark and Sagris, Thomas. Managing Water Use in Scarce Environment: A Catalogue of Case Studies. Washington : 2030 Water Resources Group, 2013. p. 54.
[17] Chowdhury, Mohammad Hassan Murad. Simulation, Design and Optimization of Membrane Gas Separation, chemical Absorption and Hybrid Processes for CO2 Capture. Chemical Engineering, University of Waterloo. waterloo : University of Waterloo, 2011. p. 407. [18] Jariwala, Ankur and Lokhandwala, Kaaeid A. Nitrogen-Rejecting