1
Sheikh Md. Rabiul Islam,
2Xu Huang,
3Kim Le
1,2,3
Faculty of Education Science Technology & Mathematics, University of Canberra, Australia
{Sheikh.Islam, Xu.Huang, Kim.Le}@canberra.edu.au
ABSTRACT
Magnetic Resonance (MR) image is a medical image technique required enormous data to be stored and transmitted for high quality diagnostic application. Various algorithms have been proposed to improve the performance of the compression scheme. In this paper we extended the commonly used algorithms to image compression and compared its performance. For an image compression technique, we have linked different wavelet techniques using traditional mother wavelets and lifting based Cohen-Daubechies-Feauveau wavelets with the low-pass filters of the length 9 and 7 (CDF 9/7) wavelet transform with Set Partition in Hierarchical Trees (SPIHT) algorithm. A novel image quality index with highlighting shape of histogram of the image targeted is introduced to assess image compression quality. The index will be used in place of existing traditional Universal Image Quality Index (UIQI) “in one go”. It offers extra information about the distortion between an original image and a compressed image in comparisons with UIQI. The proposed index is designed based on modelling image compression as combinations of four major factors: loss of correlation, luminance distortion, contrast distortion and shape distortion. This index is easy to calculate and applicable in various image processing applications. One of our contributions is to demonstrate the choice of mother wavelet is very important for achieving superior wavelet compression performances based on proposed image quality indexes. Experimental results show that the proposed image quality index plays a significantly role in the quality evaluation of image compression on the open sources “BrainWeb: Simulated Brain Database (SBD) ”.
KEYWORDS
CDF 9/7,MRI, Q(Kurtosis),Q(Skewness), SPIHT, UIQI .
1. I
NTRODUCTIONIn this paper, we have used the technology called lifting based on CDF 9/7 and different mother wavelet families to compress the test images by using Set Partition in Hierarchical Trees (SPIHT) algorithm [6]. We have also proposed a new image quality index for selection of mother wavelets and image compression over BrainWeb: Simulated Brain Database[7]. This new image quality index with highlighting shape of histogram will be introduced to assess image qualities. The image intensity histogram expresses a desired shape. In statistics, a histogram is a graphical representation showing a visual impression of the data distribution. It is used to show the frequency scattering of measurements. The total area of the histogram is equal to the number of data. The axis is generally specified as continuous, non-overlapping intervals of brightness values. The intervals must be adjacent and are chosen to be of the same size. A graphical representation of image histogram displays the number of pixels for each brightness value in a digital image. Figure 1 shows the frequency at which each grey-level occurs from 0(black) to 255(white).Histogram is given as ℎ = , where is the intensity value , is the number of pixels in image with intensity and N is the total number of samples in the input image respectively.
In recent years, many IQA methods have been developed. Video quality experts group (VQEG) and International Telecommunication Union (ITU) are working for standardization [8] [9]. Laboratory for image and video engineering (LIVE) is also working for developing the objective quality assessment of an image and video [10].
We integrate the shape of histogram into the Universal Image Quality Index metric. The index is the fourth factor added to existing Universal Image Quality Index (UIQI) to measure the distortion between original images and distorted images.Hence this new image quality index is a combination of four factors. The UIQI index approach does not depend on the image being tested and the viewing conditions of the individual observers. The targeted image is normally a distorted image with reasonable high resolution. We will consider a large set of images and determine a quality measurement for each of them. Image quality indexes are used to make an overall quality assessment via the proposed new image quality index. In this paper the performance evaluation of the proposed index and compressed image will be tested on open source “BrainWeb: Simulated Brain Database (SBD)” .The proposed image quality index will be compared with other objective methods. The image quality assessment has focused on the use of computational models of the human visual system [11]. Most human vision system (HVS)-based assessment methods transform the original and distorted images into a “perceptual representation” that takes into account near-threshold psychophysical properties. Wang et al. [12] and [13] measured structure based on a spatially localized measure of correlation in pixel values structural similarity (SSIM) and in wavelet coefficients MS-SSIM. Visual signal to noise ratio (VSNR)[14] is a wavelet based for quantifying the visual fidelity of distorted images based on recent psychophysical findings reported by authors involving near –threshold and super threshold distortion.
This paper is structured as follows. Section 2 describes our proposed algorithm, including wavelet logical transform, CDF 9/7 wavelet transform, the selections of mother wavelet and SPIHT coding algorithm. Section 3 shows proposed image quality index. Section 4 demonstrates the simulation results and discussion. Finally in Section 5, a conclusion is presented.
2. P
ROPOSEDA
LGORITHM[15]. An analysis and synthesis system has the perfect reconstruction property if and only if x ' =
x .
The mathematical representations of and can be defined as
!
" !" # $ (1)
where and are the lengths of ℎ and respectively. In order to achieve perfect reconstruction of a signal, the two channel filters shown in Fig. 1 must satisfy the following conditions[1]: ℎ % ℎ % & + % % = 2 ℎ % ℎ −% & + % −% & = 0$ (2)
)
(
~
−1z
h
)
(
~
−1z
g
2 ↓ 2 ↓)
(
z
−1h
) ( −1 z g 2 ↑2
↑
L y H yx
x' Figure 1: Discrete wavelet transform (or subband transform) analysis and synthesis system: the forward transform consists of two analysis filters ℎ(low pass) and (high pass) followed by subsampling, while the inverse transform first up samples and then uses two synthesis filters ℎ (low pass) and (high pass). In the lifting scheme, the impulse response coefficients h and g are expressed in Laurent polynomial representation of filter h & g can be defined as ℎ % = +ℎ % (3)% = + % (4) where m and n are positive integers. The analysis and synthesis filters as shown in Fig.1 are further decomposed into the polyphase representations which are expressed as ℎ % = ℎ, % + % &ℎ- % (5)
% = , % + % & - % (6)
ℎ % = ℎ, % + % &ℎ- % (7)
% = , % + % & - % (8)
where ℎ, % = ℎ % / 0 ℎ- % = ℎ 1&%
ℎ, % =ℎ % + ℎ −%2 / 0 ℎ- % =ℎ % − ℎ −%2% &
, % = 2 % / 0 - % = 2 1&%
The two polyphase matrices of the filter is defined as
3 % = 4 56 76
#56
#768 (9)
3 % = 4 5 6 76
#5 6
#768 (10)
Where ℎ, / 0 , contain even coefficients, and ℎ- / 0 - contain odd coefficients.
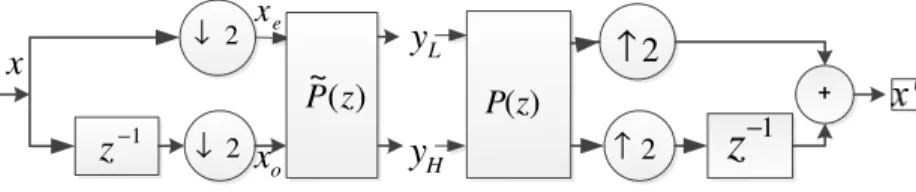
The polyphase representations are derived using Z-transform and the subscript e and o denote the even and odd sub-components of the filters. These are reduced the computation time. The wavelet transform now is represented schematically in Figure 2 .The perfect reconstruction properties is given by
3 % 3 % & = 9 (11)
where I is 2 × 2 identity matrix.
The forward discrete wavelet transform using the polyphase matrix [1] [23] is represented as
4 "668 = 3 % 4 56
6 768 (12)
and the inverse discrete wavelet transform
4 5 6
6 768 = 3 % 4
6
"68 (13)
Finally, the lifting sequences are generated by employing Euclidean algorithm which factorizes the polyphase matrix for a filter pair, reader read reference[16].
1
−
z
2 ↓
2
↓
z
−1)
(
~
z
P
P(z)2
↑
2
↑
L
y
H
y
x
e
x
o
x
Figure 2: Polyphase representation of wavelet transform: first subsample of input signal ; into even as ;, and odd as ;-, then apply the dual polyphase matrix. For an inverse transform, apply the polyphase matrix and then join even and odd.
Module Splitting: In this module, the original signal <is divided into two disjoint parts, i.e., samples < 2 + 1 and < 2 that denotes all indexed and even-indexed and odd-indexed samples of < , respectively [17].
Module Lifting: Lifting consist of three basic steps: Split, Predict, and Updating as shown below.
a) Split -In this stage the input signal is divided in to two disjoint sets, the odd <[2 + 1] and the even samples <[2 ]. This splitting is also called the Lazy Wavelet transform.
b) Predict-In this stage the even samples are used to predict the odd coefficients. This predicted value, 3 < [2 ] , is subtracted from the odd coefficients to give error in the prediction.
0[ ] = <[2 + 1] − 3 <[2 ] (14)
Here 0[ ] are also called the detailed coefficients.
c) Update-In this stage, the even coefficients are combined with 0[ ] which are passed through an update function, U (.) to give
A[ ] = <[2 ] + B 0[ ] (15)
Module Scaling: A normalization factor is applied to 0 and C , respectively. In the even-indexed part C is multiplied by a normalization factor Ke to produce the wavelet sub
band <&. Similarly in the odd-index part the error signal 0 is multiplied by D- to obtain the wavelet sub band < & .
Figure 3: The lifting-based WT [17].
The Lifting scheme of the wavelet transform Cohen-Daubechies-Feauveau wavelets with the low-pass filters of the length 9 and 7 (CDF 9/7) goes through of four steps: two prediction operators (‘/’ and ‘G’) and two update operators ‘H’ and ‘0’) as shown it Figure.7.The analysis filter ℎ has 9 coefficients, while the synthesis filter has 7 coefficients. Both high pass filters , have 4 vanishing moments. We chose the filter with 7 coefficients filter because it gives rises to a smoother scaling function than the 9 coefficients one. In this fact, we run the factoring algorithm starting from the analysis filter[1]:
ℎ, % = ℎJ % + % + ℎ % + % & + ℎ-and ℎ- % = ℎK % + % + ℎ& % + 1
, % = − -− % + % & and - % = & 1 + % & + K % + % &
-= ℎ-− 2ℎJℎ&/ℎK &= ℎ − ℎJ− ℎJℎ&/ℎK C-= ℎ&− ℎK− ℎK -/&
If we now let
/ = ℎJ/ℎK≈ −1.58613432, G = ℎK/&≈ −0.05298011854,
H = &/C-≈ 0.8829110762, 0 = C-/-≈ 0.4435068522,
D = -− 2&≈ 1.149604398.
Since the 9/7 tape wavelet filter is symmetric we can present h and g in the z-domain .Hence, a poly-phase matrix 3 % presents the filter pair ℎ, :
3 % = Uℎℎ, %
- %
, %
- % V = U
ℎJ % + % + ℎ % + % & + ℎ -ℎK % + % + ℎ& % + 1
& 1 + % & + K % + % & & 1 + % & + K % + % & V
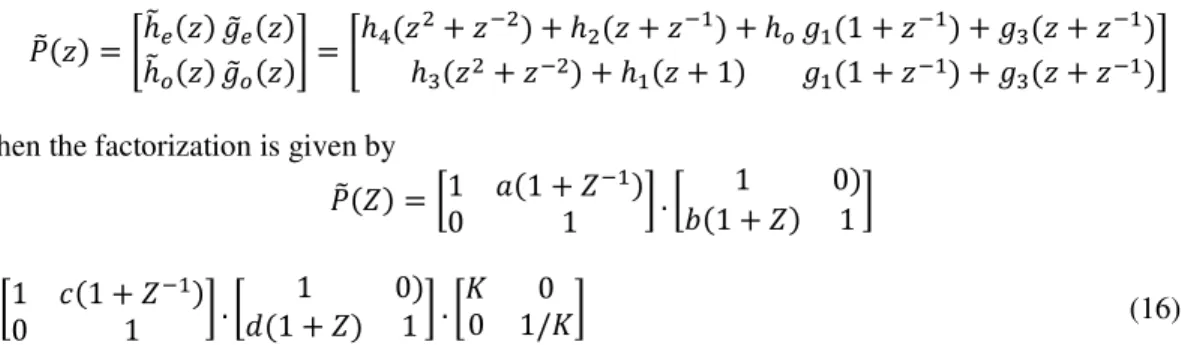
then the factorization is given by
3 W = X1 / 1 + W0 1 & Y . XG 1 + W1 01 Y
. X1 H 1 + W0 1 & Y . X0 1 + W1 01 Y . XD0 1/DY0 (16)
We have found four “lifting” steps and the two “scaling” steps from Fig.4 with same parameter as follows:
Z [
\] 2 + 1 ← < 2 + 1 + a × [X 2n + X 2n + 2 ]] 2 ← < 2 + b × [Y 2n − 1 + Y 2n + 1 ] ] 2 + 1 ← ] 2 + 1 + c × [Y 2n + Y 2n + 2 ]
] 2 ← ] 2 + d × [Y 2n − 1 + Y 2n + 1 ]
$
(17)
] 2 + 1 ← D × ] 2 + 1 ,
] 2 ← f&gh × ] 2 , $ (18)
Figure 4: Lifting scheme of the analysis side of the CDF 9/7 filter bank.
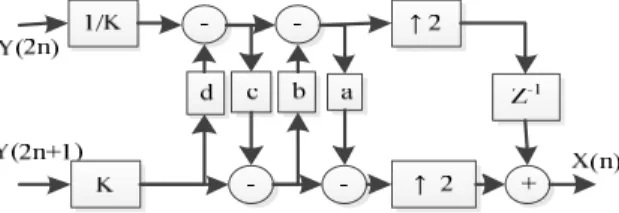
The synthesis side of the CDF9/7 filter bank simply inverts the scaling, and reverses the sequence of the lifting and update steps. Fig.5 shows the synthesis side of the filter bank using lifting structure to reconstruct of the signal or image.
Figure 5: Lifting implementation of the synthesis side of the CDF 9/7 filter bank.
Selection of Mother Wavelets-the choice of wavelets is crucial and determines the image compression performance. The choice of wavelet functions depends on the contents and resolution image. The best way for choosing wavelet function is based on the quality of objective picture and the quality of subjective picture. In this paper, we have considered MR images only and the major mother wavelets are including most popular wavelets such as Daubechies Wavelet, Coiflets Wavelet, Biorthogonal Wavelet, Reverse Biorthogonal Wavelet , Symlets Wavelet, Morlet Wavelet, and Discrete Mayer Wavelet. The different mother wavelets are studied on different classes of images based on the performance measurements, including novel proposed image quality index which are normally used for quality of images . These performances are computed for the cases of above six mother wavelets for compressing the images of different classes.
Set Partition in Hierarchical Trees (SPIHT) [6]is the most popular image compression method. It provides such kind of features like as the highest image quality, progressive image transmission, fully embedded coded file, simple quantization algorithm, fast coding/decoding, completely adaptive, lossless compression, and exact bit rate coding and error protection. It makes use of three lists: (i) the List of Significant Pixels (LSP), (ii) List of Insignificant Pixels (LIP) and (iii) List of Insignificant Sets (LIS). These are coefficient location lists that contain their coordinates in this algorithm. After the initialization, the algorithm takes two stages for each level of threshold – the sorting pass (in which lists are organized) and the refinement pass (which does the actual progressive coding transmission). The result is showed in the form of a bit stream. It is capable of recovering the image perfectly by coding all bits of the transform.
3. P
ROPOSEDI
MAGEQ
UALITYI
NDEXThe quality index proposed by Wang-Bovik [18] has been proven very efficient on image distortion performance evaluation. It considers three factors for image quality measurement. They consider two pixel gray level real-value sequences ; = i;&, … … … ; k and = i &, … … … k. They are obtained by the following expressions:
l = && & ; − ;m , l = && & − n , l = && & ; − ;m − n
Where ;m is the mean of ;, n is the mean of l is variance of x, l is variance of y and l is the covariance of x, y
Then, we can compute a quality factor, Q:
o = Jpqr m n
m
s1 ns tpqs1prsu (19)
Q can be decomposed into three components as
o = pqr
pqpr∙
m n
m
s1 ns ∙
pqpr
In equation (20), the first component is the correlation coefficient between ; and , which measures the degree of linear correlation between ; and . The second component measures how close the mean luminance is between ;and . The third component measures how similar the contrasts of the images are as l and l can be viewed as estimation of the contrasts of ;and . Hence, we have three components for a quality factor, Q which can be rewrite as:
o = Hw xy/z{w ∙ y|}{ / Hx ∙ Hw z /Cz
The values of the three components are in the range of [0, 1]. Therefore, the quality metric is normalized between[0, 1].
Besides these three factors, many studies show that in human visual system (HVS), histogram of image information plays a very important role, when human subjective judges the quality of an image.It does work by redistributing the gray-levels of the input image by using its probability distribution function. Although its preserves the brightness in the output image with a significant contrast enhancement. It may produce images which do not look as natural as the input ones. To take the advantages of known characteristics of human perception, we introduce the shape of histogram with the Universal Image Quality Index metric. This proposed image quality of index will be tested throughout standard database of images.
We use the statistical differences to develop a novel image quality index. To find out the shape of histogram from distorted image, we computed its kurtosis and skewness. Skewness, indicating a degree of asymmetry of a histogram, is given by the following equation:
D~ ,• ,€€= n
• ‚
& ۥ ` (21)
Kurtosis quantifies a degree of histogram peakiness and tail weight. That is, data sets with high kurtosis tend to have a distinct peak near the mean and have a heavy tail. Data sets with low kurtosis tend to have a flat top near the mean. It can be described by the following equation
Dƒ„…†-€ €= n
‡ ‚
& €‡ (22)
The formula for modified skewness is:
Dˆ-‰ Š ~ ,• ,€€ = ‹ n‹
• ‚
‹ &‹€• (23)
where is the number of pixels at image distortion value , n is the mean value of image distortion, C is the standard deviation.
The proposed new image quality index Q can be expressed by the four components as below:
o = pqr
pqpr∙
m n ms1 ns ∙
pqpr
tpqs1prsu.
ƒqƒr
ƒqs1ƒrs (24)
o = Hw xy/z{w ∙ y|}{ / Hx ∙ Hw z /Cz ∙ Cℎ/Œx
The new quality index will be applied to local regions using a sliding window for objective image quality analysis. For example starting from the top-left corner of the image, a sliding window with the size of • × • is moving pixel by pixel horizontally and then vertically through all pixels of the image. We assume that at the position of {, Ž in the target image, the local quality index o• can be computed as equation (25). Here, the row number and column number of the image are and }, then the overall normalized quality index is:
o = ×+& & +• &o• (25)
The overall performance of the proposed image quality index is based on shape of histogram with UIQI [18] can be further described in Figure 6. In order to show the efficiency of this image quality index, the open source “BrainWeb: Simulated Brain Database (SBD) [7] is used for testing, which will be discussed in the next section.
Figure 6: Flow chart of propose image quality index.
4. R
ESULTSA
NDD
ISCUSSIONFor the simplicity, we have chosen MR images size 512x512 (grayscale) from BrainWeb: Simulated Brain Database (SBD) (Fig.17(a) as an example with specifications T1 AI msles2 1mm pn3 rf20). The algorithms and proposed image quality index are implemented in MATLAB. In our experiment, we have used mother wavelet families: Haar Wavelet (HW), Daubechies (db), Symlets (Sym), Coiflets (Coif), Biorthogonal (bior), Reverse Biorthogonal (rbior) & discrete Meyer (dmey). The quality of compressed image depends on the number of decompositions. We have used 3rd level decomposition for these experiments.
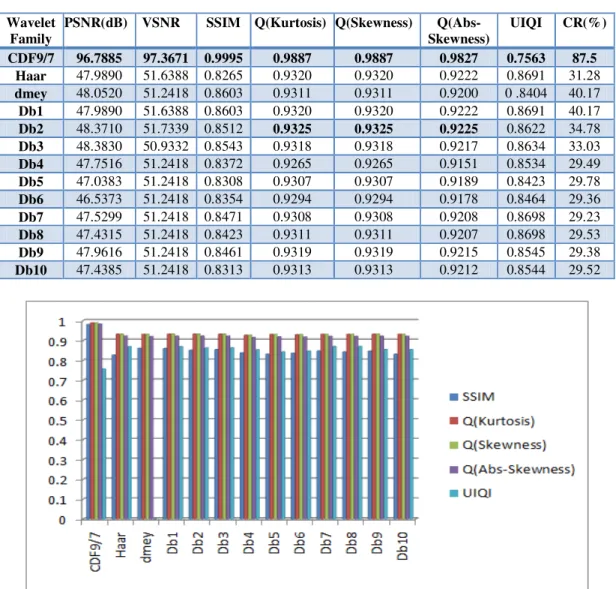
4.1 Daubechies family and CDF 9/7 wavelet with SPIHT-Based on the Table 1 and Fig.7-8 shows that the CDF 9/7 wavelet has a highest PSNR value approximately 97 dB and Compression ratio (CR) 87.5 % and proposed image quality index ,Q (Kurtosis) value 0.9887, Q (Skewness) value 0.9887 & Q (Abs-Skewness) value 0.9827. On the other hand the wavelets, Daubechies 2,
has the highest PSNR values as well as proposed image quality index, Q (Kurtosis) value 0.9325, Q (Skewness) value 0.9325& Q (Abs-Skewness) value 0.9225. However when the comparing the proposed image quality index and other IQA aspects, the top results are of CDF9/7, Daubechies 2
which is satisfy the best suitable wavelet image compression with SPIHT.
Table 1 Wavelet Family: Daubechies, Discrete Meyer, Haar & CDF9/7 wavelet transform with SPIHT
Wavelet Family
PSNR(dB) VSNR SSIM Q(Kurtosis) Q(Skewness)
Q(Abs-Skewness)
UIQI CR(%)
CDF9/7 96.7885 97.3671 0.9995 0.9887 0.9887 0.9827 0.7563 87.5
Haar 47.9890 51.6388 0.8265 0.9320 0.9320 0.9222 0.8691 31.28
dmey 48.0520 51.2418 0.8603 0.9311 0.9311 0.9200 0 .8404 40.17
Db1 47.9890 51.6388 0.8603 0.9320 0.9320 0.9222 0.8691 40.17 Db2 48.3710 51.7339 0.8512 0.9325 0.9325 0.9225 0.8622 34.78 Db3 48.3830 50.9332 0.8543 0.9318 0.9318 0.9217 0.8634 33.03 Db4 47.7516 51.2418 0.8372 0.9265 0.9265 0.9151 0.8534 29.49 Db5 47.0383 51.2418 0.8308 0.9307 0.9307 0.9189 0.8423 29.78 Db6 46.5373 51.2418 0.8354 0.9294 0.9294 0.9178 0.8464 29.36 Db7 47.5299 51.2418 0.8471 0.9308 0.9308 0.9208 0.8698 29.23 Db8 47.4315 51.2418 0.8423 0.9311 0.9311 0.9207 0.8698 29.53 Db9 47.9616 51.2418 0.8461 0.9319 0.9319 0.9215 0.8545 29.38
Db10 47.4385 51.2418 0.8313 0.9313 0.9313 0.9212 0.8544 29.52
Figure 8: Wavelet versus PSNR, VSNR and Compression ratio (CR) (Daubechies family and CDF9/7).
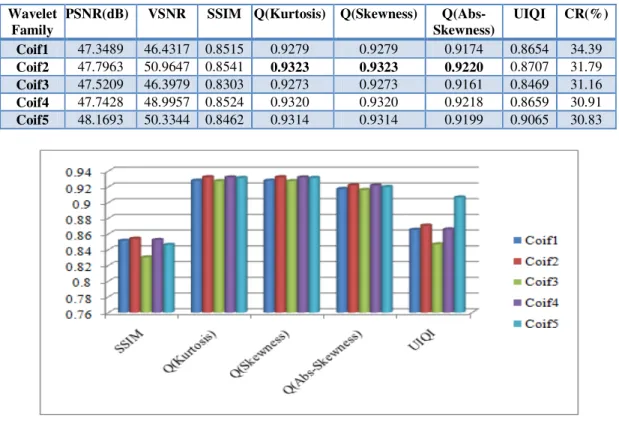
4.2 Coiflet Family with SPIHT-From Table 2 and Fig.9&10, it appears that the wavelet Coiflet 1
has the highest compression ratio(CR) and Coiflet 5 has the highest PSNR 49.13dB and % and proposed image quality index ,Q (Kurtosis) value 0.9323, Q (Skewness) value 0.9323& Q (Abs-Skewness) value 0.9220 for Coiflet 2. However, when comparing the proposed index and other IQA aspects, the top results are of Coiflet 2 in this family.
Table 2 Wavelet Family: Coiflet
Wavelet Family
PSNR(dB) VSNR SSIM Q(Kurtosis) Q(Skewness)
Q(Abs-Skewness)
UIQI CR(%)
Coif1 47.3489 46.4317 0.8515 0.9279 0.9279 0.9174 0.8654 34.39
Coif2 47.7963 50.9647 0.8541 0.9323 0.9323 0.9220 0.8707 31.79
Coif3 47.5209 46.3979 0.8303 0.9273 0.9273 0.9161 0.8469 31.16
Coif4 47.7428 48.9957 0.8524 0.9320 0.9320 0.9218 0.8659 30.91
Coif5 48.1693 50.3344 0.8462 0.9314 0.9314 0.9199 0.9065 30.83
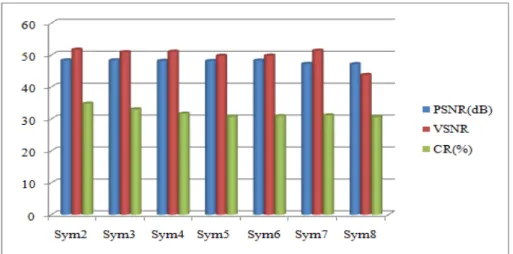
4.3 Symlet Family with SPIHT-The result shown in Table 3 and Fig.11&12, it appears that the wavelet Symlet 3 has the highest PSNR value as 48.3830 dB and Symlet 2 has the highest Compression ratio(CR) 34.78% and. and proposed image quality index ,Q (Kurtosis) value 0.9323, Q (Skewness) value 0.9323& Q (Abs-Skewness) value 0.9220 for Coiflet 2. However, when comparing the proposed index and other IQA aspects, the top results are of Symlet 8 in this family.
Figure 10: Wavelet versus PSNR,VSNR and Compression ratio (CR) (Coiflet family).
Table 3 Wavelet Family: Symlet with SPIHT
Wavelet Family
PSNR(dB) VSNR SSIM Q(Kurtosis) Q(Skewnes
s)
Q(Abs-Skewness)
UIQI CR(%)
Sym2 48.3710 51.7339 0.8512 0.9325 0.9325 0.9225 0.8622 34.78
Sym3 48.3830 50.9332 0.8543 0.9318 0.9318 0.9217 0.8634 33.03
Sym4 48.1998 51.0804 0.8490 0.9298 0.9298 0.9169 0.8639 31.66
Sym5 48.1827 49.8120 0.8431 0.9273 0.9273 0.9162 0.8566 30.72
Sym6 48.2877 49.8413 0.8404 0.9322 0.9322 0.9219 0.8536 30.88
Sym7 47.2442 51.3857 0.8462 0 .9310 0.9310 0.9203 0.8579 31.12
Sym8 47.1674 43.7892 0.8526 0.9331 0.9331 0.9227 0.8652 30.63
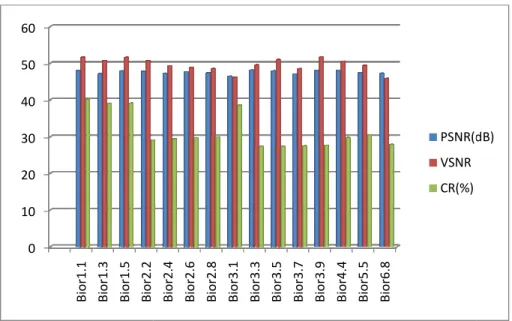
4.4 Biorthogonal Family with SPIHT-Table 4 and Figure.16 &17, it appears that the wavelet
Biorthogonal 1.1 has the highest Compression ratio(CR) 40.17% and Biorthogonal 3.3 has the highest PSNR value is 48.1569 dB and proposed image quality index ,Q (Kurtosis) value 0.9343, Q (Skewness) value 0.9343& Q (Abs-Skewness) value 0.9239 for Coiflet 2 Biorthogonal 3.1.
However, when comparing the proposed index and other IQA aspects, the top results are of
Figure 11: Wavelet versus proposed Q and other QA methods (Symlet family).
Figure 12: Wavelet versus PSNR,VSNR and Compression ratio(CR) (Symlet family).
Table 4 Wavelet Family: Biorthogonal with SPIHT
Wavelet Family
PSNR(dB) VSNR SSIM Q(Kurtosis) Q(Skewness)
Q(Abs-Skewness)
UIQI CR(%)
Bior1.1 47.9890 51.6388 0.8603 0.9320 0.9320 0.9222 0 .8691 40.17
Bior1.3 47.1478 50.7201 0.8604 0.9335 0.9335 0.9236 0.8843 39.01
Bior1.5 47.8690 51.6038 0.8536 0.9303 0.9303 0.9176 0.8693 39.1
Bior2.2 47.7850 50.7439 0.8528 0.9301 0.9301 0.9198 0.8693 29.05
Bior2.4 47.2538 49.2861 0.8567 0.9310 0.9310 0.9206 0.8733 29.39
Bior2.6 47.6562 48.8268 0.8575 0.9331 0.9331 0.9231 0.8702 29.66
Bior2.8 47.3795 48.5517 0.8529 0.9328 0.9328 0.9225 0.8718 29.85
Bior3.1 46.4341 46.1780 0.8455 0.9343 0.9343 0.9239 0.8639 38.58
Bior3.3 48.1569 49.5595 0.8562 0.9331 0.9331 0.9230 0.9178 27.33
Bior3.5 47.8803 51.0062 0.8463 0.9324 0.9324 0.9223 0.8695 27.33
Bior3.7 47.0345 48.5183 0.8398 0.9317 0.9317 0.9213 0.8605 27.46
Bior3.9 47.9802 51.7129 0.8307 0.9341 0.9341 0.9239 0.8529 27.61
Bior4.4 48.0226 50.5716 0.8551 0.9327 0.9327 0.9225 0.8392 29.74
Bior5.5 47.3967 49.4120 0.8467 0.9311 0.9311 0.9198 0.8686 30.44
Figure 16: Wavelet versus
Figure 17: Wavelet
4.5 Reverse Biorthogonal Fami 16, it appears that the wavelet R
dB and Compression ratio(CR) 0.9343, Q (Skewness) value 0.93
3.1.However, when comparing
Reverse Biorthogonal 1.3 in this
0 0.1 0.2 0.3 0.4 0.5 0.6 0.7 0.8 0.9 1 B io r1 .1 B io r1 .3 B io r1 .5 B io r2 .2 B io r2 .4 0 10 20 30 40 50 60 B io r1 .1 B io r1 .3 B io r1 .5 B io r2 .2
s proposed Q and other IQA methods (Biorthogonal f
let versus PSNR, VSNR and Compression ratio(CR).
mily with SPIHT-The results were shown in Table 5
Reverse Biorthogonal 1.3 has the highest PSNR valu ) 39.93 % and proposed image quality index ,Q (Ku .9343& Q (Abs-Skewness) value 0.9239 for Coiflet 2 B
g the proposed index and other IQA aspects, the top is family. B io r2 .4 B io r2 .6 B io r2 .8 B io r3 .1 B io r3 .3 B io r3 .5 B io r3 .7 B io r3 .9 B io r4 .4 B io r5 .5 B io r6 .8 SSIM Q(Kurtosis) Q(Skewness) Q(Abs-Skewne UIQI B io r2 .2 B io r2 .4 B io r2 .6 B io r2 .8 B io r3 .1 B io r3 .3 B io r3 .5 B io r3 .7 B io r3 .9 B io r4 .4 B io r5 .5 B io r6 .8 PSNR(dB VSNR CR(%) l family).
and Fig.15 & alue as 48.0356 Kurtosis) value
2 Biorthogonal
p results are of
ness)
Table 5 Wavelet Family: Reverse Biorthogonal with SPIHT
Wavelet Family
PSNR(dB) VSNR SSIM Q(Kurtosis) Q(Skewness)
Q(Abs-Skewness)
UIQI CR(%)
rbio1.1 47.9890 51.6388 0.8603 0.9320 0.9320 0.9222 0.8691 40.17
rbio1.3 48.0356 51.2309 0.8544 0.9326 0.9326 0.9224 0.8946 31.07
rbio1.5 47.9093 50.8185 0.8530 0.9329 0.9329 0.9225 0.8673 39.93
rbio2.2 47.2276 45.6882 0.8536 0.9296 0.9296 0.9194 0.8673 40.36
rbio2.4 47.4499 46.5788 0.8515 0.9312 0.9312 0.9208 0.8624 35.06
rbio2.6 47.6458 46.5177 0.8508 0.9319 0.9319 0.9216 0.8784 33.53
rbio2.8 47.5385 46.4243 0.8526 0.9319 0.9319 0.9216 0.8661 32.96
rbio3.1 41.0837 33.1195 0.7688 0.9214 0.9215 0.9103 0.8672 57.89
rbio3.3 44.1834 43.3229 0.8137 0.9229 0.9229 0.9120 0.8439 42.84
rbio3.5 45.7957 48.5076 0.8324 0.9290 0.9290 0.9181 0.8350 38.77
rbio3.7 45.9650 47.7605 0.8315 0.9291 0.9291 0.9178 0.8547 37.14
rbio3.9 46.0123 49.1438 0.8284 0.9273 0.9273 0.9164 0.8558 36.53
rbio4.4 47.6831 48.8808 0.8554 0.9327 0.9327 0.9227 0.8445 31.87
rbio5.5 47.3042 48.6219 0.8562 0.9321 0.9321 0.9221 0.8696 31.87
rbio6.8 47.2914 44.7912 0.8507 0.9317 0.9317 0.9213 0.8700 31.15
Figure 15: Wavelet versus proposed Q and other IQA methods (Coiflet family).
To show the performance for the better selection of wavelet with SPIHT, we made a comparison in terms of highest values of image quality by proposed image quality indexes and other IQA methods represented in Fig.17. We have seen our compression technique found good result compressed image quality and also achieve higher compression ratio for MR images. We are deeply investigated into the Table 1-5 and Figures 7-16, the lifting based wavelet transforms produced high PSNR around 97dB and high compression ratio 88% and proposed image quality index ,Q (Kurtosis) value 0.9887, Q (Skewness) value 0.9887 & Q (Abs-Skewness) value 0.9827 which keeps the image quality well. The overall performance of different mother wavelets has shown in this experiment produced highest PSNR around 46.4341dB and compression ratio 38.58 % produced by Biorthogonal 3.1. We have seen lifting based CDF 9/7 coupled with SPIHT is a better choice for wavelet image compression.CDF9/7 has the highest PSNR, VSNR SSIM value and highest value of proposed image quality index because of the filters was subsampled and thus avoids computing samples that was subsampled immediately .Lifting is only one idea is a whole tool bag of methods to improve the speed of fast wavelet transform. From the above discussion, it is evident the lifting based wavelets outperform the traditional or mother wavelets. This compression technique can save time in medical image transmission and achieving process. So this simple and efficient compression technique an proposed image quality index can very useful in the field of medical image processing and transmission.
5. C
ONCLUSIONSIn this paper, a comparative study of different wavelet families and lifting based CDF 9/7 with SPIHT on the basis of MR images has been done with new image quality index and other IQAs, as well as compression ratio. The simulated results have given the choice of optimal wavelet for image compression. The effects of lifting based CDF 9/7 wavelet transform and traditional mother wavelets, Haar, Daubechies, Symlets, Coiflets, Biorthogonal and Reverse Biorthogonal wavelet, Discrete meyer wavelet families together with SPIHT on BrainWeb: Simulated Brain Database (SBD) . We comprehensively analysed the effects for a wide range of different mother wavelets family and lifting based CDF9/7. We found that lifting based CDF 9/7 wavelet provided better compression performance for the BrainWeb: Simulated Brain Database (SBD). It has produced as high PSNR as around 97dB, as high compression ratio as 88%, and and proposed image quality index ,Q (Kurtosis) value 0.9887, Q (Skewness) value 0.9887 & Q (Abs-Skewness) value 0.9827 which keeps the image quality quite well. The wavelet Biorthogonal 3.1 with SPIHT also provided competitive compression performance with and proposed image quality index ,Q (Kurtosis) value 0.9343, Q (Skewness) value 0.9343& Q (Abs-Skewness) value 0.9239. Thus, we conclude that the “best wavelet” choice of wavelet in image compression depend on the image content and satisfactory results of proposed image quality index ,Q (Kurtosis) , Q (Skewness) & Q (Abs-Skewness) as well as compressed image quality.
REFERENCES
[1] Ingrid Daubechies, W. Sweldens, “Factoring Wavelet Transforms into Lifting Steps,” J. Fourier Anal. Appl., vol. 4, no. 3, pp. 247 – 269, May 1998.
[2] U. Grasemann and R. Miikkulainen, “Effective image compression using evolved wavelets,” in Proceedings of the 2005 conference on Genetic and evolutionary computation, New York, NY, USA, 2005, pp. 1961–1968.
[3] N. Ahuja, S. Lertrattanapanich, and N. K. Bose, “Properties determining choice of mother wavelet,” IEE Proc. - Vis. Image Signal Process., vol. 152, no. 5, p. 659, 2005.
[4] G. F. Fahmy, J. Bhalod, and S. Panchanathan, “A Joint Compression and Indexing Technique in Wavelet Compressed Domain,” in 2012 IEEE International Conference on Multimedia and Expo, Los Alamitos, CA, USA, 2001, vol. 0, p. 64.
[5] G. K. Kharate, A. A. Ghatol, and P. P. Rege, “Selection of Mother Wavelet for Image Compression on Basis of Image,” in International Conference on Signal Processing, Communications and Networking, 2007, pp. 281 –285.
[6] A. Said and W. A. Pearlman, “A new, fast, and efficient image codec based on set partitioning in hierarchical trees,” IEEE Trans. Circuits Syst. Video Technol., vol. 6, no. 3, pp. 243 –250, Jun. 1996. [7] “BrainWeb: Simulated Brain Database.” [Online]. Available:
http://brainweb.bic.mni.mcgill.ca/brainweb/.
[8] “ITU-T Recommendation J.144, ‘Objective perceptual video quality measurement techniques for digital cable television in the presence for a full reference,’ International Telecommunication Union, 2004.”
[9] “VQEG: The Video Quality Expertise Group, http://www.vqeg.org.”
[10] H. R. Sheikh, Z. Wang, L. Cormack, and A. C. Bovik, “LIVE image quality assessment database release 2.” [Online]. Available: http://live.ece.utexas.edu/ research/quality.
[11] C. C. Taylor, Z. Pizlo, J. P. Allebach, and C. A. Bouman, “Image quality assessment with a Gabor pyramid model of the human visual system,” pp. 58–69, Jun. 1997.
[12] Z. Wang, A. C. Bovik, H. R. Sheikh, and E. P. Simoncelli, “Image quality assessment: from error visibility to structural similarity,” IEEE Trans. Image Process., vol. 13, no. 4, pp. 600–612, 2004. [13] Z. Wang, E. P. Simoncelli, and A. C. Bovik, “Multiscale structural similarity for image quality
assessment,” in Conference Record of the Thirty-Seventh Asilomar Conference on Signals, Systems and Computers, 2004, 2003, vol. 2, pp. 1398–1402 Vol.2.
[14] Damon M. Chandler, Sheila S. Hemami, “VSNR: A Wavelet-Based Visual Signal-to-Noise Ratio for Natural Images,” IEEE Trans. IMAGE Process., vol. 16, no. 9,7, pp. 2284–2298, Sep. 200AD. [15] T. Acharya and A. K. Ray, Image processing: principles and applications. Hoboken, N.J.: John Wiley,
[16] E. Kofidisi, N.Kolokotronis, A. Vassilarakou, S. Theodoridis and D. Cavouras, “Wavelet-based medical image compression,” Future Gener. Comput. Syst., vol. 15, no. 2, pp. 223–243, Mar. 1999. [17] M. Beladgham, A. Bessaid, A. Moulay-Lakhdar, M. BenAissa, A. Bassou, “MRI Image Compression
using Biorthogonal CDF Wavelet Based on Lifting Scheme and SPIHT coding,” J. Sci. Res., no. 2, pp. 225–232, 2010.
[18] Z. Wang and A. C. Bovik, “A universal image quality index,” IEEE Signal Process. Lett., vol. 9, no. 3, pp. 81 –84, Mar. 2002.
AUTHORS
Sheikh Md. Rabiul Islam received the B.Sc.in Engg. (ECE) from Khulna University,
Khulna, Bangladesh in December 2003, and M.Sc. in Telecommunication Engineering from the University of Trento, Italy, in October 2009 and currently doing an PhD by Research under Faculty of Education Science Technology & Mathematics at University of Canberra, Australia. He joined as a Lecturer in the department of Electronics and Communication Engineering of Khulna University of Engineering & Technology, Khulna, in 2004, where he is joined an Assistant Professor in the same department in the
effect of 2008. He has published 20 Journal and 15 International conferences. His research interests include VLSI, Wireless communications, signal & image processing, and biomedical engineering.
Professor (Dr) Xu Huang has received the B.E. and M.E. degrees and Ph.D. in
Electrical Engineering and Optical Engineering prior to 1989 and the second Ph.D. in Experimental Physics in the University of New South Wales, Australia in 1992. He has earned the Graduate Certificate in Higher Education in 2004 at the University of Canberra, Australia. He has been working on the areas of the telecommunications, cognitive radio, networking engineering, wireless communications, optical communications, and digital signal processing more than 30 years. Currently he is the Professor at the Faculty of Education Science Technology & Mathematics. He has been a
senior member of IEEE in Electronics and in Computer Society since 1989 and a Fellow of Institution of Engineering Australian (FIEAust), Chartered Professional Engineering (CPEng), a Member of Australian Institute of Physics. He is a member of the Executive Committee of the Australian and New Zealand Association for Engineering Education, a member of Committee of the Institution of Engineering Australia at Canberra Branch. Professor Huang is Committee Panel Member for various IEEE International Conferences such as IEEE IC3PP, IEEE NSS, etc. and he has published about two hundred papers in high level of the IEEE and other Journals and international conference; he has been awarded 9 patents in Australia.
Professor (Dr) Kim Le has received the B.E. Electrical Engineering School, National
Institute of Technology, Saigon, Vietnam, 1973 and M.E. Electrical & Computer Engineering Dept., University of Newcastle, NSW, 1986 and Ph.D. in Computer Engineering 1991 in the University of Sydney, Australia in 1992. He has been working on the areas of the telecommunications, cognitive radio, wireless communications, and digital signal & image processing, VLSI more than 30 years. Currently he is assistant professor at the Faculty of Education Science Technology & Mathematics, University of Canberra,
![Figure 3: The lifting-based WT [17].](https://thumb-eu.123doks.com/thumbv2/123dok_br/17099657.237351/5.918.349.574.614.751/figure-the-lifting-based-wt.webp)