A Morphological Hessian Based Approach for
Retinal Blood Vessels Segmentation and
Denoising Using Region Based Otsu
Thresholding
Khan BahadarKhan1¤*, Amir A Khaliq1, Muhammad Shahid2
1Department of Electronic Engineering, International Islamic University, Islamabad, Pakistan,2Department of Computer Engineering, CUST, Islamabad, Pakistan
¤ Current address: Faculty of Engineering and Technology, Department of Electronic Engineering, Sector H-10, International Islamic University, Islamabad, Pakistan
Abstract
Diabetic Retinopathy (DR) harm retinal blood vessels in the eye causing visual deficiency. The appearance and structure of blood vessels in retinal images play an essential part in the diagnoses of an eye sicknesses. We proposed a less computational unsupervised auto-mated technique with promising results for detection of retinal vasculature by using morpho-logical hessian based approach and region based Otsu thresholding. Contrast Limited Adaptive Histogram Equalization (CLAHE) and morphological filters have been used for enhancement and to remove low frequency noise or geometrical objects, respectively. The hessian matrix and eigenvalues approach used has been in a modified form at two different scales to extract wide and thin vessel enhanced images separately. Otsu thresholding has been further applied in a novel way to classify vessel and non-vessel pixels from both enhanced images. Finally, postprocessing steps has been used to eliminate the unwanted region/segment, non-vessel pixels, disease abnormalities and noise, to obtain a final seg-mented image. The proposed technique has been analyzed on the openly accessible DRIVE (Digital Retinal Images for Vessel Extraction) and STARE (STructured Analysis of the REtina) databases along with the ground truth data that has been precisely marked by the experts.
Introduction
DR is a severe disease and is one of the main source of visual impairment among adults aged 20–74 years in the United States [1]. The most common indications of DR include dilated reti-nal veins, hemorrhages, hard exudates and cotton wool spots [2]. Variation in features of vas-culature of retinal images lead to serious diseases such as stroke, diabetes and cardiovascular diseases [3]. Consequently, an investigation of retinal vessel features can help with recognizing
a11111
OPEN ACCESS
Citation:BahadarKhan K, A Khaliq A, Shahid M (2016) A Morphological Hessian Based Approach for Retinal Blood Vessels Segmentation and Denoising Using Region Based Otsu Thresholding. PLoS ONE 11(7): e0158996. doi:10.1371/journal.pone.0158996
Editor:Yuanquan Wang, Beijing University of Technology, CHINA
Received:December 26, 2015
Accepted:June 24, 2016
Published:July 21, 2016
Copyright:© 2016 BahadarKhan et al. This is an open access article distributed under the terms of the Creative Commons Attribution License, which permits unrestricted use, distribution, and reproduction in any medium, provided the original author and source are credited.
Data Availability Statement:All relevant data are within the paper and its Supporting Information files.
Funding:The authors have no support or funding to report.
these progressions and permit the patient to make an action while the sickness is still in its ini-tial stage. Automated investigation of the retinal blood vessels turned into a dynamic research because of its diagnostic and prognostic in the field of medical imaging.
Segmentation and review of retinal vasculature characteristics for example, tortuosity, nor-mal or abnornor-mal branching, shading and diameter as well as the optic disk morphology per-mits eye care experts and ophthalmologists to perform mass vision screening exams for early discovery of retinal ailments and treatment assessment. This could forestall and decrease vision debilitations, age-related diseases, and numerous cardiovascular ailments, and in addition diminish the expense of the screening [4,5]. In manual assessment, segmentation and estima-tion accuracy also fluctuates relying upon nature of the retinal images, graders ability and expe-rience. Moreover, manual segmentation and estimation procedures can take up to an hour for assessment of just a single eye. In this way, a completely automated framework extracting the vessel structures in retinal images could surely diminish the workload of eye clinicians.
This work consists of automated segmentation of vasculature of retinal images which can be used in diagnostic of various eye diseases. Different retinal vessel segmentation methodologies have been published and assessed in literature but they still need some improvement. Existing systems should be enhanced in terms of at least one of the following drawbacks. Firstly, lack of adaptive capabilities under varying image conditions may cause poor quality of segmentation such as under and over segmentations. Secondly, complex preprocessing and postprocessing operations used in different methods for extracting retinal images vessels caused high compu-tational cost. Thirdly, human participation is required to choose area of interest, which demon-strates that the systems are not totally automatic. In conclusion, segmentation and assessment procedures themselves need a large computational endeavors.
Related Works
In literature, many retinal segmentation methods are designed from the line detection meth-ods, as vessel segmentation depends on line detection [6]. Generally, vessel segmentation meth-ods consists of two steps: vessels enhancement and vessels classification. Some techniques may escape first step and use directly the second step. In the first step vessels are enhanced, noise and geometrical objects are removed. Chaudhuri et al. [7], first proposed matched filter to enhance and segment retinal vessels. Further improvements and similar techniques were pro-posed later on by various authors using threshold probing technique [8], double-sided thresh-olding [9] and the first order derivative of Gaussian image [10]. Matched filters application for segmentation, produced high quality results at the cost of long computational time. The quality of segmentation results mainly depend on the quality and size of the used vessel profile data-base. In [11], retinal blood vessels have been enhanced by using Gabor filter. This methodology has a great performance on normal retinal images. Lam and Yan [12], used laplacian operator and gradient vector fields to extract vessels. Staal et al. [13], proposed a framework depends on extraction of image ridges, which correspond roughly with vessel centerlines. Zana and Klein [14] and Mendonça and Campilho [15], used morphological filters to enhance vessels. Their proposed method showed better results than most of the existing techniques on the pathologi-cal retina.Martínez-Pérez et al. [16,17], were also based on hessian matrix to extract multiscale feature for detection of vessels. In [18], vessel enhancement filter was designed on the base of hessian matrix.
with adaptive local thresholding to classify vessel and non-vessel pixels. Maritiner-perez et al. [17], extract information about vessel topology by using 1st and 2nd spatial derivatives of the intensity image. Zhou et al. [22], method is based on prior knowledge about retinal vessel char-acteristics coupled with matched filtering technique to detect the vessel structure. Al-Diri [23], utilized two pairs of contours to detect vessel boundary and sustain width of vessels. Fraz et al. [24], used first-order derivative of Gaussian filter to extract centerlines of retinal vessels before mathematical morphology to quantify vessels in retina. Generally, all vessel extraction methods can be classified into supervised segmentation [11–13,25–31] and unsupervised segmentation [7,9,14–16,23–24,32–41] with the reference to the overall system design and structure.
Rest of the paper is arranged as follows: Section II, illustrate our suggested segmentation technique in detail. The preprocessing steps consist of CLAHE and morphological filters used for vessel enhancement and illumination corrections are discussed in detail. Further, hessian matrix and eigenvalues transformation are used in a modified form to compute the second derivative of the image at two different scales, for wide and thin vessels enhancement, sepa-rately. Otsu thresholding technique has been applied to classify vessel and non-vessel pixels. Finally, pixel count based thresholding has been applied to eliminate background noise, unwanted segments and erroneously detected vessel pixels. In section III, performance evalua-tion criteria is defined. Secevalua-tion IV, discussed the experimental Results. Finally, the proposed method is concluded in section V.
Proposed Technique
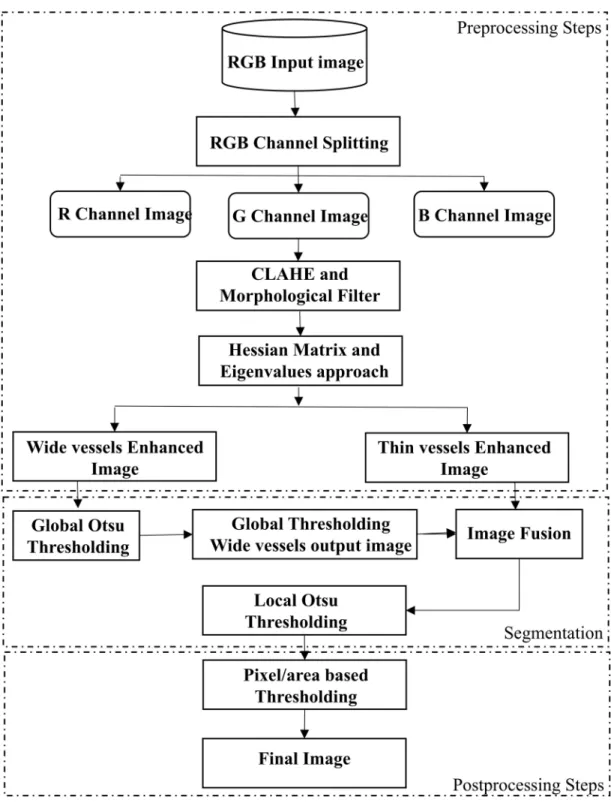
Fig 1shows block diagram of our proposed segmentation framework. We extract green chan-nel from input RGB retinal image for further processing.
The green band of input image is further analyzed by using following noteworthy steps:
• CLAHE and morphological filters have been used for vessel contrast enhancement and low frequency noise/geometrical objects removal respectively.
• Hessian matrix and eigenvalues transformation has been applied in a modified form at two different scales to extract wide and thin vessels enhanced images, separately.
• Global and local Otsu thresholding has been utilized in a modified way to classify vessel and non-vessel pixels from wide and thin vessel enhanced images, respectively.
• Postprocessing steps have been used for eliminating background noise, undesired segments and erroneously detected vessel pixels. We labelled vessel pixels‘1’and non-vessel pixels‘0’
to obtain a final binary image.
Contrast Limited Adaptive Histogram Equalization (CLAHE)
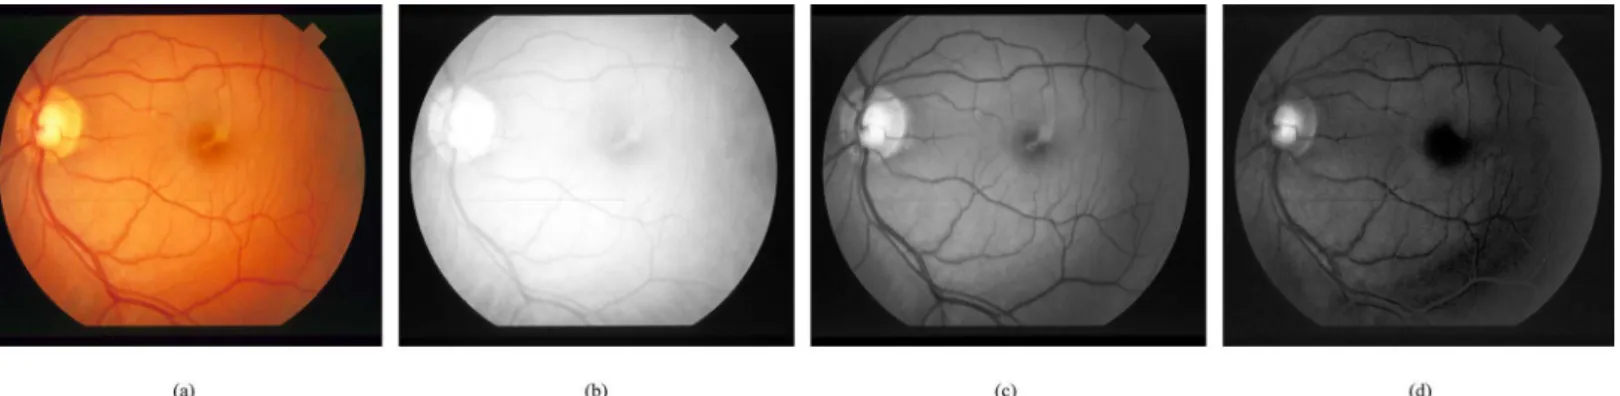
We have used green channel of retinal image for analysis and segmentation of vessel structure.
Fig 2shows that in green channel, blood vessels seems more differentiated than the background as compared to red or blue channel. The DRIVE and the STARE datasets images are used for analysis and experiments of the proposed method.
Morphological filters
Vessel enhancement based on morphological filters has already been published in literature [14]. Vessel structure appears in more prominent contrast than background intensity varia-tions. However, a more local investigation of vessel intensities can indicate noteworthy changes
Fig 1. Flow chart of the proposed segmentation framework.
that can adversely influence the whole vessel extraction process. To overcome such changes, we have proposed a morphological filter known as modified top-hat transform which has been applied on normalized green channel image. The thickest vessel width is set as a reference, which normally varies between 1 to 8 pixels covering all diameter ranges of vessels width for both image databases utilized as a part of our proposed scheme. Vessel diameter scale can be adapted according to image resolution variations.
We have utilized morphological top-hat transformation to find difference between the input and the opened image. Closed image followed by the opened image to obtain inverse image. Implementation of top-hat transformation has an issue of noise sensitivity, which cause that pixel values in an opened image are always less than or equal to the input ones; in such conditions, the subtracted image holds little intensity variations that can be found in the data. To solve this problem we adapted from [15], modified top-hat transform by introducing two new steps: a closing operator followed by the opening, without using any minimum operator and comparison.
The opening top-hat operator of an imageIwith structuring elementSois given by
Topen¼ISo ð1Þ
The closing top-hat operator of an imageIwith structuring elementScis given by
Tclose¼ISc ð2Þ
Modified top-hat transform adapted from [15] is given by
TopHat¼I ðIScÞ So ð3Þ
Eq 3shows our modified top-hat transform in whichIis the input green channel image whileScandSostand for the structuring elements for closing () and opening () operators,
respectively. In our case, we select disk type structuring elements for both opening and closing operator having radius eight pixels.
Hessian Matrix and Eigenvalues based approach
We have applied hessian matrix and eigenvalues transformation in a new way after morpholog-ical filter to obtain enhanced images of wide and thin vessel. We have computed the second derivative of the image at two different scales for wide and thin vessel enhancement, separately. This isolation of wide and thin vessels has been achieved by using hessian matrix and eigenval-ues based approach. The vessels having variable width are highlighted and based on the
analysis of second order derivative at two different scales. The eigenvalues of hessian matrix and the difference between them have been used for further contrast enhancement and sup-pression of non-vasculature structure.
Hessian matrix of the directional imageIiin the new coordinatesCx0y0is determined as
[43]
H0 ¼ h11h12
h21h22
" #
¼ @2
Ii
@x02
@2 Ii
@x0@y0
@2 Ii
@y0@x0
@2 Ii
@y02
2 6 6 6 4 3 7 7 7 5
ð4Þ
where
@2 Ii
@x02¼
@2 Ii
@x2cos 2
yiþ @
2 Ii
@x@ysinð2yiÞ þ
@2 Ii
@y2sin 2
yi ð5Þ
@2 Ii
@y02 ¼
@2 Ii
@x2sin 2
yi @
2 Ii
@x@ysinð2yiÞ þ
@2 Ii
@y2cos 2
yi ð6Þ
@2 Ii
@x0@y0¼
@2 Ii
@y0@x0¼
1
2 @2
Ii
@x2sinð2yiÞ þ
@2 Ii
@x@ycosð2yiÞ þ
1
2 @2
Ii
@y2sinð2yiÞ ð7Þ
We have applied eigenvalues transformation on hessian matrix to obtain eigenvaluesλ1and λ
2, whileσis used to define scale of vessel enhancement. The filter response will be optimum, if
the scaleσmatches the size of the vessel. In our case,σranges from 1 to 2.5 for vessels
enhance-ment.
h0 11¼s
2
h11 ð8Þ
h012¼h 0
21¼s 2
h12 ð9Þ
h0 22¼s
2
h22 ð10Þ
½l1l2 ¼eign2imgðh 0
11;h 0
12;h 0
22Þ ð11Þ
Our method reduced the complexity and computation by taking only difference ofλ
1andλ2
opposed to other existing methods using Frangi’sfilter [18]. Difference images are obtained as
Iimage=λ2−λ1at two different scales having values 1 and 2.5 forσ.
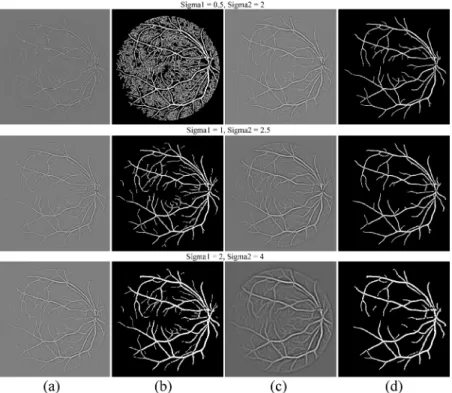
We have tested the setting of parameterσon different scalesas shown inFig 3, which clearly
indicates that setting of smaller scale increased False Positive Rate (FPR) considering back-ground as a vessel pixels. In case of setting larger scale forσ, which is not able to detect thin
ves-sel pixels decreasing the sensitivity of the proposed method.
Otsu Method for Vessel Segmentation
this way both thin and thick vessels become more prominent. We obtained a single enhanced image on which further local thresholding has been applied. In local thresholding, we used ves-sel based thresholding which depends upon vesves-sel locality to define a new threshold. We added some offset in the global threshold to suppress the noise more effectively for vessels in the neighborhood of wide vessels. For other regions away from wide vessels, we set lower threshold than the global by subtracting some offset from it to extract the small or thin vessels from the background having low intensity. Further, postprocessing steps have been applied to obtain final segmented image.
We used Otsu’s approach [44], to divide pixels of an image into two segmentsS0andS1
(e.g., objects and background) at intensity levelt, i.e,S0= {0,1,2,. . .. . ..,t} andS1= {t+ 1, t+ 2,. . .. . ..,L−1}. As mentioned in [44], letσ2W,σ2Bandσ2Tbe the within-class variance,
between-class variance, and the total variance, respectively. We have minimizedσ2Wto obtain
optimal threshold. Following is the relation between different class variances.
a¼ s
2 B
s2 W
; b¼s
2 B
s2 T
; g¼s
2 T
s2 W
ð12Þ
The optimal thresholdtin our case is obtained by maximizingαand can be defined as
t¼ArgMax
|fflfflfflffl{zfflfflfflffl}
tG
a ð13Þ
Fig 3. Comparison of the setting of parameterσon different scales.(a) Thin vessel enhanced image. (b)
where
s2
W¼o0s
2 0þo1s
2
1 ð14Þ
s2
B¼o0ðm0 mTÞ
2
þo1ðm1 mTÞ 2
ð15Þ
s2
T ¼
PL
i¼1ði mTÞ 2
Pi ð16Þ
o0¼
Pt
i¼0Pi; o1 ¼1 o0; m1¼
mT mt
1 m
0
; m0 ¼
mt o0
ð17Þ
mt¼Pti¼0i Pi; mT ¼
PL 1
i¼0iPi; G¼ f0;1;2;. . . .:;L 1g ð18Þ
whereniis the total number of pixels with grey-level,iandnis the total number of pixels in the
given image defined asn¼PLi¼01ni. Probability of grey-levelPiis defined asPi¼ ni n.
Postprocessing Steps
We have used pixel/area based thresholding to eliminate unconnected non-vessel pixels. The segmentation results usually consist of some small isolated regions caused by noise, and these regions are sometimes wrongly detected as vessels. Based on the connectivity of the retinal ves-sels, we removed less than or equal to 30 unconnected pixels considered as a non-vessel or a part of the background noise.
Performance Evaluation Criteria
We have processed retinal images from two publically available datasets: DRIVE [45] and STARE [8] for the performance evaluation of the proposed segmentation framework. These datasets consists of manual segmented retinal images by experts considered as a gold standard for comparison.
Accuracy (Acc), Sensitivity (Sn), Specificity (Sp), and the area under a Receiver Operating Characteristic (ROC) curve, also known as Area Under the Curve (AUC) are four commonly used parameters to compare the performance of the competing techniques [38]. Accuracy shows the overall segmentation performance. Sensitivity indicates effectiveness in detection of pixels with positive values: specificity measure the detection of pixels with negative values. These metrics are defined as follows:
Accuracy Accð Þ ¼ TPþTN
TPþFPþTNþFN ð19Þ
Sensitivity Snð Þ ¼ TP
TPþFN ð20Þ
Specif icity Spð Þ ¼ TN
TNþFP ð21Þ
Area Under Curve AUCð Þ ¼SnþSp
2 ð22Þ
Experimental Results
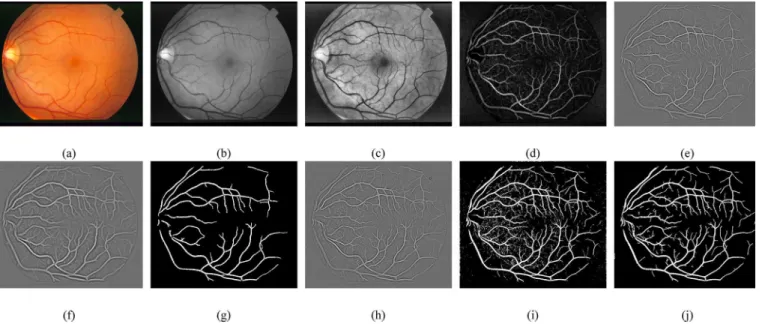
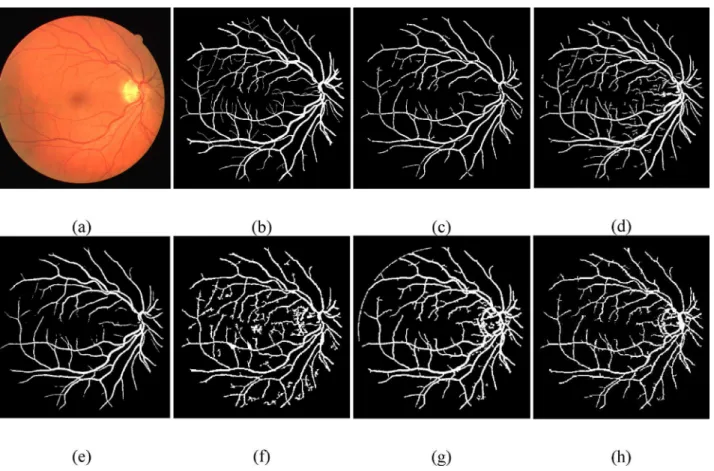
In this section, we have analyzed the performance of retinal vessel segmentation methods on the DRIVE [45] and the STARE [8] databases. The manually segmented images provided in these databases are used for better evaluation of the proposed framework. The DRIVE and the STARE datasets consist of 40 and 20 retinal images, respectively classified into two sets: the training set and the test set. For performance evaluation, the proposed framework has beenap-plied on 20 test images of the DRIVE and the STARE datasets. All the experiments of our pro-posed framework were executed utilizing MATLAB 2013a on a DELL Vostro 1540 (2.53 GHz Intel Core i3 Processor, 4GB RAM). Visual inspection of retinal blood vessel segmentation with major processing stages of our proposed framework using the DRIVE and the STARE datasets are depicted in Figs4and5, respectively.
We have compared our visual results with Bankhead et al. [30] (S1 Link), Azzopardi et al. [35] (S2 Link), Dai et al. [40] (S3 Link), and Vlachos and Dermatas [41] (S4 Link) by running their source codes on the DRIVE and the STARE datasets shown in Figs6and7, respectively. Images results of Martinez-Perez et al. [17] (S5 Link) were obtained from their website. To find whether a vessel is detected correctly or not, the final binary image has been compared to the corresponding manually segmented image.
Average accuracy of the proposed method
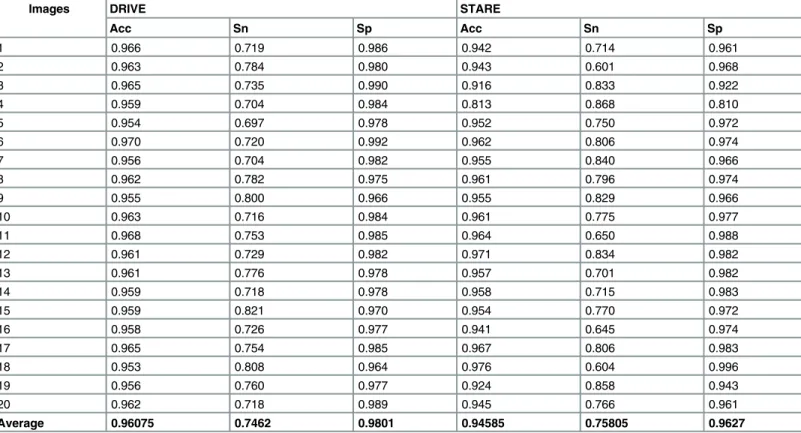
First, we have calculated the average accuracy of 20 test images of the DRIVE dataset and 20 random images of the STARE dataset. The average accuracy indicates how to extract a binary image that matches the vessel images to a high degree. The accuracy is estimated by the ratio of the sum of the number of correctly classified foreground and background pixels, divided by the
Fig 4. Proposed method main processing steps for retinal blood vessel segmentation.(a) RGB image fromDRIVEdatabase. (b) Green Channel. (c) CLAHE. (d) Morphological filters. (e) Thin vessel enhanced image. (f) Wide vessel enhanced image. (g) Otsu global thresholding output image. (h) Fused image of thin enhanced image and Otsu global thresholding output image. (i) Otsu local thresholding to enhance thin vessels (j) Postprocessed final binary image.
total number of pixels in the image. According to the results shown inTable 1, the average accuracy for the DRIVE dataset is 0.96075 and for the STARE dataset is 0.94585.
Proposed Otsu algorithm comparison with different techniques
We have compared the proposed Otsu approach [44] with current thresholding algorithms, Technique of Iterative Local Thresholding (TILT) [46], K-means [47], Moment-preserving thresholding [48], Niblack local thresholding [49] and fuzzy ISODATA algorithms [50]. The pictorial results on the DRIVE dataset have been displayed inFig 8. Their performance in the term of accuracy, sensitivity, specificity and AUC has been tabulated inTable 2.
Comparison with other techniques
In order to compare the efficiency of our proposed technique, we contrasted it with other exist-ing vessel segmentation techniques on two commonly used databases: DRIVE [45] and STARE [8]. We have selected five latest supervised techniques [11–13,27,31] and fourteen unsuper-vised techniques [7,9,14–16,23–24,30,33,35,37–40]. The results are demonstrated in
Table 3which clearly indicates that our proposed framework is more efficient than many other methods.
Proposed framework shows highest results on the DRIVE images for both supervised and unsupervised methods, with Acc = 0.961, Sn = 0.746 and Sp = 0.980. Our proposed technique showed high efficiency in terms of sensitivity and accuracy among the unsupervised techniques on the STARE dataset. The specificity Sp = 0.963 which is also the highest value among the few unsupervised methods, and also behind the unsupervised techniques [9,15,24,19,35]. For supervised methods, accuracy is less 0.006 from [21,27],0.0186 less from [25] and 0.011 behind [17], sensitivity is highest among all while specificity behind 0.018 than supervised methods [21,27] and 0.013 less than [11].
Fig 5. Proposed method main processing steps for retinal blood vessel segmentation.(a) RGB image fromSTAREdatabase. (b) Green Channel. (c) CLAHE. (d) Morphological filters. (e) Thin vessel enhanced image. (f) Wide vessel enhanced image. (g) Otsu global thresholding output image. (h) Fused image of thin enhanced image and Otsu global thresholding output image. (i) Otsu local thresholding to enhance thin vessels (j) Postprocessed final binary image.
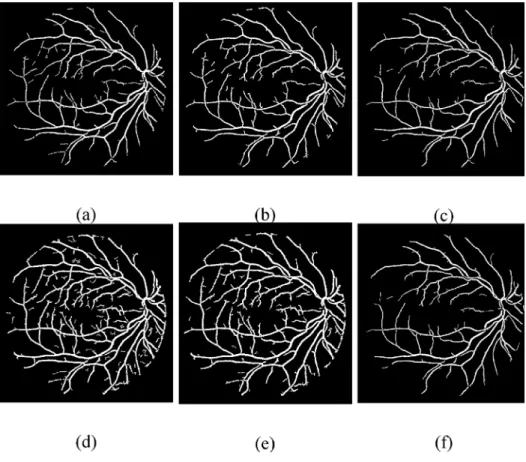
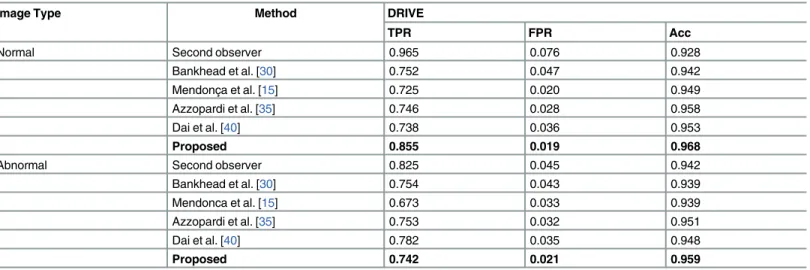
One important factor of our proposed framework is to scale down the undesired segment, non-vessel pixels, erroneously detected segments and background noise that will frequently show up in the anomalous retinal images. For such pathological cases, we compared the perfor-mance of the proposed technique with various methods on the normal and abnormal images in the DRIVE and the STARE databases shown inTable 4, which evidently shows that for an abnormal cases, the proposed method achieve much better efficiency than Chaudhuri et al. [7], Mendonça and Campilho [15], Hoover et al. [8] and it records slightly better results than Soares et al. [11]. Figs9and10show visual appearance of an abnormal retinal images of the DRIVE and the STARE databases, respectively.
Another important parameter is ROC curve, also known as AUC, it has the ability to reflect the trade-offs between the sensitivity and specificity. Note that an AUC of 0.50 means that the classification is equivalent to a pure random guess, and an AUC of 1.0 means that the classifier distinguishes class examples perfectly. The most frequently used performance measure extracted from the ROC curve is the value of the AUC which is 1 for an optimal system. The AUC achieved by the proposed method has been contrasted with existing segmentation tech-niques on the DRIVE and the STARE databases shown inTable 5. The proposed framework AUC results are highest than others on the DRIVE dataset except Mapayi et al. [37] and Ricci and Perfetti [25] which is 0.001 and 0.1003 little better than ours, respectively. On the STARE dataset, AUC of the proposed method is the highest among all, only [25], [38], [37] and [35] methods are 0.107, 0.02, 0.004 and 0.001 better than ours, respectively.Table 6, represents computation time comparison of various retinal vessel segmentation techniques. Computation
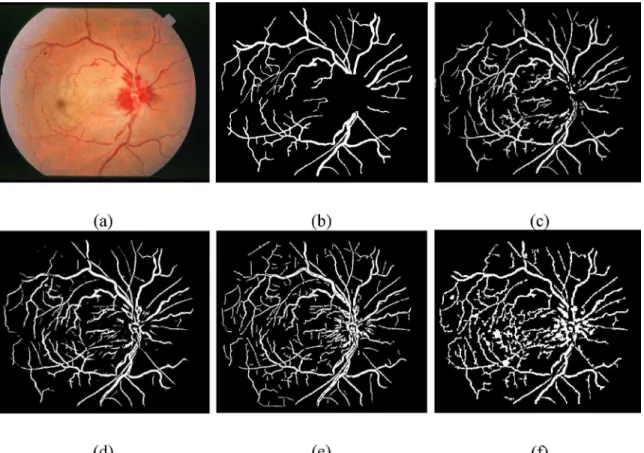
Fig 6. Visual inspection of different vessel segmentation methods using DRIVE database.(a) RGB input image. (b) Manual segmented image. (c) Proposed method final image. (d) Dai et al. [40]. (e) Azzopardi et al. [35]. (f) Bankhead et al. [30]. (g)Vlachos and Dermatas [41]. (h) Martinez-Perez et al. [17].
Fig 7. Visual inspection of different vessel segmentation methods using STARE database.(a) RGB input image. (b) Manual segmented image. (c) Proposed method final image. (d) Dai et al. [40]. (e) Azzopardi et al. [35]. (f) Bankhead et al. [30]. (g)Vlachos and Dermatas [41]. (h) Martinez-Perez et al. [17].
doi:10.1371/journal.pone.0158996.g007
Table 1. Accuracy (Acc), Sensitivity (Sn) and Specificity (Sp) results of proposed method for 20 retinal images of the DRIVE and the STARE datasets.
Images DRIVE STARE
Acc Sn Sp Acc Sn Sp
1 0.966 0.719 0.986 0.942 0.714 0.961
2 0.963 0.784 0.980 0.943 0.601 0.968
3 0.965 0.735 0.990 0.916 0.833 0.922
4 0.959 0.704 0.984 0.813 0.868 0.810
5 0.954 0.697 0.978 0.952 0.750 0.972
6 0.970 0.720 0.992 0.962 0.806 0.974
7 0.956 0.704 0.982 0.955 0.840 0.966
8 0.962 0.782 0.975 0.961 0.796 0.974
9 0.955 0.800 0.966 0.955 0.829 0.966
10 0.963 0.716 0.984 0.961 0.775 0.977
11 0.968 0.753 0.985 0.964 0.650 0.988
12 0.961 0.729 0.982 0.971 0.834 0.982
13 0.961 0.776 0.978 0.957 0.701 0.982
14 0.959 0.718 0.978 0.958 0.715 0.983
15 0.959 0.821 0.970 0.954 0.770 0.972
16 0.958 0.726 0.977 0.941 0.645 0.974
17 0.965 0.754 0.985 0.967 0.806 0.983
18 0.953 0.808 0.964 0.976 0.604 0.996
19 0.956 0.760 0.977 0.924 0.858 0.943
20 0.962 0.718 0.989 0.945 0.766 0.961
time of Bankhead et al. [30], Azzopardi et al. [35], Dai et al. [40], and Vlachos and Dermatas [41] have been calculated by running their source codes on the PC (HP Intel Core i3 CPU, 2.53 GHz, 4 GB RAM), while computation time of Zhao et al. [38], Nguyen et al. [34], Mapayi et al. [37] and Asad et al. [39] have been collected from their published papers. The proposed frame-work is computationally very fast and efficient than other published methods.
Conclusion
The automatic segmentation of blood vessels in retinal image is an important step in diagnos-ing causes of visual impairment. In our proposed framework, CLAHE and morphological filter has been used for vessel enhancement and low frequency noise/object removal along with
Fig 8. Visual results of different thresholding techniques. (a) Proposed Otsu method.(b) TILT. (c) K-means. (d) Moment-preserving thresholding. (e) Niblack local thresholding. (f) Fuzzy ISODATA algorithms. doi:10.1371/journal.pone.0158996.g008
Table 2. Performance evaluation of different thresholding techniques with proposed Otsu method.
Method DRIVE
AUC Acc Sn Sp
Proposed Otsu [44] 0.882 0.963 0.784 0.980
TILT [46] 0.849 0.957 0.714 0.985
K-means [47] 0.812 0.956 0.631 0.993
Moment-preserving thresholding [48] 0.891 0.943 0.826 0.956
Niblack local thresholding [49] 0.888 0.946 0.815 0.961
Fuzzy ISODATA algorithms [50] 0.812 0.956 0.630 0.993
hessian matrix and eigenvalues transformation to classify retinal image into wide and thin ves-sels enhanced images. Otsu thresholding has been utilized to extract vessel attributes and region properties based thresholding has been used set optimal threshold value to segregate vessel and non-vessel pixels. Proposed method has been applied to different databases like
Table 3. Performance evaluation of different retinal vessel segmentation techniques.
Method Type Method DRIVE STARE
Acc Sn Sp Acc Sn Sp
Unsupervised Second observer 0.947 0.776 0.972 0.935 0.895 0.939
Mendonça et al. [15] 0.945 0.734 0.976 0.944 0.699 0.973
Martinez-Perez et al. [17] 0.934 0.725 0.965 0.941 0.751 0.955
Palomera-Perez etal. [33] 0.922 0.660 0.961 0.924 0.779 0.940
Zhang et al. [9] 0.938 0.712 0.973 0.948 0.717 0.975
Fraz et al. [24] 0.943 0.715 0.976 0.944 0.731 0.968
Bankhead etal. [30] 0.937 0.703 0.971 0.932 0.758 0.950
Chaudhuri et al. [7] 0.877 0.336 — — — —
Zana and Klein [14] 0.938 0.697 — — — —
Al-Diri et al. [23] — 0.728 0.955 — 0.752 0.968
Azzopardi et al. [35] 0.944 0.766 0.970 0.949 0.772 0.970
Mapayi et al. [37] 0.946 0.763 0.963 0.951 0.763 0.966
Zhao et al. [38] 0.953 0.744 0.978 0.951 0.786 0.975
Asad et al. [39] — — — 0.934 0.748 0.954
Dai et al. [40] 0.942 0.736 0.972 0.936 0.777 0.955
Proposed 0.961 0.746 0.980 0.946 0.758 0.963
Supervised Niemeijer et al. [31] 0.942 0.714 — — — —
Staal et al. [13] 0.944 0.719 0.977 0.952 0.697 0.981
Ricci and Perfetti [25] 0.9595 — — 0.9646 — —
Soares et al. [11] 0.946 0.723 0.976 0.946 0.723 0.976
Lam et al. [12] 0.947 — — 0.957 — —
Marin etal. [27] 0.945 0.706 0.980 0.952 0.694 0.981
“—”Shows that this content was not available. doi:10.1371/journal.pone.0158996.t003
Table 4. Segmentation results comparison for normal versus abnormal cases of our proposed technique with different segmentation techniques.
Image Type Method DRIVE
TPR FPR Acc
Normal Second observer 0.965 0.076 0.928
Bankhead et al. [30] 0.752 0.047 0.942
Mendonça et al. [15] 0.725 0.020 0.949
Azzopardi et al. [35] 0.746 0.028 0.958
Dai et al. [40] 0.738 0.036 0.953
Proposed 0.855 0.019 0.968
Abnormal Second observer 0.825 0.045 0.942
Bankhead et al. [30] 0.754 0.043 0.939
Mendonca et al. [15] 0.673 0.033 0.939
Azzopardi et al. [35] 0.753 0.032 0.951
Dai et al. [40] 0.782 0.035 0.948
Proposed 0.742 0.021 0.959
Fig 9. Pictorial results of different retinal blood vessel segmentation techniques on pathological image of DRIVE dataset.(a) RGB input image. (b) Manual segmented image. (c) Proposed method. (d) Azzopardi et al. [35]. (e) Dai et al. [40]. (f) Bankhead et al. [30].
doi:10.1371/journal.pone.0158996.g009
DRIVE and STARE and assessed based on performance measures such as sensitivity, specificity and accuracy. Further, our proposed method has been contrasted with different existing tech-niques to evaluate its efficiency and reliability. The proposed framework performs efficiently against noise and extract thin vessels. The proposed method is robust and computationally efficient.
Supporting Information
S1 File. Data used to test the algorithm.
(ZIP)
S1 Link. MATLAB implementation of Bankhead et al. [30] available at:http://journals.
plos.org/plosone/article?id=10.1371/journal.pone.0032435.
(ZIP)
S2 Link. MATLAB source code of Azzopardi et al. [35] available at:http://www.mathworks.
com/matlabcentral/fileexchange/49172-trainable-cosfire-filters-for-vessel-delineation-with-application-to-retinal- images.
(ZIP)
S3 Link. MATLAB implementation of Dai et al. [40] available at:http://journals.plos.org/
plosone/article?id=10.1371/journal.pone.0127748.
(ZIP)
Table 5. Performance comparison of AUC with existing techniques.
Method AUC (DRIVE) AUC (STARE)
Second observer 0.874 0.917
Azzopardi et al. [35] 0.862 0.862
Martinez-Perez et al. [17] 0.845 0.853
Palomera-Perez et al. [33] 0.811 0.860
Bankhead et al. [30] 0.837 0.854
Fraz et al. [24] 0.846 0.850
Ricci and Perfetti [25] 0.963 0.968
Zhao et al. [38] 0.861 0.881
Al-Diri et al. [23] 0.842 0.860
Marin et al [27] 0.843 0.838
Mapayi et al. [37] 0.864 0.865
Proposed 0.863 0.861
doi:10.1371/journal.pone.0158996.t005
Table 6. Computation time comparison of various techniques.
Method Processing Time Computer Specifications Software
Proposed 1.56 Sec HP Intel Core i3 CPU, 2.53 GHz, 4 GB RAM MATLAB
Bankhead et al. [30] 22.45 Sec MATLAB
Azzopardi et al. [35] 11.83 Sec MATLAB
Dai et al. [40] 1 min and 46 Sec MATLAB
Vlachos et al.[41] 9.3 Sec MATLAB
Zhao et al. [38] 4.6 Sec HP Intel Core i3 CPU, 3.1 GHz, 8 GB RAM MATLAB & C++
Mapayi et al. [37] 1.9 to 2.6 Sec Intel Core i5 CPU, 2.30GHz, 4GB RAM. MATLAB
Asad et al. [39] 2 mins and 45 Sec Intel Core i3 CPU, 2.53 GHz, 3 GB RAM MATLAB
S4 Link. MATLAB source code of Vlachos and Dermatas [41] available at:https:// matlabfreecode.wordpress.com/2013/02/27/detection-of-vessels-in-eye-retina-using-line-tracking-algorithm-with-matlab-code.
(RAR)
S5 Link. Images of Martinez-Perez et al. [17] are available at:http://turing.iimas.unam.
mx/~elena/Projects/segmenta/VesselSegment.html.
(RAR)
Acknowledgments
The authors would like to thanks Staal et.al [45] and Hoover et.al [8] for making their database openly available.
Author Contributions
Conceived and designed the experiments: KBK AAK MS. Performed the experiments: KBK MS. Analyzed the data: KBK AAK MS. Contributed reagents/materials/analysis tools: KBK AAK MS. Wrote the paper: KBK AAK.
References
1. Klein R, Klein BE. Vision disorders in diabetes. Diabetes in America. 1995 Jul 1; 1:293–337.
2. Cavallerano J, Aiello LM. Emerging trends in ocular telemedicine: the diabetic retinopathy model. Jour-nal of telemedicine and telecare. 2005 Jun 1; 11(4):163–166. PMID:15969790
3. Lai N, Clinical ophthalmology: A systematic approach, Optometry and Vision Science. 2004; 81(5): 295.
4. Köse C,Şevik U,İkibaşC, Erdöl H. Simple methods for segmentation and measurement of diabetic ret-inopathy lesions in retinal fundus images. Computer methods and programs in biomedicine. 2012 Aug 31; 107(2):274–93. doi:10.1016/j.cmpb.2011.06.007PMID:21757250
5. Yavuz Z,İkibaşC, Köse C. a Simple Analytic Approach for Tracking Retinal Vessel and Measuring Their Diameters, International Conference on Bioinformatics- BIOINFORMATICS-2010, 2010. 6. Gonzalez RC. Digital image processing. Pearson Education. India; 2009.
7. Chaudhuri S, Chatterjee S, Katz N, Nelson M, Goldbaum M. Detection of blood vessels in retinal images using two-dimensional matched filters. IEEE Transactions on medical imaging. 1989; 8 (3):263–9. PMID:18230524
8. Hoover A, Kouznetsova V, Goldbaum M. Locating blood vessels in retinal images by piecewise thresh-old probing of a matched filter response. Medical Imaging, IEEE Transactions on. 2000 Mar; 19 (3):203–10.
9. Zhang L, Li Q, You J, Zhang D. A modified matched filter with double-sided thresholding for screening proliferative diabetic retinopathy. Information Technology in Biomedicine, IEEE Transactions on. 2009 Jul; 13(4):528–34.
10. Zhang B, Zhang L, Zhang L, Karray F. Retinal vessel extraction by matched filter with first-order deriva-tive of Gaussian. Computers in biology and medicine. 2010 Apr 30; 40(4):438–45. doi:10.1016/j. compbiomed.2010.02.008PMID:20202631
11. Soares JV, Leandro JJ, Cesar RM Jr, Jelinek HF, Cree MJ. Retinal vessel segmentation using the 2-D Gabor wavelet and supervised classification. Medical Imaging, IEEE Transactions on. 2006 Sep; 25 (9):1214–22. doi:10.1109/TMI.2006.879967
12. Lam BS, Yan H. A novel vessel segmentation algorithm for pathological retina images based on the divergence of vector fields. Medical Imaging, IEEE Transactions on. 2008 Feb; 27(2):237–246. 13. Staal J, Abramoff M, Niemeijer M, Viergever M, van Ginneken B. Ridge-based vessel segmentation in
color images of the retina. IEEE Trans Med Imag. 2004; 23: 501–509. doi:10.1109/TMI.2004.825627 14. Zana F, Klein JC. Segmentation of vessel-like patterns using mathematical morphology and curvature
evaluation. Image Processing, IEEE Transactions on. 2001 Jul; 10(7):1010–1019.
16. Martínez-Pérez ME, Hughes AD, Stanton AV, Thom SA, Bharath AA, Parker KH. Retinal blood vessel segmentation by means of scale-space analysis and region growing. InMedical Image Computing and Computer-Assisted Intervention–MICCAI’99 1999 Jan 1; 90–97. Springer Berlin Heidelberg. 17. Martinez-Perez M, Hughes A, Thom S, Bharath A, Parker K. Segmentation of blood vessels from
red-free and fluorescein retinal images. Med Image Anal. 2007; 11: 47–61. doi:10.1016/j.media.2006.11. 004PMID:17204445.
18. Frangi AF, Niessen WJ, Vincken KL, Viergever MA. Multiscale vessel enhancement filtering. InMedical Image Computing and Computer-Assisted Interventation—MICCAI’98 1998 Oct 11; 130–137. Springer Berlin Heidelberg.
19. Fritzsche K, Can A, Shen H, Tsai C, Turner J, Tanenbuam H, et al. Automated model based segmenta-tion, tracing and analysis of retinal vasculature from digital fundus images. State-of-The-Art Angiogra-phy, Applications and Plaque Imaging Using MR, CT, Ultrasound and X-rays. 2003 Apr 29:225–298. 20. Jiang X, Mojon D. Adaptive local thresholding by verification-based multithreshold probing with
applica-tion to vessel detecapplica-tion in retinal images. Pattern Analysis and Machine Intelligence, IEEE Transacapplica-tions on. 2003 Jan; 25(1):131–137.
21. Xu L, Luo S. A novel method for blood vessel detection from retinal images. Biomedical engineering online. 2010 Feb 28; 9(1):14.
22. Zhou L, Rzeszotarski MS, Singerman LJ, Chokreff JM. The detection and quantification of retinopathy using digital angiograms. Medical Imaging, IEEE Transactions on. 1994 Dec; 13(4):619–626. 23. Al-Diri B, Hunter A, Steel D. An active contour model for segmenting and measuring retinal vessels.
Medical Imaging, IEEE Transactions on. 2009 Sep; 28(9):1488–1497 doi:10.1109/TMI.2009.2017941 24. Fraz MM, Barman SA, Remagnino P, Hoppe A, Basit A, Uyyanonvara B, et al. An approach to localize
the retinal blood vessels using bit planes and centerline detection. Computer methods and programs in biomedicine. 2012 Nov 30; 108(2):600–616 doi:10.1016/j.cmpb.2011.08.009PMID:21963241. 25. Ricci E, Perfetti R. Retinal blood vessel segmentation using line operators and support vector
classifi-cation. Medical Imaging, IEEE Transactions on. 2007 Oct; 26(10):1357–1365 doi:10.1109/TMI.2007. 898551
26. Lupaşcu CA, Tegolo D, Trucco E. FABC: retinal vessel segmentation using AdaBoost. Information Technology in Biomedicine, IEEE Transactions on. 2010 Sep; 14(5):1267–1274. doi:10.1109/TITB. 2010.2052282PMID:20529750.
27. Marín D, Aquino A, Gegúndez-Arias ME, Bravo JM. A new supervised method for blood vessel seg-mentation in retinal images by using gray-level and moment invariants-based features. Medical Imag-ing, IEEE Transactions on. 2011 Jan; 30(1):146–158.
28. Wang Y, Ji G, Lin P, Trucco E. Retinal vessel segmentation using multiwavelet kernels and multiscale hierarchical decomposition. Pattern Recognition. 2013 Aug 31; 46(8):2117–2133 doi:10.1016/j. patcog.2012.12.014
29. You X, Peng Q, Yuan Y, Cheung YM, Lei J. Segmentation of retinal blood vessels using the radial pro-jection and semi-supervised approach. Pattern Recognition. 2011 Nov 30; 44(10):2314–2324 doi:10. 1016/j.patcog.2011.01.007
30. Bankhead P, Scholfield CN, McGeown JG, Curtis TM. Fast retinal vessel detection and measurement using wavelets and edge location refinement. PloS one. 2012 Mar 12; 7(3):e32435 doi:10.1371/ journal.pone.0032435PMID:22427837
31. Niemeijer M, Staal J, van Ginneken B, Loog M, Abramoff MD. Comparative study of retinal vessel seg-mentation methods on a new publicly available database. InMedical Imaging. 2004 May 12; 648–656. International Society for Optics and Photonics.
32. Läthén G, Jonasson J, Borga M. Blood vessel segmentation using multi-scale quadrature filtering. Pat-tern Recognition Letters. 2010 Jun 1; 31(8):762–767.
33. Palomera-Pérez MA, Martinez-Perez ME, Benítez-Pérez H, Ortega-Arjona JL. Parallel multiscale fea-ture extraction and region growing: application in retinal blood vessel detection. Information Technology in Biomedicine, IEEE Transactions on. 2010 Mar; 14(2):500–506 doi:10.1109/TITB.2009.2036604 PMID:20007040.
34. Nguyen UT, Bhuiyan A, Park LA, Ramamohanarao K. An effective retinal blood vessel segmentation method using multi-scale line detection. Pattern recognition. 2013 Mar 31; 46(3):703–715 doi:10. 1016/j.patcog.2012.08.009
36. Orlando JI, Blaschko M. Learning fully-connected CRFs for blood vessel segmentation in retinal images. InMedical Image Computing and Computer-Assisted Intervention–MICCAI 2014 Sep 14; 634–
641. Springer International Publishing.
37. Mapayi T, Viriri S, Tapamo JR. Adaptive Thresholding Technique for Retinal Vessel Segmentation Based on GLCM-Energy Information. Computational and mathematical methods in medicine. 2015 Jan 1.
38. Zhao Y, Liu Y, Wu X, Harding SP, Zheng Y. Retinal vessel segmentation: An efficient graph cut approach with retinex and local phase. PloS one. 2015 Apr 1; 10(4):e0122332. doi:10.1371/journal. pone.0122332PMID:25830353
39. Asad AH, Hassaanien AE. Retinal Blood Vessels Segmentation Based on Bio-Inspired Algorithm. InApplications of Intelligent Optimization in Biology and Medicine. 2016; 181–215. Springer Interna-tional Publishing.
40. Dai P, Luo H, Sheng H, Zhao Y, Li L, Wu J, et al. A New Approach to Segment Both Main and Periph-eral Retinal Vessels Based on Gray-Voting and Gaussian Mixture Model. PloS one. 2015 Jun 5; 10(6): e0127748. doi:10.1371/journal.pone.0127748PMID:26047128
41. Vlachos M, Dermatas E. Multi-scale retinal vessel segmentation using line tracking. Computerized Medical Imaging and Graphics. 2010 Apr 30; 34(3):213–27. doi:10.1016/j.compmedimag.2009.09. 006PMID:19892522
42. Pizer SM, Amburn EP, Austin JD, Cromartie R, Geselowitz A, Greer T, et al. Adaptive histogram equali-zation and its variations. Computer vision, graphics, and image processing. 1987 Sep 30; 39(3):355–
368.
43. Truc PT, Khan MA, Lee YK, Lee S, Kim TS. Vessel enhancement filter using directional filter bank. Computer Vision and Image Understanding. 2009 Jan 31; 113(1):101–112.
44. Otsu N. A threshold selection method from gray-level histograms. Automatica. 1975 Jun; 11(285–
296):23–27.
45. Research Section, Digital Retinal Image for Vessel Extraction (DRIVE) Database, Utrecht, The Nether-lands, University Medical Center Utrecht, Image Sciences Institute. Available:http://www.isi.uu.nl/ Research/Databases/DRIVE/.
46. Deng H, Fitts JP, Peters CA. Quantifying fracture geometry with X-ray tomography: Technique of Itera-tive Local Thresholding (TILT) for 3D image segmentation. Computational Geosciences. 2016; 1–4. 47. Jain AK, Dubes RC. Algorithms for clustering data. Prentice-Hall, Inc.; 1988 Jul 1.
48. Tsai WH. Moment-preserving thresolding: A new approach. Computer Vision, Graphics, and Image Processing. 1985 Mar 1; 29(3):377–93.
49. Niblack W. An introduction to digital image processing. Strandberg Publishing Company; 1985 Oct 1; 115–116.