THE R E L A T I O N S H I P B E T W E E N S T E M V E S S E L P A R A M E T E R S
AND T H E D E V E L O P M E N T O F STRATA IN T H E EARLY STAGES OF S E C O N D A R Y F O R E S T S U C C E S S I O N IN A M A Z O N I A
Akio TSUCHIYA1
, Yoshihiko, HIRABUKI2
, Toshie NISHIZAWA3
, Pedro Braga LISBOA4
, Carlos Rosário da SILVA4
ABSTRACT - In order to compare the development of strata in the early stages of secondary forest succession with vessel parameters of the tree species, a forest inventory was carried out in
4-year (Q1: 48 m2), 11-year (Q2: 400 m2) and 20-year (Q3: 400 m2) forests and vessel parameters were investigated from stem cross sections of 18 species obtained in Q2. Thirty three species (21 families), 77 species (35 families), 39 species (20 families) were found in Q l , Q2, Q3,
respectively. The percentage of dead individuals, dead stems and the percentage of individuals with multiple stems increased with time after clear cutting. Also, the total D2H of Q3 was 26.1
times that of Q1, and the development of strata started in Q2 and Q3. The image analysis of vessel size, area and number of vessels revealed that species which reach the forest canopy had a large D2H value, vessel diameter and area, while species which remain near the forest floor
had smaller ones. Poecilanthe effusa (Huber) Ducke is an example of the latter case, with a large number of individuals and abundant sprouting of new stems from stumps, but with high mortality.
Key-words: Amazonia, secondary forest, strata, image analysis, vessels
A Relação entre os Parâmetros de Vasos no Tronco e Desenvolvimento de Estratos nos Estágios Iniciais de Sucessão em Florestas Secundárias na Amazônia
RESUMO - A fim de comparar o desenvolvimento dos estratos no estágio inicial da floresta secundária no Amazônia com os parâmetros de vasos nas espécies de árvores, um inventário florestal foi elaborado em florestas de 4-anos (Q1: 48 m2), 11-anos (Q2: 400 m2) e 20-anos (Q3:
400 m2) e os parâmetros de vasos foram investigados através dos cortes transversais dos troncos
em 18 espécies em Q2. Apesar de serem encontradas 33 espécies (21 famílias), 77 espécies (35 famílias), 39 espécies (20 famílias) nas respectivas áreas Q1, Q2 e Q3, a porcentagem de mortes individuais, troncos mortos e a porcentagem de caules individuais em relação a caules germinados aumentou com a passagem do tempo após o período de desmatamento. Também, foi observado que, o D2H total no Q3 foi 26.1 vezes maior que em Q l e o desenvolvimento dos estratos
iniciaram-se em Q2 e Q3. As análises de imagens do tamanho do vaso, área celular e do número de vasos, demonstraram que as espécies que poderiam chegar a compor a cobertura florestal, apresentam grandes valores em D2H, diâmetro de vasos e área. Enquanto as espécies que poderiam
permanencer no sub-bosque demonstraram baixos valores dos mesmos parâmetros. Poecilanthe effusa (Huber) Ducke e um exemplo do segundo caso: possue grande número de indivíduos e germina consideravelmente um bom número de novos caules, mas apresenta grande taxa de mortalidade.
Palavras-chave: Amazônia, floresta secundária, estratos, análises imagens, vasos
1 Faculty of Integrated Arts and Sciences, Hiroshima University, 1-7-1 Kagamiyama, Higashi-Hiroshima, Hiroshima 739-8521, Japan
2 Faculty of Education, Miyagi University of Education, Aoba, Aramaki, Aoba-ku, Sendai, Miyagi 980-8578, Japan
3 Faculty of Humanities, Tokyo Seitoku University, 2014 Nakadaiyatsu, Hoshina, Yachiyo, Chiba
276-0013, Japan
4 Department of Botany, Museu Paraense Emílio Goeldi, 376 Αν. Magalhães Barata, Belém PA 66040-170, Brazil
Introduction
In a natural tropical rain forest, the forest structure is usually divided into three layers with the passage of time, and each space is occupied by trees adapted to the light conditions in that layer (Federov, 1966). If a gap is formed in the forest for any reason, however, competition among the trees established in the gap starts for space (Piatt & Strong, 1989, Vazques-Yanes & Orozco-Segovia, 1994). Competi tion generated by natural causes, such as fallen trees and heavy rains, is widely studied, but recently huge ar tificial clear-cuts have been examined also (Fearnside, 1990, 1991).
In the past, many studies of Ama zonian tropical humid forests have fo cused on exploitation and evaluation of timber resources. Project RADAMBRASIL is a typical example. Remote sensing of forest/mineral re sources was carried out in the whole Brazilian Amazon, and fieldwork on species composition and aboveground biomass was also conducted by the Instituto Nacional de Pesquisas da Amazônia - INPA, Museu Paraense Emílio Goeldi - MPEG and Empresa Brasileira de Pesquisa Agropecuária -EMBRAPA. Also, wood anatomical characteristics of useful species were investigated in the laboratory (SUDAM/ DRN, 1981, Loureiro et al., 1997).
These projects described in detail the geographical distribution of commer cially valuable species, biodiversity and wood biomass. However, they were in tended for natural forests. During the
1980s, interest changed toward the ex pansion of pasture/roads and the disap
pearance of forested areas. Further, ex periments to minimize disturbance, simulation studies of logging interval to maximize yield, and afforestation pro grams began. However, there are few studies that investigate natural vegeta tion recovery in early plant succession (Carvalho, 1986, Taylor et al, 1995),
and there is no study on the relationship between secondary forests with low commercial value and wood quality.
Aside from light intensity, water supply is also indispensable for the growth of trees. The parameters of ves sels in which sap flow passes from the root are believed to be a key to under standing the growth pattern of trees (Shimaji et al, 1976, Schweingriiber, 1988). Therefore, we investigated spe cies composition in three secondary for ests with different ages, and investigated the relationship between wood biomass and vessel parameters to try to elucidate details of competition for space among species occurring in the early stages of secondary forest succession.
Material and M e t h o d s Fieldwork
PHCA, 1984). The terrain has a gentle slope, and the ground surface is cov ered with a shallow medium yellow latosol originating from mid-Tertiary sediments (Gatto, 1991).
Fieldwork was carried out in July and August, 1995. The general area has natural forests with no distur bance, but there are some areas where the forest was clear cut to construct helicopter and Cessna bases that were abandoned without being used (De La Penha et al., 1990). Quadrats were established in secondary forests whose history was known. They were 4-year, 11-year and 20-year forests, respec tively (hereafter, called Q l , Q2 and Q3, respectively). The area of Ql was 48 m2, and the latter two quadrats were 400 m2. In the forest inventory, tree species were identified, individual trees (>1.3 m in height) were mapped within the quadrat, stem and lowest leaf layer heights were measured with a telescoping pole, basal diameter (Ql) and DBH (Q2, Q3) were measured with a vernier caliper/measure tape. The status of stems (living/dead, gemi nate from seeds/regenerated from stumps) and the number of live and dead stems were also investigated. When a tree had multiple stems, the height and DBH of the tallest stem were measured. Palms were also in cluded in the inventory. For palms, the highest leaf layer was regarded as the plant height, and the diameter at the rosette-like basal portion was substi tuted for the DBH. The D2H, an index of stem biomass, was calculated from the product of a square of DBH and tree height.
Tree Disk Sampling and Image Analysis
Tree disks were obtained by cut ting down the stems at 30 cm to 1 m above the ground. The number of disks was 11 in Q l , 39 in Q2 and 6 in Q3 (families: 20, species: 29). For spe cies with two or more disks, care was taken to obtain tree disks having as different a stem size as possible, al though this was impossible for every species. The disks were brought back to laboratory after painting with acrylic resin (Asahi, A-011) to stop mold. In addition, 39 samples of 18 species in 12 families obtained in Q2 were investigated in order to discuss the species differences and the rela tions to biomass in a same aged for est. The species are: Annona montana
M a c f , Annona paludosa Aubl.,
Byrsonima crispa ADR. Juss.,
Bowdichia nitida ex Benth.,
Cochlospermum orinocensis (H.B.K.) Steud., Cupania hispida SW, Croton matourensis Aubl., Cupania rubiginosa (Poir.) Radlk., Dipterix odorata (Aubl.) Willd., Enterolobium schomburghii Benth., Hirtella triandra
SW., Lacistema polystachum Schniz.,
Myrcia fallax (Rich.) D C , Maprounea guianensis Aubl., Poecilanthe effusa
(Huber) Ducke, Sclerolobium paniculatum Vog., Sclerolobium paraense Huber, Vismia cayenensis
(Jacq.) Pers.
to a slide glass (Konishi, Bond Ε Set), and was polished by a grinder, using fine sand paper (#800, #2,000). The reason a microtome was not used is that this requires small sections and is not appropriate for large specimens. Tree disks of over 20 cm in diameter were divided into smaller pieces be cause the size was too large to slice by chip saw.
The image analysis system used in this study takes in an image through a CCD camera (Tokyo Electronic In dustry, CS-5510) from a measure scope (Nikon, MM-22). The reflected images of chip samples were con verted into digital signals by an ana log capture board (Neotech, IG-24-PCI) and were inputted into a com puter. The data was processed by im age analysis software (Mitani, MacScope 2.5). Length and brightness of the input image were calibrated, and ROI (range of interest) was set up. The image was transformed into black & white, and then the object (vessels) was extracted. It is difficult to distin guish vessels from axial and ray paren chyma because they sometimes have the same whitish brightness. In this case, the location of vessels on the monitor was marked with a manually operated pen. Finally, the area, diam eter, circumference of each vessel were measured. The average, total and standard deviation of these parameters were calculated. These series of analy ses were conducted four times for a tree-ring from 1994, the year prior to the fieldwork for the obtained samples. When a tree-ring width of one year was too large to input at a time, it was
subdivided into several images.
Results
Species Composition and Forest Structure
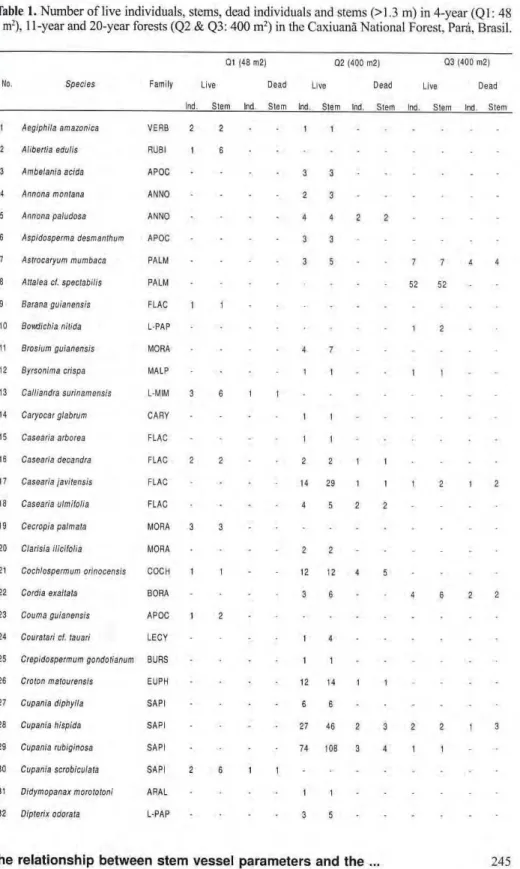
The number of species in Ql was 33 with 165 live and 22 dead in dividuals, 246 live stems and 24 dead stems (Tab. 1). The percentage of in dividuals sprouted from stumps was 28.0% and the mean number of stems per stump was 7.2±81. The species with more than 10 live individuals were P. guianensis (n = 34), V. guianensis (32), O. longifolia (28) and
M. fallax (16). These 4 species com prised 60.6% of all individuals. The number of tree species appearing in Q2 was 75, and two palm species were also found. There were 540 live and 46 dead individuals, 904 live stems and 55 dead stems. The percentage of individuals with multiple stems was 29.0% and the mean stem number was 3.6+1.9. In this quadrat, it could not be determined whether the individual had germinated from seed or sprouted from a dead stem because the original stumps (if any) had decomposed. The species with over 20 live individuals were P. effusa (n = 129), C. rubiginosa
Table 1. Number of live individuals, stems, dead individuals and stems (>1.3 m) in 4-year (Ql: 48 m2), 11-year and 20-year forests (Q2 & Q3: 400 m2) in the Caxiuanã National Forest, Pará, Brasil.
Q1 (4Θ m 2 ) Q 2 ( 4 0 0 m2) Q 3 4 0 0 m2)
No. Species Family Live D e a d Live D e a d Live D e a d
Ind S t e m Ind. S t e m Ind S l e m Ind S l e m Ind. S l e m Ind. S l e r
1 Aegiphila amazônica V E R B 2 2 1 1
2 Aliberlia edulis RUBI 1 6
3 Ambelania acida A P O C 3 3
4 Annona monlana A N N O 2 3
5 Annona paludosa A N N O 4 4 2 2
6 Aspidosperma desmanthum A P O C 3 3
7 Aslrocaryum mumbaca P A L M 3 5 7 7 4 4
8 Atlalea cl. spectabilis P A L M 5 2 5 2
9 Barana guianensis F L A C 1
10 Bovtdichia nitida LPAP 1 2
11 Brosium guianensis MORA 4 7
12 Byrsonima crispa M A L P 1 1 1 1
13 Calliandra surinamensis LMIM 3 6 1 1
14 Caryocar glabrum C A R Y 1 1
15 Casearia arbórea F L A C 1 1
16 Casearia decandra F L A C 2 2 2 2 1 1
1 7 Casearia javilensis F L A C 14 2 9 1 1 1 2 1 2
16 Casearia ulmilolia F L A C 4 5 2 2
19 Cecropia palmala M O R A 3 3
2 0 Clarisia ilicilolia M O R A • 2 2
2 1 Cochlospermum orinocensis C O C H 1 1 12 12 4 5
22 Cordia exallata B O R A 3 6 4 6 2 2
2 3 Couma guianensis A P O C 1 2
24 Couratari cl. lauari L E C Y 1 4
25 Crepidospermum gondolianum B U R S 1 1
2 6 Croton malourensis E U P H 1 2 14 1 1
2 7 Cupania diphylla S A P I 6 6
28 Cupania hispida S A P I 2 7 4 6 2 3 2 2 1 3
2 9 Cupania rubiginosa S A P I 7 4 108 3 4 1 1
3 0 Cupania scrobiculala S A P I 2 6 1 1
31 Didymopanax morototoni A R A L 1 1
Q1 (48 m2) 0 2 ( 4 0 0 m2) Q 3 ( 4 0 0 m2)
No. S p e c i e s Family Live D e a d Live D e a d Live D e a d Ind. S t e m Ind. Stem Ind. Stem Ind. S t e m Ind. Stem Ind S t e m
33 Duguelia longicuspis A N N O ' 2
3 4 Enlerolobium schomburghii LMIM 1 1
3 5 Eschmilera cl. bracieala L E C Y 1 1
3 6 Eschweilera coriacea L E C Y 1 4
3 7 Eugenia ci. billora MYRT 1 2 1
3 8 Eugenia egensis MYRT 3 6
3 9 Eugenia ci. omissa MYRT 1 1
40 Eugenia palrisii MYRT 1 5 13 1 1
41 Faramea anisocalyx RUBI 3 9
4 2 Geyssospermum cericeum A P O C 4 1 2 1 4
4 3 Goupia glabra C E L A 2 2 3 4
4 4 Gualteria poeppigiana A N N O 2 2 1 2
45 Himalantnus scuuba A P O C 3 4 1 1
4 6 Hiriella burchellii C H R Y 14 25 1 1 2 3 48 2 2
4 7
48
Hirtella triandra
Hymenolobium llavum
C H R Y
LPAP
1 3 1 2 14
1 23
1
1 1 4 11 1 1
4 9 Inga heterophylla LMIM 3 7 1 1 2 1 2 4 5
5 0 Lacistema polystachyum L A C I 8 24 2 2 1 2
5 1 Lacunaria minor QUIN 1 1
52 Lecythis pisonis L E C Y 4 4
5 3 Licania canescens C H R Y 2 11 1 2 2 3 8 8 1
5 4 Licania cl. heteromorpha C H R Y 2 2 •
5 5 Lindackeria paucitlora F L A C 1 4
56 Maprounea guianensis E U P H 6 7 1 0 14 5 1 3 β
5 7 Malayba cl. arborescens S A P I 1 1
5 8 Maximiliana maripa P A L M 6 5 2 2
59 Miconia eriodonla M E L A 1 10 1 1 2 2
6 0 Miconia poeppigiana M E L A 1 1
61 Miconia splendens MELA 8 8 •
6 2 Micropholis venulosa S A P O 1 1
63 Morinda Iriphylla RUBI 1 1
64 Myrcia bracieala MYRT 2 4 1 1 16 16
6 5 Myrcia lallax MYRT 16 2 2 1 1 8 3 1 1
66 Myrcia sylvalica MYRT 1 2 1 1
6 7 Neer sp. NICT 2 4 2 2 7 11 1 1
6 8 Ocolea longilolia LAUR 2 8 34 1 1 •
6 9 Oenocarpus distichus P A L M 1 1
Q1 4 8 m2) 0 2 ( 4 0 0 m2) 0 3 ( 4 0 0 m2)
No. Species Family Live D e a d Liv D e a d Live D e a d
Ind. S l e m Ind. Stem Ind. Stem Ind. S t e m Ind. Stem Ind. S t e m
71 Ormosia paraensis LPAP 4 14
72 Ouratea caslanhelolia O C H N 1 1
73 Ouratea paraensis O C H N 1 1
74 Palicourea guianensis RUBI 34 34 2 2 -
-75 Parkia igeitlora LMIM 1 1
76 Piplhecellobium cl. talilol'wm LMIM 1 1
77 Piptocarpa opaca C O M P
78 Poecilanthe eiiusa LPAP 129 3 2 6 17 19 39 148 22 65
79 Pogonophora schomburgkiana E U P H 2 9 7 8 11 15
8 0 Protium decandrum BURS 1 1
81 Prolium guianense BURS 6 6 ·
8 2 Protium pilosum BURS 1 1
8 3 Protium triloliolatum BURS 1 1
84 Psidium acutangulum MYRT
85 Pterocarpus ronrii LPAP 1 1
86 Rhabdodendron amazonicum RUTA 2 2 -
-8 7 Rollinia exucca A N N O
88 Ryania pyrilera FLAC 17 19
8 9 Sclerolobium melanocarpon L C A E 7 7
9 0 Sclerolobium paniculatum LCAE 5 5 1 1
91 Scleroiobium paraense LCAE 5 5
9 2 Simaba cedron SIMA 1 1
93 Siparuna guianensis MONI 1 1 2 2 ·
94 Solano leucocarpon SOLA 2 2
95 Sorocea steimbachii MORA 1 1
96 Stryphnodendron pulcherrimum LMIM 2 7 1 1
9 7 Swartzia brachyrachis LMIM 3 9 1 2 3 3
98 Smrtzia cardiosperma LCAE 1 1
99 Swartzia racemosa LCAE 1 1 ·
100 Taiisia longilotia SAPI 2 2
101 Talisia mollis S A P I 6 6 3 3
102 Tapirira guianensis A N A C 5 5 1 1
103 Telragastris panamensis BURS 2 2 -
-104 Theobroma speciosum S T E R 2 4 1 3
105 Trattinickia rhoitolia BURS 19 2 0
106 Trema micrantha ULMA 1 1
107 Vismia cayenensis G U H 4 4 ·
-108 Vismia guianensis G U T T 32 35
109 Vochysia densillora V O C H 4 4
110 Xylopia amazônica A N N O 6 6 1 1
Unidentilied 8 8 5 5 11 18
stems reached 41.0%. The species with over 20 live individuals were A. cf.
spectabilis (n = 52), P. effusa (39), P. schomburgkiana (29), H. burchellii (23), and these 4 species accounted for 63.6% of all individuals. The number of dead individuals was also high for P. effusa
(22) and P. schomburgkiana (11). Six species were found in all quadrats. Fourteen species were com mon to both Ql and Q2, and 63 new species appeared in Q2. The number of species common to both Q2 and Q3 was 22, and the number of new spe cies in Q3 was 17. At the family level, 21 families appeared in Q l , 35 fami lies in Q2 and 20 families in Q3. Sev enteen families were common to Ql and Q2,20 families to Q2 and Q3, and
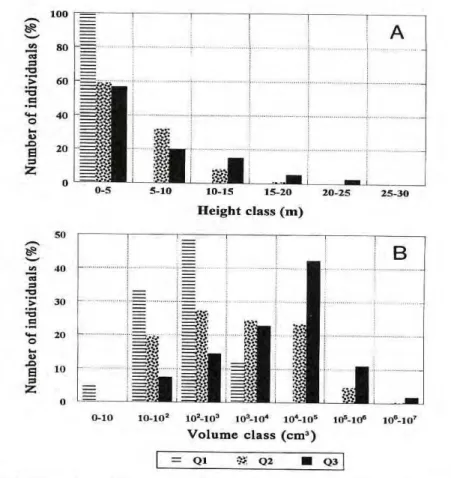
10 families appeared in all quadrats. Although all three quadrats are in early stage of secondary forest suc cession, tree height increased and the forest started to develop strata along the sequence, which represents ap proximately 20 years of succession. All individuals were concentrated in the class 0-5 m in Q l , more classes were present in Q2 and the highest class reached 25-30 m in Q3 (Fig. I.A.). In terms of D2
H, there was a peak in 102
-103
class in Q l , this peak moved to a larger class and the range became wider in Q2, finally shifted up to the 104-105 class in Q3 (Fig. I.B.). The difference between Q1 and Q3 is
1 to 2 orders of magnitude.
When comparing the total D2H per quadrat (/400 m2) by summing the D2H of each tree in the quadrat, Ql had 0.64 m3 Q2 had 12.07 m3 and Q3 had 16.72 m3 (in Q l , the total D2H (/
48 m2) was converted into the value per 400 m2). Assuming the value at the clear cutting to be zero, the growth curve is approximately synodal (Fig. 2), since total D2H increased tremen dously during the 7 years between Q1 and Q2, but slowed during the 9 years between Q2 and Q3.
Differences of Vessel Parameters among Species
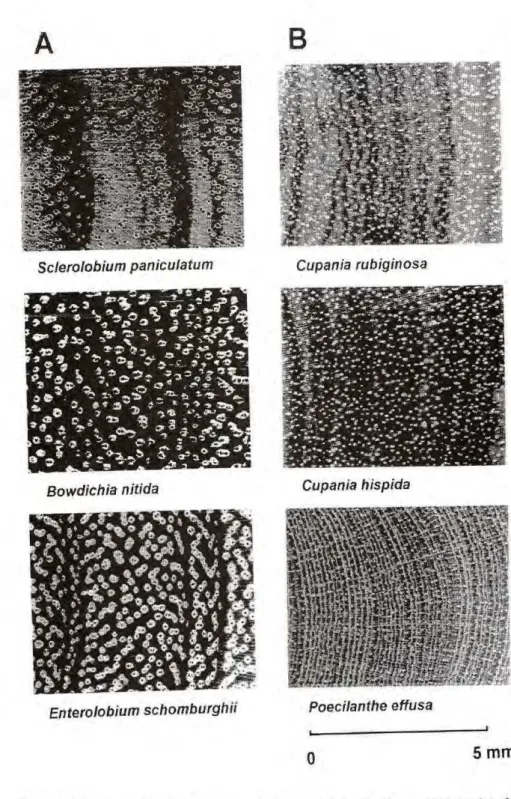
Examples of stem cross sections are shown in Figure 3. Group A con tains tree species with large vessels and Group Β with small ones. S. paniculatum has the largest diameter among the 18 species (0.158±0.036 mm) and the summation of each ves sel area accounts for 7.4% of the en tire image investigated. One or a few united vessels are randomly distributed (diffused arrangement). The axial pa renchyma is vasicentric, one of the paratracheal parenchyma types which enclose vessels, but the ray paren chyma is not obvious. The diameter of
B. nitida is as large as S. paniculatum
ves-J £ 8 0 - =
6 0
4 0
0 - 5
«* 2 0
-1 0
0 - 1 0
A
5 - 1 0
I
ι _
1 0 - 1 5 1 5 - 2 0
Height class (m)
2 0 - 2 5
1
tl
I
! m
Β
1 0 - 1 02
1 02
- 1 03
1 03
- 1 04
1 04
- 1 05
l t f - l O6
1 06
- 1 07
Volume class ( c m3
)
= Q i 3Ύ Q 2 Q 3
Figure 1. Comparison of forest structure across three secondary forest succession ages in the Caxiuanã National Forest, Pará, Brasil. A. tree height classes (% live individuals). B. D2H classes
Bowdichia nítida
Enterolobium schomburghii
Cup an ia hispida
Poecitanthe Qffusa
0
5 mm
seis are united to form clusters, and a couple of clusters are enclosed by the confluent parenchyma, but the ray pa renchyma is hard to confirm.
On the other hand, tree species of Group Β have small vessel diam eters (0.05-0.06 mm), and the vessel area is also small (1.5-1.7%). How ever, the number of vessels (/mm2) is higher, for example, 6.5 (C.
rubiginosa), 6.4 (C. hispida) and 8.3
(P. effusa). Because C. rubiginosa and C. hispida belong to the same family (Sapindaceae), they have a similar wood structure (diffused arrangement, vasicentric parenchyma). P. effusa also has a diffused arrangement, but the parenchyma is independent from the vessels. The apotracheal parenchyma is tangentially distributed. All the three species have narrow ray parenchyma.
Because the number of vessels decreases when vessel diameter in creases, the relationship had a negative correlation coefficient (r = -0.88; p<0.01). Further, the relationship be tween vessel diameter and area had a positive correlation coefficient (r = 0.90; p<0.01) because vessel area was depen dent on diameter. In addition, species of Group A have large diameter vessels but the number of vessels is small, while Group Β has small diameter vessels and a large number of them.
Tree G r o w t h and Vessel Para meters
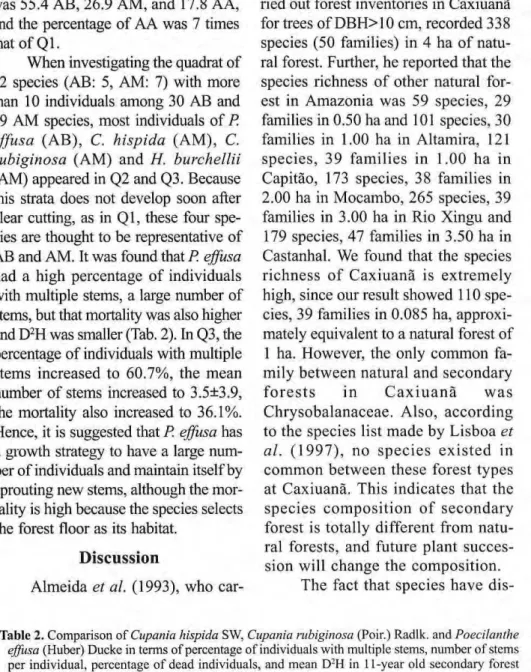
Both the area and diameter of the vessel parameters had a positive corre lation coefficient to D2
H, but the num ber of vessels had a negative correlation coefficient (Fig. 4). The relationship
between vessel area and D2H showed that the D2H of PE, CR and CH, whose area was smaller than 2%, was 3,269, 32,438 and 34,063 cm3 respectively. In contrast, the D2H of ES, whose area was 5.1%, was 639,812 cm3
, and the D2 H of BN (vessel area: 5.8%) and SPN (ves sel area: 7.4%) was 1,062,500 cm3
. The difference between PE and BN or SPN was about 325 x. In fact, the mean DBH of PE was 2.00±0.25 cm, and the tree height was 4.20±0.75 m, while they were 25.0 cm and 17.0 m in both BN and SPN. The vessel diameter had a similar relation with D2
H. There was a tendency for the species with large di ameter vessels to have large D2H. On the other hand, the number of vessels was negatively correlated to D2H, although the relationship was less clear (r2 = 0.31; p<0.05). The number of vessels per unit area tended to decrease as the tree size becomes larger.
The 18 species were classified into 7 canopy species (>20 m, AA), 7 inter mediate species (5 to 20 m, AM) and 4 understory (<5 m, AB). The species of Group AA seem to form a cluster in every scatter diagram (Fig. 4). For ex ample, they are located in the upper right in vessel area vs D2H and vessel diam eter vs D2H (Fig. 4.A, B), and are lo cated in lower right in the number of vessels vs D2H (Fig. 4.C).
t o
t o
(Λ
c ο
ω
δ 03
10.000
8.000
0.000
0 300000 600000 900000 1200000 1500000
D2
H ( c m3
)
Β Β
<u
ε
5
0.200
0.150
-0.100
0.000
0 300000 600000 900000 1200000 1500000
D2
H ( c m3
)
300000 600000 900000 1200000 1500000
D'H ( c m3
)
Figure 4. Relationship between vessel parameters and D2H
in 18 species in 11-year old secondary forest (Q2) in the Caxiuanŕ National Forest, Pará, Brazil. A: Vessel area vs D2H, B: Vessel diameter vs D2H, C: Number of vessels
vs D2H. Black circles: canopy species. AM: A. montana,
AP: A. paludosa, BC: B. crispa, BN: B. nitida, CO: C. orinocensis, CH: C. hispida, CM: C. matourensis, CR:
C. mbiginosa, DO: D. odorata, ES: E. schombwghii, HT:
was 55.4 AB, 26.9 AM, and 17.8 AA, and the percentage of AA was 7 times that of Ql.
When investigating the quadrat of 12 species (AB: 5, AM: 7) with more than 10 individuals among 30 AB and 49 AM species, most individuals of P. effusa (AB), C. hispida (AM), C. rubiginosa (AM) and H. burchellii
(AM) appeared in Q2 and Q3. Because this strata does not develop soon after clear cutting, as in Q l , these four spe cies are thought to be representative of AB and AM. It was found that P. effusa
had a high percentage of individuals with multiple stems, a large number of stems, but that mortality was also higher and D2H was smaller (Tab. 2). In Q3, the percentage of individuals with multiple stems increased to 60.7%, the mean number of stems increased to 3.5±3.9, the mortality also increased to 36.1%. Hence, it is suggested that P. effusa has a growth strategy to have a large num ber of individuals and maintain itself by sprouting new stems, although the mor tality is high because the species selects the forest floor as its habitat.
Discussion
Almeida et al. (1993), who car
ried out forest inventories in Caxiuanã for trees of DBH>10 cm, recorded 338 species (50 families) in 4 ha of natu ral forest. Further, he reported that the species richness of other natural for est in Amazonia was 59 species, 29 families in 0.50 ha and 101 species, 30 families in 1.00 ha in Altamira, 121 species, 39 families in 1.00 ha in Capitão, 173 species, 38 families in 2.00 ha in Mocambo, 265 species, 39 families in 3.00 ha in Rio Xingu and 179 species, 47 families in 3.50 ha in Castanhal. We found that the species richness of Caxiuanã is extremely high, since our result showed 110 spe cies, 39 families in 0.085 ha, approxi mately equivalent to a natural forest of 1 ha. However, the only common fa mily between natural and secondary forests in C a x i u a n ã w a s Chrysobalanaceae. Also, according to the species list made by Lisboa et al. (1997), no species existed in common between these forest types at Caxiuanã. This indicates that the species composition of secondary forest is totally different from natu ral forests, and future plant succes sion will change the composition.
The fact that species have
dis-Table 2. Comparison of Cupania hispida SW, Cupania rubiginosa (Poir.) Radlk. and Poecilanthe effusa (Huber) Ducke in terms of percentage of individuals with multiple stems, number of stems per individual, percentage of dead individuals, and mean D2H in 11-year old secondary forest
(Q2) in the Caxiuanã National Forest, Pará, Brasil.
Cupania hispida Cupania rubiginosa Poecilanthe ellusa
I n d i v i d u a l w i t h m u t i p l e s t e m s ( % ) 3 5 . 7 2 9 . 9 4 8 . 6
N u m b e r o f s t e m s p e r i n d i v i d u a l 1 . 7 + 1 . 1 1 . 5 ± 0 . 8 2 . 4 1 2 . 0
D e a d i n d i v i d u a l s ( % ) 6 . 9 6 . 1 1 1 . 6
tinct life strategies and have differ ent vessel parameters is related to the difference of tree size. If a tree reaches the canopy layer, the height is favorable for photosynthesis, but it is n e c e s s a r y to p u m p a huge amount of water and the plant needs large sized vessels. This fact is ex plained by Poiseuille's law, that states that the amount of fluid which passes through a cylinder is propor tional to the summation of fourth power of its diameter (Zimmermann, 1983). As tree size increases, the water potential gradient in stems and branches also increases (Calkin et al., 1986, Tyree & Ewers, 1991). The tree copes with the gradient by increasing vessel diameter and area. Even if the tree has a large number of vessels, vessel area does not
in-0 . 4 in-0 in-0
^ 0.350
1
^ 0.300
Φ 0 . 2 5 0
ω
Β 0 . 2 0 0 cd
^ 0 . 1 5 0
"ω
£ o.ioo
^ 0.050crease because mean diameter be comes smaller. In contrast, small sized species remaining near the for est floor do not need to transport water in large quantities. It is be lieved that the difference of vessel diameter and area is caused by this difference of height growth.
According to SUDAM/DRN ( 1 9 8 1 ) , who a n a l y z e d stem transections of 54 useful species at C u r u á - u n a Forest R e s e r v e near
Santarém, Pará, and described their wood characteristics, tall species have large sized vessels (Fig. 5). Al though individual tree size was un known, 52 species were classified to AA and AM, following Rodrigues (1989) and Loureiro et al. (1997). The figure indicated that as vessel diameter increases and the number
0.000
•
1 "
J *
ft
i
·>.
··
41
•
·· ·
•
•
0 10 20 30 4 0
Number of vessels (/mm
2)
50
of vessels decreases, the share of AA becomes higher. This result is from a natural forest, and the species are limited to Groups A A and AM. However, the relationship between vessel number and diameter of our study seems to correspond to the upper left of the figure.
In this study, vessel parameters were compared to D2H and experi mentally classified potential tree height, using stem transections ob tained from juvenile secondary for ests. The relationship of older sec ondary forests and natural forests in which the strata development pro gressed further has not yet been ex amined. It is necessary to investigate older forests to verify the results of this study. Further, species taken up in this study were diffused and semi ring a r r a n g e m e n t s . This kind of study has not yet been conducted for ring and radial porous wood species, although most of tropical hardwood species have diffused porous wood (IAWA, 1989).
A c k n o w l e d g e m e n t s
This study was supported by the 95' Overseas Scientific Expedition of the Japanese Ministry of Education, Science and Culture entitled "Survival strategy of tree species in the semi-arid and humid tropics of Brazil (Leader: Toshie Nishizawa)". We wish to ex press special thanks to local workers for their assistance in our fieldwork.
Literature cited
Almeida S.S.; Lisboa, P.B.; Silva, A.S.L. 1993. Diversidade florística de uma comunidade
arbórea na estação científica "Ferreira Penna" em Caxiuanã (Pará). Boletim do Museu Paraense Emílio Goeldi, Série Botânica, 9(1):93-128.
Calkin, H.W.; Gibson, A.C.; Nobel, PS. 1986. Biophysical model of xylem conductance in tracheids of the Fern Ρ ter is vittata. Journal of Experimental Botany, 37:1054-1064. Carvalho, J.O.P.; Silva, J.N.M.; Lopes, J. do
C.A.; Montagner, L.H.; Carvalho, M.S.P. 1986. Composição florística de uma mata secundária no planalto de Belterra no Pará.
In: Anais do J- Simpósio do Trópico Úmido, Vol. II, Flora e floresta. EMBRAPA/CPATU, Belém. pp. 197-205. De La Penha, G.M.; Lisboa, P.B.; Almeida,
S.S. 1990. A estação científico do Museu
Emílio Goeldi. Ciência em Museus,
2:87-96.
Fearnside, P.M. 1990. The rate and extent of deforestation in Brazilian Amazonia. En-vironmental Conservation, 17(3):213-226. F e a r n s i d e , P.M. 1991. D e s m a t a m e n t o e desenvolvimento agrícola na Amazônia.
In: Lena, Ρ; Oliveira, Ε. (eds.) Amazônia, a fronteira agrícola 20 anos depois.
Museu Paraense Emílio Goeldi, Belém. pp.207-222.
Federov, A. A. 1966. The structure of the tropi cal rain forest and speciation in the humid tropics. Journal of Ecology, 54(1):1-12. Gatto, L.C.S. 1991. R e l e v o . In: IBGE.
Geografia do Brasil, Vol.3, Região Norte. IBGE, Rio de Janeiro, pp.47-60. IAWA 1989. IAWA list of microscopic features
for hardwood identification. IAWA Bulle-tin 10(3):219-332.
Lisboa, P.B.; Silva; A.S.L, Almeida, S.S. 1997. Florística e estrutura dos ambientes. In:
Lisboa, P.B. (ed.) Caxiuanã. Museu Paraense Emílio Goeldi, Belém. pp. 163-183. Loureiro, A.A.; De Freitas, J.A.; De Freitas, C A . A . 1997. Essências madeireiras da Amazônia, Vol.3. INPA, Manaus. 103p. Piatt, W.J.; Strong, D.R. 1989. Special feature
- Tree fall gaps and forest dynamics. Ecol-ogy, 70(3):535-576.
classificação científica, e d e s c r i ç ã o detalhada dos arbustos, plantas, etc). In:
R o d r i g u e s , R.M. (ed.) A flora da Amazônia. CEJUP, Belém, pp.23-205. Schweingr٧ber, F.H. 1988. Tree-ring growth
and the site. In: Schweingr٧ber, F.H. (ed.)
Tree-rings. Basics and applications in dendrochronology. Kluwer Academic Publishers, Dordrecht, pp.95-142.
Shimaji, K.; Sudo, S.; Harada, H. 1976. Cell structure of broadleaf trees. In: Shimaji, K., Sudo, S., Harada, H. (eds.) Wood anatomy. Morikita Shuppan, Tokyo, pp. 129-187. (in Japanese)
SUDAM/DRN 1981. Madeiras da reserva
florestal de Curuá-Una, estado do Pará: caracterização anatômica, propriedades gerais e aplicações. SUDAM, Belém. 118p. SUDAM/PHCA 1984. Atlas climatológico da
Amazônia. SUDAM, Belém. 125p. Taylor, C M . ; Silander, S.; Waide, R.B.;
Pfeiffer, W.J. 1995. Recovery of a tropi cal forest after gamma irradiation: a 23-year chronicle. In: Lugo, A.E.; Lowe, C. (eds.) Tropical forests: management and ecology, Ecological Studies 112. Springer Verlag, New York, pp.258-285.
Tyree, M.T.; Ewers, F.W. 1991. The hydraulic architecture of trees and other woody plants. New Phytologist, 119:345-360. Vazques-Yanes, C ; Orozco-Segovia, A. 1994.
Signals for seeds to sense and respond to gaps. In: Caldwell, M.M.; Pearcy, R.W. (eds.) Exploitation of environmental het-erogeneity by plants. Academic Press, San Diego, pp.209-236.
Z i m m e r m a n n , M.H. 1983. The Hagen-Poiseuille equation and its implications.
In: Zimmermann, M.H. (ed.) Xylem struc-ture and the ascent of sap. Springer Verlag, New York. pp. 13-15.