Efficient Brain Tumor Detection Using Wavelet Transform
Ku. Mayuri R. Khode*, Prof. S. R. Salwe**, Prof. A.P. Bagade***,
Dr. R. D. Raut****
*(M.Tech.VLSI student, B.D.C .E, Sewagram.) **(EXTC Department, B.D.C.E, Sewagram.) ***(EXTC Department, B.D.C.E, Sewagram.) ****(Electronics Deapartment, B.D.C.E., Sewagram.)
ABSTRACT
Bra in tumor detection is a challenging task and its very important to analyze the structure of the tumor correctly so a automatic method is used now a days for the detection of th e tumor. This method saves time as well as it reduces the error which occurs in the method of manual detection. In this paper the tumor is detected using wavelet transform. MRI is an important tool used in many fie lds of med icine and is capable of generating a detailed image of any part of the hu man body. The tumor is segmented fro m the M RI images , features are e xtracted and then the area of the tumor is determined. PNN can successfully handle the process of brain tumor classification.
Keywords:
Brain tu mor, detection, MRI, segment, wavelet.I.
INTRODUCTION
The buildup of extra cells often forms a mass of tissue called a growth or tumor. Bra in tumor is one of the ma jor causes of death among people. The symptoms of a brain tumor depend on tumor size, type and location. Sympto ms may be caused when a tumor presses on a nerve or harms a part of a brain. Also they may be caused when a tumor blocks the fluid that flows through and around the or when the brain swells because build up of fluid. Headaches, nausea and vomit ing, Changes in speech, vision or hearing, proble m ba lancing or walking, changes in mood, personality or ability to concentrate, problems with me mo ry, muscle jerking or itching, nu mbness or tingling in the arms or legs.
Accurate detection of the type of brain abnormality is highly essential for treat ment planning which can minimize the fatal results. Manual detection of brain tumor is a tedious job and takes a lot of time and not accurate, varies from one doctor to another. Accurate results can be obtained only through computer aided automated systems. Besides being accurate, these techniques must coverage quickly in order to apply them for real time applications. Bra in tumor can be diagnosed by using magnetic resonance imag ing (MRI), ultrasonic, CT images and X-rays. Magnetic Resonance Imag ing is an important tool used in many fields of medic ine and is capable of generating a detailed image of any part of the human body.
MRI stands for Magnetic Resonance Imaging. A MRI scanner uses powerful magnets to polarise and e xcite hydrogen nuclei (single proton) in human tissue, which produces a signal that can be
detected and it is encoded spatially, resulting in images of the body. The MRI machine e mits radio frequency (RF) pulse that specifica lly binds only to hydrogen. The system sends the pulse to that specific area of the body that needs to be exa mined. Due to the RF pulse, protons in that area absorb the energy needed to make the m spin in a different direction. This is meant by the resonance of MRI. The RF pulse makes the protons spin at the larmour frequency, in a specific direction. This frequency is found based on the particular tissue being imaged and the strength of the ma in magnetic fie ld.
Classification of the brain tumor is also a important task for treatment planning. There are two types of tumor wh ich are- benign (non-cancerous) and ma lignant (cancerous) tumors. Conventional methods involve invasive techniques such as biopsy, lu mbar puncture and signal tap method, to detect and classify brain tumor into benign and malignant which are very painful and time consuming.
Wavelet analysis is an effective methodology capable of revealing aspects of data which other signal analysis techniques. Analyzing the images at multip le leve ls, the method is able to e xtract finer details fro m the m and in turn imp roves the quality of the image. In addition, wavelet analysis is capable of compressing or de-noising a signal without appreciable degradation. Wavelet analysis is of at most importance in case of delicate informat ion, such as in case of medica l imaging.
II.
IMPLIMENTED WORK
2.1 MR image to gr ay scale image:
MRI images are magnetic resonance images which can be acquired on co mputer when a patient is scanned by MRI mach ine. We can acquire MRI images of the part of the body which is under test or desired. Generally when we see MRI images on computer they looks like b lack and white images. In analog practice, gray scale imag ing is sometimes called "blac k and white," but technically th is is a misnomer. In true black and white, also known as halftone, the only possible shades are pure black and pure white. The illusion of gray shading in a halftone image is obtained by rendering the image as a grid of black dots on a white background (or vice versa), with the sizes of the indiv idual dots determining the apparent lightness of the gray in their vicin ity. The lightness of the gray is direct ly proportional to the number representing the brightness levels of the prima ry colors. Blac k is represented by R = G = B = 0 or R = G = B = 00000000, and white is represented by R = G = B = 255 or R = G = B = 11111111.
Grayscale is a range of shades of gray without apparent color. The darkest possible shade is black, which is the total absence of transmitted or reflected light. The lightest possible shade is white, the total transmission or reflection of light at all visible wavelengths. So because of the above reasons first we convert our MRI image to be pre-processed in grayscale image.
2.2 Image segmentation:
In image segmentation the level to which the subdivision of an image into its constituent regions or objects is carried depends on the problem being solved. In other words, when the object of focus is separated, image segmentation should stop the ma in goal of segmentation is to divide an image into parts having strong correlation with areas of interest in the image. In medica l imaging for analyzing anatomica l structures such as bones, muscles blood vessels, tissue types, pathological regions such as cancer, multip le sclerosis lesions and for divid ing an entire image into sub regions such as the white matter (WM), gray matter (GM) and cerebrospinal fluid (CSF) spaces of the brain automated delineation of different image components are used. In the field of medica l image processing segmentation of MR bra in image is significant as MRI is particula rly suitable fo r bra in studies because of its excellent contrast of soft issues, non invasive characteristic and a high spatial resolution Segmentation is the process of splitting an observed image into its homogeneous or constituent regions. The goal of segmentation is to simplify or change the representation of an image into something that is more mean ingful and easier to
analyze. It is important in many computer vision and image processing application.
Fuzzy C-means clustering is the overlapping clustering technique. One pixel va lue depending upon the two or more clusters centers. It is also known as soft clustering method. Most widely used the fuzzy clustering algorithms is the Fuzzy C-means (FCM ) algorith m. The FCM algorith m is the partition of the n element X={x1,...,xn } into a collection of the c fuzzy clustering with respect to the below given criteria. It is based on the minimizat ion of the following objective function:
(1)
Where, m = leve l of the fuzziness and real number greater than 1.
uij= degree of the me mbe rship of xi in the cluster cj x = data value
Fuzzy C-means is the popular method for med ical image segmentation but only consider the image intensity thereby producing unsatisfactory results in noisy images. A bunch of the algorithms are proposed to make the FCM robust against noise and in homogeneity but it’s still not perfect. fuzzy c -mean is slower than the K--means in effic iency but gives the accurate prediction of tumor cells which are not predicted by the K-means algorith m.
Origina l image Sku ll stripped image
White matter Gray matter
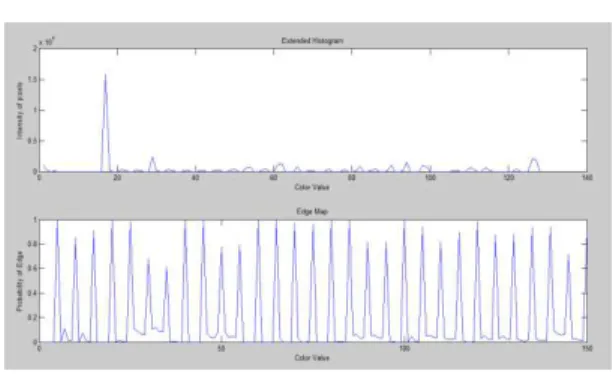
Fig: Extended Histogram and Edge map
2.3 Create database:
A database is an organized collect ion of data and here it’s a collection of images. The database is created using a number of images that are selected and divided into two groups that are healthy and disease image.
2.4 Fe ature extrac tion:
Te xture analysis makes differentiation of norma l and abnorma l tissue easy. It even provides contrast between ma lignant and norma l t issue, which may be below the threshold of human perception. Te xture analysis using computer aided diagnosis can be used to replace biopsy techniques and plays an important role in early d iagnosis and tracking of diseases.
The wavelet is a powerful mathemat ical tool for feature e xt raction, and has been used to e xtract the wavelet coefficients from MR images. Discrete Wavelet Transform is an imple mentation of the WT using the dyadic scales and positions.
Two dimensional DWT results in four sub bands LL (lo w-low), LH (low-high), HL (h igh-low), HH (high-h igh) at each scale. Sub band LL, is the approximation co mponent of the image, wh ich is used for ne xt t wo dimensional DWT. Whereas, LH, HL, HH are the detailed components of the image along the horizontal, vertica l and diagonal a xis, respectively, as shown in the figure :
Lo_D: low pass filter Hi_ D: high pass filter
- Down sampling columns: keeps the even indexed colu mns.
- Down sa mpling rows: keeps the even indexed rows.
2.4 Classification:
Classification is done using probabilistic neural network. Probabilistic Neura l Network (PNN) is a Rad ial Basis Neural Net work, which provides a general solution to pattern classification problems by following an approach developed in statistics, called Bayesian classifiers.
Fig: Arch itecture of a probabilistic neural network
A PNN is predominantly a c lassifier since it can map any input pattern to a number of classifications. The main advantages that discriminate PNN are, its fast training process, an inherently paralle l structure, guaranteed to converge to an optima l c lassifier as the size of the representative training set increases and training samples can be added or re moved without extens ive retrain ing.
Table: Co mparison of four diffe rent methods based on time required fo r the image p rocessing: Images Neural
network Algorithm
SVM Linear (Time in sec)
SVM Radial Basis (Time in sec)
SVM Quadratic (Time in sec)
Tumor %
1. 0.0573s 1.4350s 1.6368s 0.4680s 0.8001%
2. 0.0035s 0.1483s 0.5657s 0.5095s 2.032%
3. 0.0050s 0.1528s 0.5787s 0.5339s 1.1444%
4. 0.1178s 0.1528s 1.5465s 0.5393s 1.6780%
5. 0.0867s 1.1615s 1.0087s 0.4699s 0.8713%
6. 0.0374s 0.1424s 0.4937s 0.4622s 1.5935%
7. 0.0039s 0.1545s 0.5315s 0.4689s 1.3418%
8. 0.0040s 0.1439s 0.5119s 0.5073s 1.8031%
9. 0.0036s 0.1456s 0.4946s 0.4599s 1.5274%
10. 0.0040s 0.1444s 0.4965s 0.4665s 2.0335%
11. 0.0035s 0.1438s 0.5232s 0.4738s 1.5340%
12. 0.0035s 0.1487s 0.5099s 0.4625s 2.4760%
13. 0.0035s 0.1476s 0.6110s 0.5326s 1.5869%
14. 0.0047s 0.1471s 0.5136s 0.4611s 2.2949%
15. 0.0037s 0.1562s 0.5153s 0.4796s 1.5406%
16. 0.0036s 0.1416s 0.5275s 0.4639s 2.1851%
17. 0.0035s 0.1445s 0.5248s 0.4561s 0.2218%
18. 0.0044s 0.1423s 0.4995s 0.4730s 1.7431%
19. 0.0038s 0.1672s 0.4922s 0.4752s 1.5630%
20. 0.0037s 0.1438s 0.5139s 0.4666s 1.6469%
21. 0.0036s 0.1448s 0.5164s 0.4746s 0.6470%
22. 0.0035s 0.1425s 0.4978s 0.4629s 1.6713%
23. 0.0048s 0.1442s 0.5077s 0.4729s 1.3667%
24. 0.0035s 0.1587s 0.5056s 0.4892s 1.6795%
25. 0.0036s 0.1444s 0.5189s 0.4584s 0.1221%
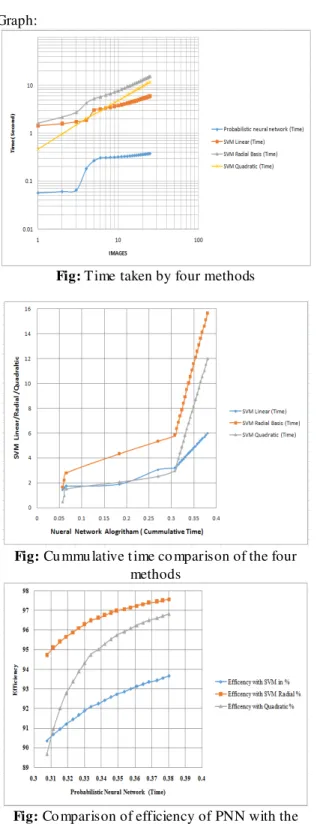
Graph:
Fig: Time taken by four methods
Fig: Cu mmu lative t ime co mparison of the four methods
Fig: Co mparison of efficiency of PNN with the other three methods
III.
FUTURE SCOPE
The goal is to detect, to segment, and to identify most types of pathological tissue that occur within pediatric bra in tu mors. Future research in the segmentation of medica l images will lead towards improving the accuracy, exactness, and computational speed of segmentation approaches, as well as min imizing the a mount of time ta ken for the process.
IV.
CONCLUSION
In this project fu zzy c-mean clustering algorith m is used for segmentation methods, classification of bra in tu mor and its feature e xtraction is done using probabilistic neural network algorith m. Many algorith ms have been proposed in the literature for each processing stage. So this method used gives the better result. The results are given and the graph showing the comparison in terms of t ime g iven by various methods that is neural network, SVM linear, SVM radial basis, SVM quadratic is given.
REFERENCES
[1]. Ahmed Kharrat, Nacéra Bena mrane, Abid Marie m “Detection of Brain Tumor Medical Images” International Conference on Signals, Circuits and Systems 2009.
[2]. Dr. M . Ka rnan, K. Selvanayaki “Improved Imple mentation of Bra in M R Image Segmentation Using Meta Heuristic Algorithms” 2: Research Scholar 978-1-4244-5967-4/10/$26.00 ©2010 IEEE.
[3]. P. Padilla, J. M. Gorriz, J. Ra mire z, R. Chaves “ Alzheimer’s disease detection in functional images using 2D Gabor Wavelet analysis” Electronics letter , vol. 46 no. 815th April 2010.
[4]. Sudipta Roy, Atanu Saha, Samir K. Bandyopadhyay “Brain tumor segmentation and quantification fro m M RI of brain” Journal of global research in computer science, volume 2, No. 4, April 2011.
[5]. Sudipta Roy, Samir K. Bandyopadhyay “Detection and Quantification of Bra in Tumor fro m M RI of brain and its Symmetric Analysis” International Journal of Information and Communication Technology Research Volu me 2 No. 6, June 2012.
[6]. Arati Kothari “Detection and classification of brain cancer using artificia l neural network in MRI image” World journal of science and technology 2012.
[7]. S. Karpaga m and S. Gowri “Brain Tumor Growth and Volu me Detection by Ellipsoid-Dia meter Technique Using MRI Data” IJCSI International Journal of Computer Science Issues, Vo l. 9, Issue 2, No 1, March 2012.
[8]. Pauline John “Brain Tumor Classification Using Wavelet and Texture Based Neural Network” International Journal of Scientific & Engineering Research Volume 3, Issue 10, October-2012.
Detection in MRI Images” IJCSI
International Journal of Computer Science Issues, Vol. 9, Issue 2, No 1, March 2012.
[10]. Smita Haribhau Zol “Analytical study of segmentation and quantification of bra in tumor and its importance in radiology” Vol. 1No.Jan 2012.
[11]. Snehalatha and Dr. Narendra Mustare “Computer Based Detection and Classification Technique for Brain Cancer”
International Journal of Research in Engineering and Technology (IJRET) Vol. 1, No. 5, 2012.
[12]. Prof. B. K. Saptala kar, Miss. Rajeshwari. H “Segmentation Based Detection of Brain Tumor” International Journal of Computer and Electronics Research [Volume 2, Issue 1, February 2013] .
[13]. Vive k Angoth, CYN Dwith, A marjot Singh “A Novel Wavelet Based Image Fusion for Brain Tumor Detection” International Journal of Computer Vision and Signal Processing, 2(1), 1-7(2013).
[14]. Kimmi Ve rma, Aru Mehrotra, Vijayeta Pandey, Shardendu Singh ”Image Processing Techniques For The Enhancement Of Bra in Tu mor Patterns”
International Journal of Advanced Research in Electrical, Electronics and Instrumentation Engineering Vol. 2, Issue 4, April 2013.
[15]. Jay Patel and Kaushal Doshi “A Study of Segmentation Methods for Detection of Tumor in Brain MRI” Advance in Electronic and Electric Engineering ,Volume 4, Number 3 (2014).
[16]. Tarun Kuma r Agarwa l, Mayank Tiwari, Subir Singh Lamba “Modified Histogram Based Contrast Enhancement using Ho mo morphic Filtering for Medical Images” IEEE International Advance Computing Conference (IACC) 2014.
[17]. Rohini Paul Joseph, C. Senthil Singh, M.Manikandan “Brain Tumor MRI Image Segmentation And Detection In Image Processing” IJRET International Journal of Research in Engineering and Technology Mar-2014.
[18]. Ed-Ed ily Mohd. Azhari, Muhd. Mudzakkir Mohd. Hatta, Zaw Za w Htike and Shoon Lei Win “Brain Tumor Detection And Localization In Magnetic Resonance Imaging” International Journal of Information Technology Convergence and Services (IJITCS) Vol.4, No.1, February 2014.
[19]. CH. Rambabu, B. Siva Ayyappa “Brain Tumor Classification Using Multi Wavelet
Transform and Neura l Network”
International Journal of Advanced Research in Computer Science and Software Engineering Volume 4, Issue 9, September 2014.