Abstract—This paper describes the development of a mechanical
fault diagnosis system for a scooter engine platform using continuous wavelet transform and artificial neural network techniques. Most of the conventional techniques for fault diagnosis in a mechanical system are based primarily on analyzing the difference of signal amplitude in the time domain or frequency spectrum. In the present study, a continuous wavelet transform (CWT) algorithm combined with a feature selection method is proposed for analyzing fault signals in a scooter fault diagnosis system. The artificial neural network technique using back-propagation and generalized regression are both used in the proposed system. The effectiveness of the proposed system using two algorithms in CWT technique for scooter fault diagnosis are investigated and compared. The experimental results indicated that the proposed system achieved a fault recognition rate over 95% in the experimental platform of scooter fault diagnosis system.
Index Terms—Fault diagnosis system, Continuous wavelet
transform, Artificial neural network.
I. INTRODUCTION
With the rapid growth of signal processing technology, the vibration and sound emission signals can be used to monitor the condition of a mechanical system. An effective condition monitoring can prevent serious damage. There exist a number of fault diagnosis techniques in the field, and most of the conventional techniques are used to observe the amplitude difference in time or frequency domain for damage diagnosis. Meanwhile, order-tracking analysis is also used to avoid the smearing problem in frequency-varying signals [1]. Unfortunately, most of the conventional approaches are difficult to deal with in the case where the machinery operates under non-stationary rotational speed, is based on the assumption of stationary signals, and is inherently unsuited for non-stationary. Time-frequency analysis can be used to improve the drawback of the Fourier transform. The primary
Manuscript received October 9, 2008. This work was supported the National Science Council of Taiwan, the Republic of China, under project number NSC-97-2221-E-018-008.
J.-D. Wu is with the Institute of Vehicle Engineering, National Changhua University of Education, Changhua 500, Taiwan (corresponding author phone: 886-4-7237078; e-mail: jdwu@cc.ncue.edu.tw).
E.-C. Chang, S.-Y. Liao, J.-M. Kuo, C.-K. Huang were with the Institute of Vehicle Engineering, National Changhua University of Education, Changhua 500, Taiwan.
advantage of time-frequency analysis is the representation of signals in both the time and frequency domains. The short time Fourier transform (STFT) has been applied to analyze the signals of the fault in both the time and frequency domains [2]. However, STFT has a limitation of time resolution because of using fixed time windows. On the other hand, the continuous wavelet transform with an adjustable window size has been proven to have higher efficiency in accurate information of analysis signals. The continuous wavelet transform (CWT) with more precise time resolution can improve the performance of STFT.
Research interest in mechanical fault diagnosis using wavelet analysis has developed in the last few decades. The wavelet analysis technique has become one of the important approaches in the field of mechanical fault diagnosis. In 1993, Wang and McFadden used wavelet analysis in the gear vibration signals and detected different types of faults, and the results exhibit wavelet transform is effective in condition monitoring of gear health [3],[4]. In 1995, Newland derived a harmonic wavelet technique and applied it to transient analysis of vibration signal [5],[6]. In 2001, Lin presented a de-noising method based on Morlet wavelet applied in fault diagnosis [7]. In 2004, Meltzer and Dien analyzed the effectiveness of the CWT in acoustical diagnostics of gearboxes by plotting wavelet amplitude versus the rotational angle in polar coordinates [8]. In 2005, Yan and Gao presented an approach to machine condition monitoring and health diagnosis, based on the discrete harmonic wavelet packet transform (DHWPT) [9]. In 2000, Li et al. presented an approach for motor rolling bearing fault diagnosis using neural networks and bearing vibration analysis [10]. In 2004, Chen and Mob developed a method of intelligent fault diagnosis using neural network classifier for identifying the faults of rotating machinery [11]. In 2005, Yang et al. developed an advanced signal classifier for small reciprocating refrigerator compressors artificial neural networks and support vector machine [12].
In the present study, the CWT technique and time-frequency analysis are used to extract the feature of the dynamic characteristics and fault signal from a scooter. The diagnostic trouble code of a scooter can be obtained by using spectrum trend feature method. A fault recognition technique based on neural networks of back-propagation and generalized regression for a scooter health diagnosis is presented. Neural networks classifiers have a proven ability in the area of nonlinear pattern recognition by learning and adapting to the input from the scooter fault. Both of the neural networks are
Faults Classification of a Scooter Engine
Platform Using Wavelet Transform and Artificial
Neural Network
used to verify the effectiveness of the presented fault diagnosis algorithm.
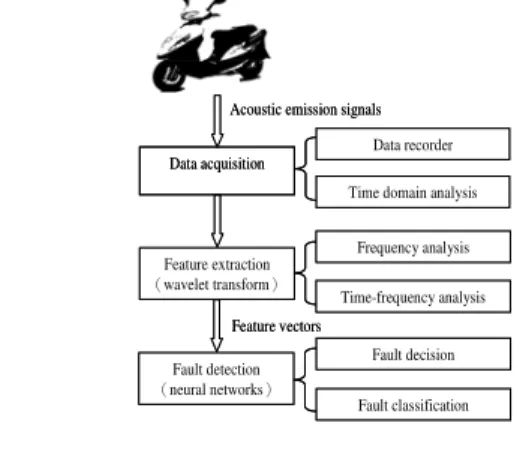
There are three phases in the present fault diagnosis system: the data acquisition phase, the feature extraction phase and the fault classification phase, as shown in Fig. 1. In the feature extraction, the diagnostic technique employs the wavelet transform to decompose the time-waveform signals into two respective parts in the time space and frequency domain and to obtain the feature of analysis signals. In the fault classification phase, the design of the neural network diagnosis algorithm is presented to identify the faults of the scooter. The principles of wavelet transform and neural network in the proposed system are described in the following sections.
II. FEATURE EXTRACTION USING WAVELET TRANSFORM
The wavelet transform uses a series of oscillating functions with different frequencies as window function to scan or translate the analysis signal. The wavelet technique has particular advantages for characterizing signals at different localization levels in time as well as frequency domains. The wavelet algorithm used in this study is based on the results originally developed by Goupillaud et al. [13],[7]. The principles of continuous wavelet transform and spectrum trend feature are described in the following sections.
Let be the basic wavelet function or mother wavelet, then corresponding family of daughter wavelets consist of
-1/ 2 ,
-( )
a b
t b
t
a
a
ψ
=
ψ
⎛
⎜
⎞
⎟
⎝
⎠
(1)where is the scale factor and the time location, and the factor is used ensure that the energy of the scaled and translated versions are the same as the mother wavelet. The wavelet transform of signal is defined as the inner product in the Hilbert space of the norm as follows:
-1/ 2 *
, ,
( , ) a b( ), ( ) ( ) a b
W a b =
ψ
t x t = a∫
x tψ
dt (2)Here the asterisk stands for complex conjugate. Time parameter
b and scale parameter a vary continuously. The mother wavelet is assumed to lie in and satisfies the admissibility condition:
2
-
ˆ
C =
ψ ∞ψ ω
( ) /
ω ω
d <
∞
∞
∫
(3)where is the space of square integrable complex function and indicates the Fourier transform of ( )ψ t . Wavelet coefficients measure the similarity of the signal and each daughter wavelet. In this study, the Morlet wavelet [14] is used as the basic wavelet for feature extraction. When a wavelet function is chosen, it is necessary to decide the scales in the wavelet transform. For CWT analysis, an arbitrary set of scales can be used to build up complete information. In this study, the scales are written as follows:
0
2
j j,
0, 1,
,
j
a
=
a
δj
=
…
J
(4)wherea0=2δt is the smallest resolvable scale and δ =j 0.05,
J=160. The choice of δj depend on the width in spectral space
of wavelet function and J determines the largest scale, δt is the sampling interval. When the sampling frequency is set as 10 kHz, the scales can be obtained in the range of 0.2 to 51.2.The continuous wavelet power spectrum is defined as 2
( j)
W a . The time-averaged wavelet spectrum is proposed to exhibit the distribution of energy of wavelet power spectrum in the direction of scale, is defined as
2 -1
0
1
(
)
(
)
N
j n j
n
W a
W a
N
==
∑
(5)where is the number of sampling points, . In the application of fault diagnosis, the signal is sampled randomly and the revolution of the engine is not stable, the energy distribution of time average wavelet spectrum (TAWS) is different from each other even in the same fault condition. In order to avoid such a condition, a spectrum trend feature method is developed. By studying the spectrum distribution of variation for each fault spectrum, one can define a raised trend of spectrum as “1” and a dropped trend of spectrum as “0” between two neighbor scales. The feature vector can be defined as follows:
( ) ( )
( )
( )
+1
+1
1, > x(j)=
0,
j j
j j
W a W a
W a W a
⎧⎪ ⎨
≤
⎪⎩ (6)
The feature vector is diagnostic trouble code as the input for the fault classification using neural networks.
Data acquisition
Feature extraction wavelet transform
Fault detection neural networks
Acoustic emission signals
Feature vectors
Time-frequency analysis Frequency analysis
Data recorder
Time domain analysis
Fault classification Fault decision Data acquisition
Feature extraction wavelet transform
Fault detection neural networks
Acoustic emission signals
Feature vectors
Time-frequency analysis Frequency analysis
Data recorder
Time domain analysis
Fault classification Fault decision
Figure 1 Procedure of scooter fault diagnosis. III. FAULTS CLASSIFICATION USING NEURAL NETWORKS
In the design of scooter fault diagnosis schemes, a recognition method of scooter fault condition using neural networks is investigated to evaluate the effectiveness of the select feature set for a scooter diagnosis. To determine if the proposed fault diagnosis algorithm is able to correctly recognize different scooter fault conditions is essential. In this paper, a multiplayer perception classifier trained with error back-propagation algorithm and generalized regression neural network are used in the fault diagnosis system. The ( )t
ψ
a -1/ 2
a
( )
x t
2
L
( )t
ψ 2
( )
L C
2
( )
L C
ˆ ( ) ψ ω
N j = 0, 1, 2, , … J
0, 1, 2, , -1
j = … J
experimental comparison and analysis of the two algorithms are also described in scooter fault diagnosis.
The neural network using a multiplayer perception classifier with error back propagation (BP) algorithm based on supervised learning rule is applied for training and testing the classifier in the present study [16]. A three-layer feed forward network with sigmoid activation function is considered in the first fault classification. In the structure, each layer has a certain number of nodes and all nodes in one layer are connected with all the other nodes in the succeeding layer, as shown in Fig. 2. Associated with each connection, a numerical value is assigned, which is termed as weight. Inputs are submitted during the BP algorithm training sequentially. During the training procedure, the weight and biases of the network are iteratively adjusted to minimize the network performance which is the mean square error between the networks outputs and desired outputs. The gradient descent search is performed to reduce the error through the adjustment of weights. The error is back propagated to change the output and hidden layer weights. This training process is repeated until a suitable error is achieved. The training process needs a set of training examples to update the weights of the network. Providing sufficient training data is essential in order to ensure accuracy of the classifier. Once the network is sufficiently trained, the knowledge of the neural network will perform the fault detection.
Network Training
Network Testing
Fault Decision Feature Extraction
1
2 1
2
3
j 1
l n
Diagnostic Trouble Code
Error signals Input signals
1
y 1
x
2
x
n
x yl
w w
Network Training
Network Testing
Fault Decision Feature Extraction
1
2 1
2
3
j 1
l n
Diagnostic Trouble Code
Error signals Input signals
1
y 1
x
2
x
n
x yl
w w
Figure 2 Structure of back-propagation algorithm for fault diagnosis.
The generalized regression neural network (GRNN) was proposed by Specht [16]. It is a one-passing learning algorithm which can be used for estimation of continuous variables. The GRNN does not require an iterative training procedure to converge to the desired solution as in BP neural network. It approximates any arbitrary function between input and output vectors, drawing the function estimate directly from the training data. If the variables to be estimated relate output to input variables, the GRNN can be used to model the system, as in standard regression techniques. By definition, the regression of a dependent variable y on an independent x estimates the most probable value for y, given x and a training set. The GRNN is a method for estimating the joint probability density function (PDF) of x and y, in order to produce the estimated
value of y, given only a training set. Assume that thef x y( , ) represents the known joint continuous probability density function of a vector random variables, x, and a scalar random variable. Let X be a particular measured value of the random variable x. The conditional mean of y given X is given by
-( , )d =
( , )d
yf X y y E y X
f X y y
∞ ∞ ∞ ∞
⎡ ⎤
⎣ ⎦
∫
∫
(7)When the density is not known, it must usually be
estimated from a sample of observations of and . The
probability estimator is based upon sample values and of the random variables x and y, where is the
number of sample observations and is the dimension of the vector variable x:
(
) (
)
(
)
(P+1)/2 (P+1)
T 2
i i i
n
2 2
i=1
1 1
ˆ ( , )=
(2 ) n
X-X X-X Y-Y
exp - exp
-2 2
f X Y
π σ
σ σ
⎡ ⎤ ⎡ ⎤
⎢ ⎥ ⎢ ⎥
×
⎢ ⎥ ⎢ ⎥
⎣ ⎦ ⎣ ⎦
∑
(8)A physical interpretation of the probability estimate is that it assigns sample probability of width σ for each sample
i
X and i
Y , and the probability estimate is the sum of those sample probabilities. Defining the scalar function
(
) (
T)
2 i i
i
D = X-X X-X (9)
and performing the indicated integrations yields the following:
2 n
2 i=1
2 n
2 i=1
exp -2 ˆ( )=
exp -2
i i
i
D Y
Y X
D σ
σ
⎡ ⎤
⎢ ⎥
⎣ ⎦
⎡ ⎤
⎢ ⎥
⎣ ⎦
∑
∑
(10)When the smoothing parameter σ is made large, the estimated density is forced to be smooth and in the limit becomes a multivariate Gaussian with covariance 2
I
σ . On the other hand, a smaller value of allows the estimated density to assume non-Gaussian shapes, but with the hazard that wild points may have too great an effect on the estimate [14]. Fig. 3 shows the block diagram of the GRNN architecture which is different from the architecture of BP algorithm. The GRNN consists of four layers: input layer, pattern layer, summation layer and output layer. The input units are merely distribution units in the first layer. The second layer has the pattern units that are dedicated to one cluster center. The outputs of the pattern layer are passed on to the summation units in the third layer. The summation units perform a dot product between a weight and a vector from the pattern layer. The final layer covers the output units.
( , )
f x y
x
y
( , )
f X Y
i
X i
Y
n
p
ˆ ( , )
n x
1 x
2 x
Input layer
Pattern layer
Output layer Summation layer
ˆ Y(X)
n x
1 x
2 x
Input layer
Pattern layer
Output layer Summation layer
ˆ Y(X)
Figure 3 Block diagram of GRNN algorithm.
IV. EXPERIMENTAL INVESTIGATION OF FAULTS
CLASSIFICATION
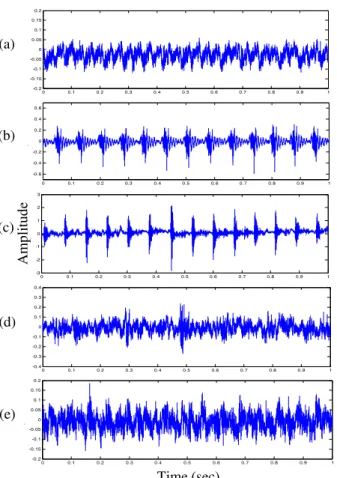
In order to evaluate the proposed algorithms in faults classification, an experiment is carried out to verify the performance by measuring sound emission signals in various engine operation conditions. The sound emission signal of a scooter engine platform is measured by a microphone, a data acquisition system and subsequently analyzed using CWT algorithm. After extracting the features of wavelet power spectra, the feature vectors are selected for the fault classification using neural networks. The experimental setup of the scooter fault diagnosis system is shown in Fig. 4. The measuring apparatus used in the experiment consists of a microphone (PCB 130D20), a data acquisition system (NI-6024E), an optical encoder (PW-PH02) for shaft speed measurement and dynamic signal analyzer (SR785). The sound signal is recorded from the scooter under without fault condition and four different fault conditions in five fixed engine revolutions and a run-up engine operation condition. The experiment is conducted by using four synthetic faults, including leaking of the intake manifold, pulley damaged, belt damaged and clutch damaged. The sampling rate of the data acquisition system is 10 kHz. Acoustic emission signals in time domain that were measured under idle conditions (1800 rpm) are shown in Fig. 5.
Mic.
Data acquisition system
Dynamic signal analyzer Fiber optical sensor
Fault diagnosis system
Tachometer signal Acoustic emission signal Mic.
Data acquisition system
Dynamic signal analyzer Fiber optical sensor
Fault diagnosis system
Tachometer signal Acoustic emission signalAcoustic emission signal
Data acquisition system
Fiber optical sensor
Dynamic signal analyzer
Tachometer signal
Fault diagnosis system Mic.
Figure 4 Experimental arrangement of scooter fault diagnosis system.
0 0.1 0.2 0.3 0.4 0.5 0.6 0.7 0.8 0.9 1
-0.2 -0.15 -0.1 -0.05 0 0.05 0.1 0.15 0.2
0 0.1 0.2 0.3 0.4 0.5 0.6 0.7 0.8 0.9 1
-0.6 -0.4 -0.2 0 0.2 0.4 0.6
p
0 0.1 0.2 0.3 0.4 0.5 0.6 0.7 0.8 0.9 1
-3 -2 -1 0 1 2 3
p
0 0.1 0.2 0.3 0.4 0.5 0.6 0.7 0.8 0.9 1
-0.4 -0.3 -0.2 -0.1 0 0.1 0.2 0.3 0.4
0 0.1 0.2 0.3 0.4 0.5 0.6 0.7 0.8 0.9 1
-0.2 -0.15 -0.1 -0.05 0 0.05 0.1 0.15 0.2
p
Figure 5 Sound emission signals measured from a scooter. (a) without fault; (b) leakage in intake manifold; (c) pulley damaged; (d) belt damaged; (e) clutch
damaged.
In order to evaluate the effectiveness of the CWT for scooter fault diagnosis, sound emission signals from each fault condition are analyzed. The experimental results of scooter without fault in 1800rpm engine speeds using CWT representation are shown in Fig. 6, which present the energy distribution of the sound emission signals in time-frequency domain. The experimental results of the other four faults in 1800rpm engine speeds are indicated in Fig. 7. However, an engine in practical conditions may be operated by running up or coasting down. In the experiment of running up investigation, the engine operated at revolutions from 1800 to 4900 rpm. The experiment results of run-up rotational speed condition using CWT algorithm are indicated in Fig. 8. On the basis of the time-frequency features thus obtained, the transients of the run-up process can be clearly observed. The experimental results demonstrated the CWT algorithm is effective in fault analysis and diagnosis by using sound emission signals.
Figure 6 Time-frequency representation of wavelet power spectrum without fault in 1800 rpm engine speeds.
Time (sec)
Am
pl
it
ude
(c) (a)
(b)
(d)
(e)
Am
p
litud
e
Time (sec)
Freq
u
ency
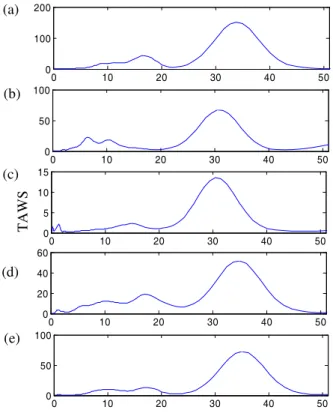
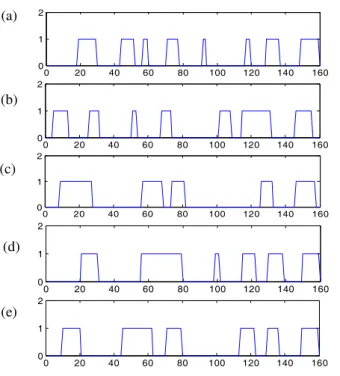
To further classify the fault, the feature extraction of TAWS based on spectrum trend feature method is presented. Figure 9 represents the TAWS of five conditions of engine in idle operation. After processing of spectrum trend feature method, the feature vectors, shown in Fig. 10, are diagnostic trouble codes which will be provided for the neural network. The objective of faults classification is to demonstrate the effectiveness of the proposed feature selected method. For this purpose, the feature vectors in each fault condition are applied to as the input of the neural networks. There are 200 data sets for each fault condition. In the fault classification experiment, 40 data sets of the data in each fault condition are used for training the network and the remaining 160 data sets of the data are used to test the network. The performance of the fault diagnosis system to correctly classify the faults to corresponding classes is evaluated. The fault recognition rate is defined as
Number of correctly classified samples
Recognition rate = 100%
Total testing number of samples × (11)
Figure 7 Time-frequency representation of wavelet power spectrum withvarious fault in 1800 rpm engine
speeds. (a) leakage in intake manifold; (b) pulley damaged; (c) belt damaged; (d) clutch damaged.
Figure 8 Time-frequency representation of wavelet power spectrum without fault in run-up condition.
0 10 20 30 40 50 0
100 200
0 10 20 30 40 50 0
50 100
0 10 20 30 40 50 0
5 10 15
0 10 20 30 40 50 0
20 40 60
0 10 20 30 40 50 0
50 100
Figure 9 TAWS of engine in idle condition. (a) Without fault; (b) leakage of the intake manifold; (c) pulley damaged; (d) belt damaged; (e) clutch damaged. Table 1 shows the classification accuracy achieved is about 95 % by using BP algorithm. In comparison, Table 2 shows the result of GRNN classifier has achieved an overall classification rate of 99 % in engine operation lower than 2500 rpm. When the engine operation speed is higher than 2500 rpm, the fault recognition rate is decreased. The comparison indicated that the fault technique using GRNN is more effective than using BP algorithm in the faults classification.
Table.1 Performance of the recognition using BP algorithm
Revolution conditions (rpm) Defect types
idle 2000 2500 3000 3500
Without fault 99.4% 99.4% 99.4% 99.4% 85%
Leakage of the
intake manifold 99.4% 99.4% 99.4% 99.4% 99.5%
Pulley damaged 96.3% 96.9% 98.8% 93.1% 95.6%
Belt damaged 97.5% 99.4% 99.4% 88.8% 98.8%
Clutch damaged 99.4% 93.8% 98.8% 98.8% 85.6%
Table.2 Performance of the recognition using GRNN
Revolution conditions (rpm) Defect types
idle 2000 2500 3000 3500
Without fault 100% 100% 100% 100% 100%
Leakage of the
intake manifold 99.4% 99.4% 99.4% 99.4% 99.4%
Pulley damaged 99.4% 99.4% 99.4% 99.4% 98.8%
Belt damaged 99.4% 99.4% 99.4% 92.5% 98.8%
Clutch damaged 99.4% 99.4% 99.4% 99.4% 99.4%
Time (sec)
Freq
u
ency
(Hz)
(c) (a)
(b)
(d)
Time (sec)
Freq
u
ency
(Hz)
TA
WS
Scale (c)
(a)
(b)
(d)
0 20 40 60 80 100 120 140 160 0
1 2
0 20 40 60 80 100 120 140 160 0
1 2
0 20 40 60 80 100 120 140 160 0
1 2
0 20 40 60 80 100 120 140 160
0 1 2
0 20 40 60 80 100 120 140 160
0 1 2
Fig. 10. Feature vectors of engine in idle condition. (a) Without fault; (b) leakage of the intake manifold; (c) pulley damaged; (d) belt damaged; (e) clutch damaged.
V. CONCLUSIONS
In this paper, a scooter fault diagnosis system based on continuous wavelet transform technique and faults classification using artificial neural network for the purpose of the fault detection has been developed. Wavelet analysis, which allows the sound emission signals of frequency content with time to be visualized, can extract key features using time-frequency representation of sound emission signals from a scooter. A feature selection method called “spectrum trend feature method” was proposed. The selected feature vectors are diagnostic trouble codes corresponding to their fault condition. The features are subsequently used for the intelligent classifier to evaluate the performance of proposed fault diagnosis system. The proposed diagnosis system using GRNN method was able to reach a fault recognition rate of about 99%. The experimental results show that the proposed fault diagnosis system with neural network can be effectively used in scooter diagnosis of various faults through measurement of scooter sound emission signal.
ACKNOWLEDGMENTS
This study was supported by the National Science Council of Taiwan, the Republic of China, under project number NSC-97-2221-E-018-008.
REFERENCES
[1] Bai, M. R., Jeng J., & Chen, C. (2002). Adaptive order tracking
technique using recursive least-square algorithm. American of Mechanical Engineers, Journal of Vibration and Acoustics, 124(4), 502–511.
[2] Klein, R., Ingman, D., & Braun S. (2001). Non-stationary signals:
phase-energy and simulations. Mechanical Systems and Signal Processing, 15(6), 1061–1089.
[3] Wang, W. J., & McFadden, P. D. (1996). Application of the wavelet
transform to gearbox vibration signals for fault detection. Journal of Sound and Vibration, 192, 927–939.
[4] Wang, W. J., & McFadden, P. D. (1995). Application of orthogonal
wavelets to early gear damage detection. Mechanical Systems and Signal Processing, 9, 497–507.
[5] Newland, D. E. (1995). Progress in the application of wavelet theory to
vibration analysis. Proceedings of ASME 15th Biennial Conference on Mechanical Vibration and Noise, Boston, 3, 1313–1322.
[6] Newland, D. E. (1999). Ridge and phase identification in the frequency
of transient signals by harmonic wavelets. American of Mechanical Engineers, Journal of Vibration and Acoustics, 121, 149–155.
[7] Lin, J. (2001). Feature extraction of machine sound using wavelet and
its application in fault diagnosis. NDT & E International, 34(1), 25–30.
[8] Meltzera, G., & Dien, N. P. (2004). Fault diagnosis in gears operating under non-stationary rotational speed using polar wavelet amplitude maps. Mechanical Systems and Signal Processing, 18, 985–992.
[9] Yan, R., & Gao, R. X. (2005). An efficient approach to machine
diagnosis based on harmonic wavelet packet transform. Robotics and Computer-Integrated Manufacturing, 21, 291–301.
[10] Li, B., Chow, M. Y., Tipsuwan, Y., & Hung, J. C. (2000). Neural-network-based motor rolling bearing fault diagnosis. IEEE Transactions on Industrial Electronics, 47(5), 1060–1069.
[11] Chen, C., & Mob, C. (2004). A method for intelligent fault diagnosis of rotating machinery. Digital Signal Processing, 14, 203–217.
[12] Yang, B. S., Hwang, W. W., Kim, D. J., & Tan, A. C. (2005). Condition classification of small reciprocating compressor for refrigerators using artificial neural networks and support vector machines. Mechanical Systems and Signal Processing, 19, 371–390.
[13] Goupillaud, P., Grossmann, A., & Morlet, J. (1984). Cycle-octave and related transforms in seismic signal analysis. Geoexploration, 23, 85–102.
[14] Lin, J., & Qu, L. (2000). Feature extraction based on morlet wavelet and its application for mechanical fault diagnosis. Journal of Sound and Vibration, 234(1), 135–148.
[15] Zheng, H., Li, Z., & Chen, X. (2002). Gear fault diagnosis based on continuous wavelet transform. Mechanical Systems and Signal Processing, 16, 447–457.
[16] Haykin, S. (1999). Neural networks a comprehensive foundation. Macmillan College Publishing Company, New York.
(a)
(b)
(c)
(d)
(e)