Submitted12 January 2016 Accepted 18 March 2016 Published18 April 2016
Corresponding authors Elizabeth Trembath-Reichert, [email protected]
Victoria J. Orphan, [email protected]
Academic editor
Mauricio Rodriguez-Lanetty
Additional Information and Declarations can be found on page 23
DOI10.7717/peerj.1913
Copyright
2016 Trembath-Reichert et al.
Distributed under
Creative Commons CC-BY 4.0
OPEN ACCESS
Characterization of microbial associations
with methanotrophic archaea and
sulfate-reducing bacteria through
statistical comparison of nested
Magneto-FISH enrichments
Elizabeth Trembath-Reichert, David H. Case and Victoria J. Orphan
Department of Geological and Planetary Sciences, California Institute of Technology, Pasadena, CA, United States
ABSTRACT
Methane seep systems along continental margins host diverse and dynamic microbial assemblages, sustained in large part through the microbially mediated process of sulfate-coupled Anaerobic Oxidation of Methane (AOM). This methanotrophic metabolism has been linked to consortia of anaerobic methane-oxidizing archaea (ANME) and sulfate-reducing bacteria (SRB). These two groups are the focus of numerous studies; however, less is known about the wide diversity of other seep associated microorganisms. We selected a hierarchical set of FISH probes targeting a
range ofDeltaproteobacteriadiversity. Using the Magneto-FISH enrichment technique,
we then magnetically captured CARD-FISH hybridized cells and their physically associated microorganisms from a methane seep sediment incubation. DNA from nested Magneto-FISH experiments was analyzed using Illumina tag 16S rRNA gene sequencing (iTag). Enrichment success and potential bias with iTag was evaluated in the context of full-length 16S rRNA gene clone libraries, CARD-FISH, functional gene clone libraries, and iTag mock communities. We determined commonly used Earth Microbiome Project (EMP) iTAG primers introduced bias in some common methane seep microbial taxa that reduced the ability to directly compare OTU relative abundances within a sample, but comparison of relative abundances between samples (in nearly all cases) and whole community-based analyses were robust. The iTag dataset was subjected to statistical co-occurrence measures of the most abundant OTUs to determine which taxa in this dataset were most correlated across all samples. Many non-canonical microbial partnerships were statistically significant in our co-occurrence network analysis, most of which were not recovered with conventional clone library sequencing, demonstrating the utility of combining Magneto-FISH and iTag sequencing methods for hypothesis generation of associations within complex microbial communities. Network analysis pointed to many co-occurrences containing
putatively heterotrophic, candidate phyla such as OD1, Atribacteria, MBG-B, and
Hyd24-12 and the potential for complex sulfur cycling involvingEpsilon-,Delta-, and
Gammaproteobacteriain methane seep ecosystems.
SubjectsBioinformatics, Ecology, Marine Biology, Microbiology, Statistics
Keywords Magneto-FISH, Co-occurrence network, Earth microbiome project, iTag sequencing, Anaerobic oxidation of methane, Microbial association, Microbial ecology
INTRODUCTION
A central goal in microbial ecology is identifying and understanding microbial interactions in the environment. This goal can be addressed at many scales from statistical analyses
of entire ecosystems (Barberán et al., 2012;Malfatti & Azam, 2010;Ruff et al., 2015;Steele
et al., 2011;Sunagawa et al., 2015) to high resolution image analysis of specific symbioses (Malfatti & Azam, 2010;McGlynn et al., 2015;Orphan, 2009;Orphan et al., 2001b;Wegener et al., 2015). Previous studies have shown that complex datasets can be distilled to determine primary ecosystem drivers, such as temperature, as main predictors of community
variability (Sunagawa et al., 2015). In addition to correlating microbial patterns to
environmental factors, interspecies interactions can be evaluated with methods such
as co-occurrence analysis (Friedman & Alm, 2012). Statistical significance of co-occurrence
can be assessed at scales ranging from the entire genome to the operational taxonomic unit
(OTU) (Barberán et al., 2012;Chaffron et al., 2010).
Many physical separation methods have been developed to partition complex microbial
assemblages before analysis, including fluorescence-activated flow sorting (Amann et al.,
1990;Yilmaz et al., 2010), optical trapping (Ashkin, 1997), microfluidics (Melin & Quake,
2007), and immunomagnetic beads (Pernthaler et al., 2008;Šafařík & Šafaříková, 1999)
that use characteristics of interest such as phylogenetic identity (Fluorescence In Situ
Hybridization; FISH) or activity (Hatzenpichler & Orphan, 2015;Hatzenpichler et al., 2014;
Kalyuzhnaya, Lidstrom & Chistoserdova, 2008;Wegener et al., 2012;Berry et al., 2015). Here we combine Magneto-FISH and Illumina Tag (iTag) sequencing utilizing the Earth
Microbiome Project (EMP) universal primer set (Caporaso et al., 2012). The Magneto-FISH
method was originally developed to enrich for and characterize multi-species microbial
associations in environmental samples (Pernthaler et al., 2008). This method consists of
a liquid CARD (CAtalyzed Reporter Deposition)-FISH reaction as a 16S rRNA gene identity-based selection mechanism followed by an immunomagnetic sediment matrix separation mechanism to target specific phylogenetic groups in conjunction with their physically associated microbial partners. By combining this method for phylogenetically targeted physical separation with high throughput amplicon sequencing, we can compare an array of associated microbial communities in parallel, with replicates. This provides statistical power in deriving microbial associations from complex sediment community assemblages, and thereby improving hypothesis development.
Anaerobic methane-oxidizing (ANME) archaea and sulfate-reducingDeltaproteobacteria
(SRB) are the predominant community members discussed in methane seep literature and form syntrophic partnerships in physical associations, termed ‘‘aggregates’’ or consortia (Boetius et al., 2000;Green-Saxena et al., 2014;Knittel et al., 2003; Orphan et al., 2001a;
Schreiber et al., 2010). Since physical association appears to be an important element for
consortia activity (McGlynn et al., 2015;Wegener et al., 2015), methods like Magneto-FISH
are ideal for probing this system because target organisms are separated from the sediment matrix along with their physically associated partners. A hierarchical probe set was chosen
targeting Deltaproteobacteriaand their ANME partners to create nested Magneto-FISH
enrichments from methane seep sediment incubations under methane headspace. This
method allows us to examine potential physical associations between ANME and SRB taxa and other microorganisms using co-occurrence statistical methods applied to iTag sequences from nested Magneto-FISH enrichments.
ANME have been broadly divided into three separate groups, which can be further subdivided into ANME-1a, 1b, 2a, 2b, 2c, and 2d, and 3. ANME-1 archaea are a
unique order-level lineage within theEuryarchaeota, between theMethanomicrobiales
and the Methanosarcinales, known to associate with sulfate-reducing bacteria, but
obligately associated lineages have yet to be defined. ANME-2 archaea, within the order
Methanosarcinales, commonly form associations withDesulfosarcina/Desulfococcus-related
(DSS) sulfate-reducing Deltaproteobacteria (Boetius et al., 2000; Orphan et al., 2001a;
Schreiber et al., 2010). They have also been found in association withDesulfobulbus-related
(DSB) Deltaproteobacteriain the same environments, where geochemical factors have
been suggested as a possible explanation for partner differentiation (Green-Saxena et
al., 2014). ANME-2a/b and ANME-2c both predominately associate with a subgroup
of DSS, SEEP-SRB1 (Schreiber et al., 2010), but also form consortia with DSB (
Green-Saxena et al., 2014;Pernthaler et al., 2008). ANME-3 has been found in association with
Desulfobulbus-relatedDeltaproteobacteria(Niemann et al., 2006) and SEEP-SRB1 (Schreiber et al., 2010). These ANME groups have also been observed in the environment without
bacterial partners (House et al., 2009;Orphan et al., 2002;Schreiber et al., 2010;Treude et
al., 2007). In addition to ANME archaea, other uncultured archaeal lineages commonly
recovered from methane seeps include Marine Benthic Group-D (Thermoplasmatales),
Deep Sea Archaeal Group/Marine Benthic Group-B (Ruff et al., 2015;Yanagawa et al.,
2011), and sometimes methanogens (Orphan et al., 2001a;Ruff et al., 2015;Takano et al.,
2013;Vigneron et al., 2015).
Deltaproteobacteria diversity beyond DSS and DSB has also been well described
in methane seeps. In addition to SEEP-SRB1, Knittel et al. (2003)define three more
Deltaproteobacteriaclades withinDesulfobulbaceae(SEEP-SRB2, 3 and 4).Green-Saxena et al. (2014) also described a Desulfobulbaceae affiliated seepDBB group in methane seep systems. Bacterial diversity surveys of methane seep habitats frequently report
occurrence of other diverseProteobacteriaincluding sulfur oxidizers (Gammaproteobacteria
and Epsilonproteobacteria) and putative heterotrophs (Alphaproteobacteria and
Betaproteobacteria) (Pernthaler et al., 2008;Ravenschlag et al., 1999). Many other bacterial
phyla have also been found such asFirmicutes,Thermomicrobia,Bacteroidetes,Chlorobi,
Nitrospira, WS3, OD1, OP11, TM7, and WS6 (Schreiber et al., 2010); Cytophaga
and Flavobacteria(Knittel et al., 2003);Chloroflexi, Atribacteria(previously Candidate
Division JS1), CD12, WS1, OS-K, AC1, and Planctomycetes(Yanagawa et al., 2011); and
Acidobacteria (Ravenschlag et al., 1999). Ruff et al. (2015) identifiedMethanomicrobia,
Deltaproteobacteria, Hyd24-12 and Atribacteria (JS1) as the characteristic ‘core’ microbial
taxa in methane seep ecosystems, as compared to Gammaproteobacteria,Flavobacteria,
Thermoplasmatales, and MBG-B taxa that were found in high relative abundance in seeps and other marine ecosystems.
Despite the wealth of bacterial and archaeal diversity in methane seep sediments, little is known about potential associations with ANME/SRB, or associations that do not involve
ANME or SRB. Our study utilizes the novel combination of targeted Magneto-FISH enrichment of specific microbial taxonomic groups and iTag sequencing to develop statistically supported co-occurrence microbial networks to address knowledge gaps in our understanding of methane seep microbial communities. Network analysis revealed many
novel associations between methane seepProteobacteriataxa and Candidate phyla. The
significant co-occurrence observed by these OTUs suggests new avenues for future studies on microbial interactions involved in carbon and sulfur cycling in methane seep systems.
MATERIALS & METHODS
Sample collection and Magneto-FISH
iTag Magneto-FISH enrichments were conducted using a large scale (1 L) incubation of methane seep sediment from Hydrate Ridge North (offshore Oregon, USA) collected
in September 2011 at 44◦
40.02′
N 125◦
6.00′
W, from a water depth of 775 m using the ROVJASON II and the R/VAtlantis. Marine sediment was collected using a push core to sample a sulfide-oxidizing microbial mat adjacent to an actively bubbling methane vent. A sediment slurry from the upper 0–15 cm depth horizon of the push core was prepared
with 1 volume N2sparged artificial seawater to 1 volume sediment, overpressurized with
methane (3 bar) and incubated at 8◦
C in a 1 L Pyrex bottle capped with a butyl rubber stopper until subsampling for Magneto-FISH.
In February 2015, incubation samples were immediately fixed in 0.5 ml sediment
aliquots in 2% paraformaldehyde (PFA) for 3 h at 4 ◦
C. The samples were washed in 50% phosphate-buffered saline (PBS): 50% EtOH, then 75% EtOH: 25% DI water, and
resuspended in 2 volumes (1 ml) 100% ethanol. Samples were centrifuged at 1,000×g
for 1 min between wash steps. After fixation, the Magneto-FISH method first described byPernthaler et al. (2008)and further optimized bySchattenhofer & Wendeberg (2011)and
Trembath-Reichert, Green-Saxena & Orphan (2013)was used. Briefly, a liquid CARD-FISH reaction was followed by immunomagnetic bead incubation coupled with anti-fluorescein attaching magnetic beads to CARD-FISH hybridized aggregates. Samples were then held against magnets and the sediment matrix was washed away, retaining target cells
and physically associated microbes in the magnetic portion as described in
Trembath-Reichert, Green-Saxena & Orphan (2013). Four previously published FISH probes were
used targeting a range ofDeltaproteobacteriaandMethanomicrobia(Table 1). A subset of
three 0.5 ml aliquots was also immediately frozen before fixation (unfixed bulk sediment), and another three aliquots were frozen after fixation (fixed bulk sediment) for bulk sediment comparison with Magneto-FISH enrichments. Sediment for MSMX-Eel_932 Magneto-FISH metabolic gene analysis was fixed and washed onboard in September 2011,
as described above. See methods flow chart provided inFig. S1.
iTag amplification
For iTag sequencing, ten Magneto-FISH enrichments were performed in parallel using the FISH probes DSS_658 (triplicate), MSMX-Eel_932 (triplicate), SEEP-1a_1441 (duplicate),
Delta_495a + Delta_495a competitor (duplicate). Magneto-FISH enrichments and
bulk sediment samples were resuspended in 650 µl solution PM1 and transferred
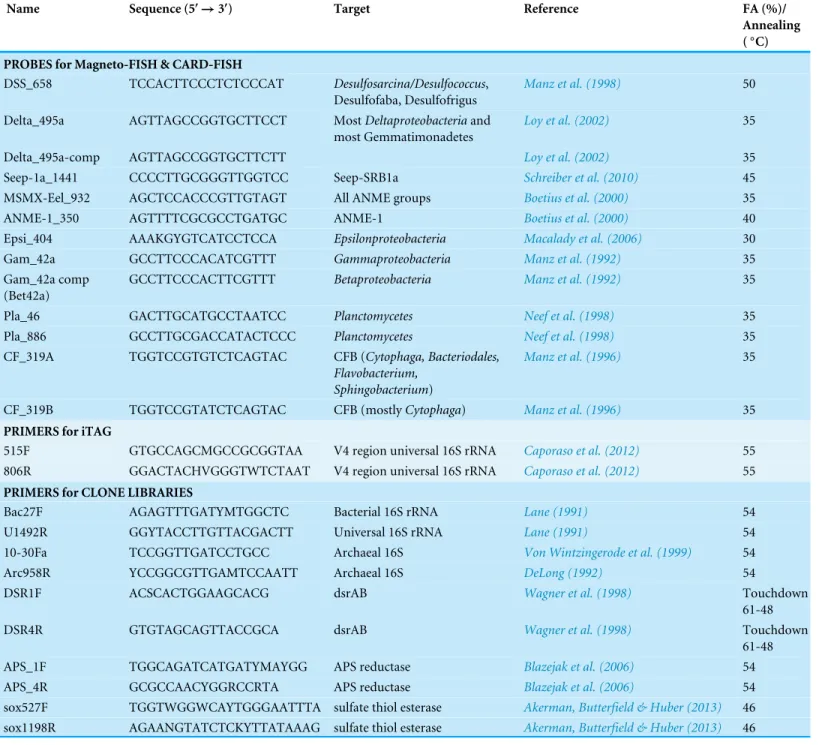
Table 1 FISH probes and PCR primers used in this studys.FISH probes for Magneto-FISH and CARD-FISH and PCR primers for iTag and Clone gene libraries with oligonucleotide sequence, target organisms, references, and formamide concentration (FISH) or annealing temperature (PCR).
Name Sequence (5′
→3′) Target Reference FA (%)/
Annealing (◦C)
PROBES for Magneto-FISH & CARD-FISH
DSS_658 TCCACTTCCCTCTCCCAT Desulfosarcina/Desulfococcus, Desulfofaba, Desulfofrigus
Manz et al. (1998) 50
Delta_495a AGTTAGCCGGTGCTTCCT MostDeltaproteobacteriaand most Gemmatimonadetes
Loy et al. (2002) 35
Delta_495a-comp AGTTAGCCGGTGCTTCTT Loy et al. (2002) 35
Seep-1a_1441 CCCCTTGCGGGTTGGTCC Seep-SRB1a Schreiber et al. (2010) 45
MSMX-Eel_932 AGCTCCACCCGTTGTAGT All ANME groups Boetius et al. (2000) 35
ANME-1_350 AGTTTTCGCGCCTGATGC ANME-1 Boetius et al. (2000) 40
Epsi_404 AAAKGYGTCATCCTCCA Epsilonproteobacteria Macalady et al. (2006) 30
Gam_42a GCCTTCCCACATCGTTT Gammaproteobacteria Manz et al. (1992) 35
Gam_42a comp (Bet42a)
GCCTTCCCACTTCGTTT Betaproteobacteria Manz et al. (1992) 35
Pla_46 GACTTGCATGCCTAATCC Planctomycetes Neef et al. (1998) 35
Pla_886 GCCTTGCGACCATACTCCC Planctomycetes Neef et al. (1998) 35
CF_319A TGGTCCGTGTCTCAGTAC CFB (Cytophaga, Bacteriodales, Flavobacterium,
Sphingobacterium)
Manz et al. (1996) 35
CF_319B TGGTCCGTATCTCAGTAC CFB (mostlyCytophaga) Manz et al. (1996) 35
PRIMERS for iTAG
515F GTGCCAGCMGCCGCGGTAA V4 region universal 16S rRNA Caporaso et al. (2012) 55 806R GGACTACHVGGGTWTCTAAT V4 region universal 16S rRNA Caporaso et al. (2012) 55 PRIMERS for CLONE LIBRARIES
Bac27F AGAGTTTGATYMTGGCTC Bacterial 16S rRNA Lane (1991) 54
U1492R GGYTACCTTGTTACGACTT Universal 16S rRNA Lane (1991) 54
10-30Fa TCCGGTTGATCCTGCC Archaeal 16S Von Wintzingerode et al. (1999) 54
Arc958R YCCGGCGTTGAMTCCAATT Archaeal 16S DeLong (1992) 54
DSR1F ACSCACTGGAAGCACG dsrAB Wagner et al. (1998) Touchdown
61-48
DSR4R GTGTAGCAGTTACCGCA dsrAB Wagner et al. (1998) Touchdown
61-48
APS_1F TGGCAGATCATGATYMAYGG APS reductase Blazejak et al. (2006) 54
APS_4R GCGCCAACYGGRCCRTA APS reductase Blazejak et al. (2006) 54
sox527F TGGTWGGWCAYTGGGAATTTA sulfate thiol esterase Akerman, Butterfield & Huber (2013) 46 sox1198R AGAANGTATCTCKYTTATAAAG sulfate thiol esterase Akerman, Butterfield & Huber (2013) 46
to silica tubes from the PowerMicrobiome RNA Isolation Kit (MoBio). This kit was chosen based on manufacturer recommendation for formalin-fixed sediment samples,
with the added capability to co-elute RNA if desired. 6.5 µl of beta-mercaptethanol
was added, and samples were mechanically lysed in a bead beater (FastPrepFP120; Thermo Electron Corp., Waltham, MA, USA) for 45 s at setting 5.5 and incubated
at 65 ◦
C for 3.5 h. The remaining steps in the PowerMicrobiome RNA Isolation Kit were followed according to manufacturer instructions (starting at step 5) without
any DNase procedures, and eluting in a final volume of 60 µl ultrapure water.
DNA extracts were quantified using a Qubit Flurometer and HS dsDNA kit (Invitrogen;
Table S1). All but one Magneto-FISH sample had DNA concentrations below detection
(<0.5 ng/µl); however, all samples yielded PCR amplicons when viewed on a gel after initial
pre-barcoding PCR (30 cycles).
iTag samples were prepared with Earth Microbiome Project (EMP) primers 515f and
806r (Caporaso et al., 2012). An initial amplification of 30 cycles with primers lacking the
barcode, linker, pad, and adapter was performed for all samples, in duplicate. Duplicate PCR reactions were pooled and reconditioned for 5 cycles with barcoded primers, for a total of 35 cycles. A master mix of 2 X Q5 Hot Start High Fidelity Master Mix (NEB) and
10µM forward and reverse primers was prepared for a final volume of 15µl per sample,
with 1µl DNA template. PCRs had an initial 2 min heating step at 98◦C, followed by
cycles of 10 s 98◦
C, 20 s 54◦
C, and 20 s 72◦
C, and finished with a final extension of
2 min at 72◦
C. PCR negative controls, substituting ultrapure water for DNA template, were amplified for 40 cycles total. We note that these are not the official recommended reagents or PCR conditions from the EMP, but internal lab tests showed that for 6 out of 9 mock community taxa, recovered sequence relative abundances were more accurate when using Q5 polymerase rather than the recommended Hot Start MasterMix (5-prime). EMP primers were chosen for iTag for cross-comparison between studies, though there is
known primer bias within this universal primer set (Parada et al., 2015) and sequencing
reactions will always have some inherent variability.
Mock communities
Four mock communities were prepared with a range of relative proportions of nine
common methane seep taxa (Table S2). Full-length 16S rRNA gene plasmids from each taxa
listed were quantified by Qubit. Taking into account the plasmid’s nucleotide composition and length in order to calculate its molecular weight, plasmids were quantitatively combined in known volumetric fractions to achieve a range of desired mock community compositions.
These combined plasmid mixes were diluted to∼1 ng/µL and then prepared according to
the same iTag methods as all other samples.
iTag sequence processing
We followed the mothur Standard Operating Procedure (SOP) for Illumina MiSeq
sequencing of the 16S rRNA gene V4 region, accessed May 2015 and using methods
described in Kozich et al. (2013)with UCHIME chimera checking (Edgar et al., 2011). A
concatenated file of themothur version of separate archaeal and bacterial SILVA 119
databases (Quast et al., 2013) was used for alignment and classification. Unfixed Bulk
Sediment 1 only returned 8% of the average DNA concentration of the other two samples.
(Table S1). This sample was removed from statistical analyses because it fails to be a
representative of the unfixed bulk sediment community baseline. The mock communities
were processed following the ‘‘Assessing Error Rates’’ section of the mothur SOP to
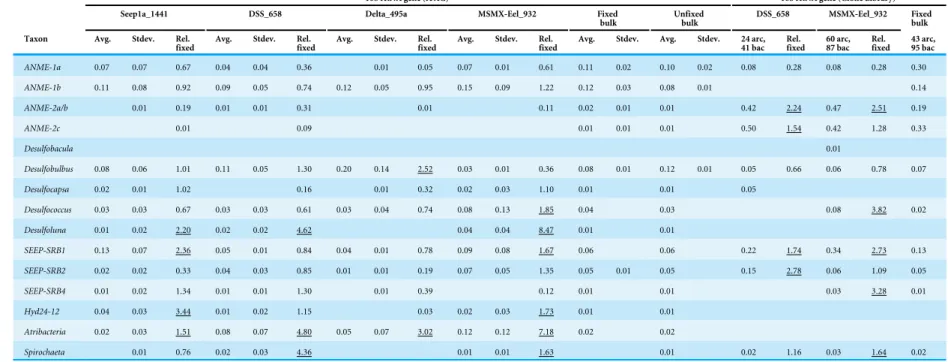
Table 2 16S rRNA gene iTag and clone library relative sequence abundance for seep microbiome OTUs.Relative sequence abundances were computed for the top 135 OTUs in the iTag dataset. These OTUs correspond to∼55% of the total sequences in the unfixed bulk sediment. Bacterial and archaeal 16S rRNA gene libraries are in-cluded for the core methane seep taxa, with the total number of clones for each library indicated above. Core methane seep taxa were based onRuff et al. (2015)and in-clude: candidate PhylumAtribacteria, Candidate Division Hyd24-12,Methanomicrobia,Caldilineales,Desulfobacterales, andSpirochaetales. While we did recover other
Chloroflexi, noCaldilinealeswere recovered in iTag or gene library sequencing so they are not included below. Fixed bulk sediment was chosen for baseline comparison (rather than unfixed) since it includes the potential loss of cells due to fixation and wash steps, thereby processed more similarly to the Magneto-FISH samples. An av-erage and standard deviation for relative sequence abundance among replicates was calculated for each sample set. A ratio of the avav-erage relative sequence abundance of Magneto-FISH enrichments compared to the fixed bulk sediment value is reported (Rel. fixed). Ratios over 1.5 are underlined. 16S rRNA gene bacteria and archaea clone libraries for two Magneto-FISH enrichments and fixed bulk sediment are also included for comparison to recovered iTag diversity.
16S rRNA gene (iTAG) 16S rRNA gene (Clone Library)
Seep1a_1441 DSS_658 Delta_495a MSMX-Eel_932 Fixed
bulk Unfixedbulk DSS_658 MSMX-Eel_932 Fixedbulk
Taxon Avg. Stdev. Rel.
fixed Avg. Stdev. Rel.fixed Avg. Stdev. Rel.fixed Avg. Stdev. Rel.fixed Avg. Stdev. Avg. Stdev. 24 arc,41 bac Rel.fixed 60 arc,87 bac Rel.fixed 43 arc,95 bac
ANME-1a 0.07 0.07 0.67 0.04 0.04 0.36 0.01 0.05 0.07 0.01 0.61 0.11 0.02 0.10 0.02 0.08 0.28 0.08 0.28 0.30
ANME-1b 0.11 0.08 0.92 0.09 0.05 0.74 0.12 0.05 0.95 0.15 0.09 1.22 0.12 0.03 0.08 0.01 0.14
ANME-2a/b 0.01 0.19 0.01 0.01 0.31 0.01 0.11 0.02 0.01 0.01 0.42 2.24 0.47 2.51 0.19
ANME-2c 0.01 0.09 0.01 0.01 0.01 0.50 1.54 0.42 1.28 0.33
Desulfobacula 0.01
Desulfobulbus 0.08 0.06 1.01 0.11 0.05 1.30 0.20 0.14 2.52 0.03 0.01 0.36 0.08 0.01 0.12 0.01 0.05 0.66 0.06 0.78 0.07
Desulfocapsa 0.02 0.01 1.02 0.16 0.01 0.32 0.02 0.03 1.10 0.01 0.01 0.05
Desulfococcus 0.03 0.03 0.67 0.03 0.03 0.61 0.03 0.04 0.74 0.08 0.13 1.85 0.04 0.03 0.08 3.82 0.02
Desulfoluna 0.01 0.02 2.20 0.02 0.02 4.62 0.04 0.04 8.47 0.01 0.01
SEEP-SRB1 0.13 0.07 2.36 0.05 0.01 0.84 0.04 0.01 0.78 0.09 0.08 1.67 0.06 0.06 0.22 1.74 0.34 2.73 0.13
SEEP-SRB2 0.02 0.02 0.33 0.04 0.03 0.85 0.01 0.01 0.19 0.07 0.05 1.35 0.05 0.01 0.05 0.15 2.78 0.06 1.09 0.05
SEEP-SRB4 0.01 0.02 1.34 0.01 0.01 1.30 0.01 0.39 0.12 0.01 0.01 0.03 3.28 0.01
Hyd24-12 0.04 0.03 3.44 0.01 0.02 1.15 0.03 0.02 0.03 1.73 0.01 0.01
Atribacteria 0.02 0.03 1.51 0.08 0.07 4.80 0.05 0.07 3.02 0.12 0.12 7.18 0.02 0.02
Spirochaeta 0.01 0.76 0.02 0.03 4.36 0.01 0.01 1.63 0.01 0.02 1.16 0.03 1.64 0.02
T
rembath-Reicher
t
e
t
al.
(2016),
P
eerJ
,
DOI
10.7717/peerj.1913
compute sequencing error rates and spurious OTU rates (Table S4). Additional analysis demonstrating sequence processing did not selectively remove ANME-2c sequences and relative sequence abundances recovered with iTag sequencing of mock communities are
provided inTables S3andS2, respectively.
UsingRversion 3.1.3 (R Core Team, 2015), an average number of sequences per OTU
was calculated from unfixed bulk sediment samples (2 and 3). All OTUs with an average relative sequence abundance below 0.1% in the unfixed bulk sediment were identified
and removed from all samples usingmothur. 135 unique OTUs remained out of 25,354.
We also verified that after the 0.1% cutoff was applied, no negative control contaminant OTUs remained. The top 20 OTUs amplified from the no template negative control were classified as, in order of sequence abundance: Sphingomonas*; Planctomyces*; Escherichia-Shigella*; Staphylococcus; Roseomonas*; Pir4_ lineage; Delftia*; Macrococcus; Myxococcales;0319-6G20;unclassified; Planctomyces; Enhydrobacter; Sphingobium*; Caenispirillum; Bacillus*; Pseudoxanthomonas*; Peptoniphilus; Lysobacter; Salinicoccus;
Propionibacterium.* Reagent contaminant genera discussed in Salter et al. (2014)are
denoted by (*). All samples (including mock community and negative controls) were
submitted to the SRA under the accessionSAMN03879962, BioSample:SAMN03879962,
Sample name: PC47 (5133-5137) mixed slurry.
Gene libraries of the Magneto-FISH samples were prepared as inTrembath-Reichert,
Green-Saxena & Orphan (2013) using the primers and annealing temperatures listed in
Table 1and TOPO TA Cloning Kit for Sequencing with pCR4-TOPO Vector and One
Shot Top 10 chemically competent Escherichia coli (Life Technologies). All full-length 16S
rRNA gene sequences were aligned by the SINA online aligner (v1.2.11) (Pruesse, Peplies &
Glöckner, 2012) and added using maximum parsimony to the SILVA 119 database (Quast et al., 2013) for classification. A taxonomy-based count table was prepared (sequences per taxa, per sample) and all taxa absent from the bulk sediment library were removed from Magneto-FISH enrichment libraries (for parity with iTag contaminant removal processing).
Functional gene sequences were translated using theEMBOSSonline translation tool (Li
et al., 2015), then added toARB(Ludwig et al., 2004) databases for phylogenetic placement and classification. Sequences were submitted to NCBI under the following accession
numbers: AprA (KT280505–KT280517), DsrA (KT280518–KT280533), McrA (KT280534–
KT280581), Archaeal 16S rRNA gene (KT280582–KT280632), Bacterial 16S rRNA gene
(KT280633–KT280909), SoxB (KT280910–KT280928). Gene trees were computed with
representative sequences using PhyML 3.0 (Guindon et al., 2010) online execution with
defaults on the South of France Bioinformatics platform.
Statistical analysis
Weighted UniFrac (Lozupone & Knight, 2005), Metastats (White, Nagarajan & Pop, 2009),
and linear discriminant analysis (LDA) effect size (LEfSe) (Segata et al., 2011) analyses were
computed inmothur as outlined in themothur SOP. Co-occurrence statistical analyses
were run using the table of 135 unique OTUs in the format of sequence counts of each
OTU per sample. The programSparCC was used to determine significant correlations
(Friedman & Alm, 2012). This analysis was run 100 times with default settings, except 10
98 92 95 90 93 96 96 92 65 57 70 68 99 80 84 100 93 89 92 100 94 86 64 100 78 85
92 65 50 58
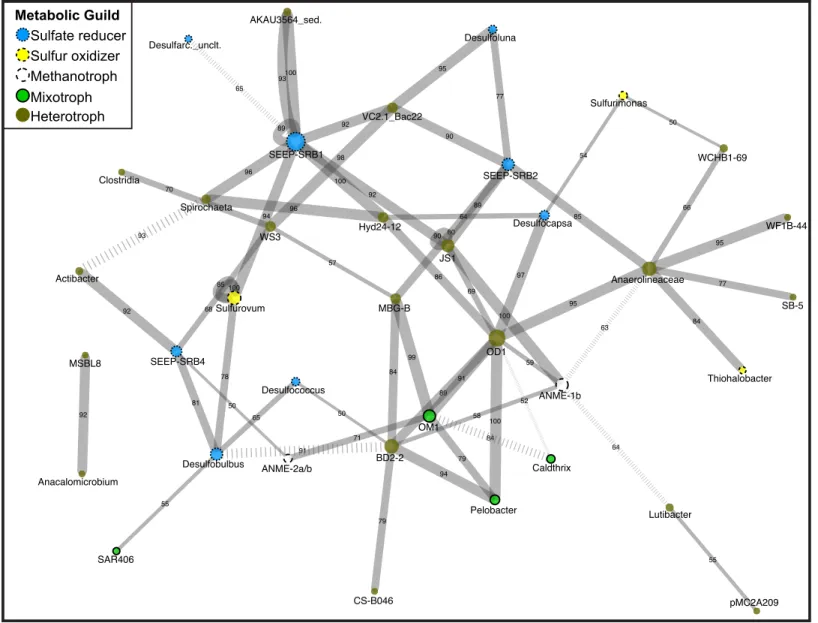
89 94 91 79 50 71 81 55 69 90 100 89 91 79 84 77 54 97 100 52 95 59 63 64 85 55 50 84 77 66 95 VC2.1_Bac22 Spirochaeta Actibacter Desulfarc._unclt. WS3 MBG-B AKAU3564_sed. SEEP-SRB1 Hyd24-12 Clostridia Sulfurovum Anacalomicrobium Desulfococcus BD2-2 ANME-2a/b CS-B046 SEEP-SRB4 SAR406 Desulfobulbus MSBL8 JS1 OM1 Desulfoluna Desulfocapsa OD1 ANME-1b Caldthrix Pelobacter SEEP-SRB2 pMC2A209 Sulfurimonas Thiohalobacter Anaerolineaceae Lutibacter SB-5 WCHB1-69 WF1B-44 Metabolic Guild Sulfate reducer Sulfur oxidizer Methanotroph Heterotroph Mixotroph
Figure 1 Network diagram of Magneto-FISH and bulk sediment samples.Co-occurrence analysis of the top 135 unique OTUs displayed in net-work form. Nodes represent the taxonomy of the OTUs in the netnet-work and edges are the connections between OTUs. Node size is scaled by num-ber of connecting OTUs and colored by simplified, putative metabolic guild (sulfate reducer: blue, small dash; sulfur oxidizer: yellow, medium dash; archaeal methanotroph: magneta, large dash; mixotroph: green, no dash; heterotroph: brown, no outline). Edge thickness is scaled by number of occurrences of this association (from 50 to 100 times) and number of occurrences also included along edge. Negative associations are denoted by hashed lines. The combined network is displayed using Cytoscape, with the average correlation coefficient across all runs determining the distance between nodes and the number of occurrences in 100 network iterations determining edge width.
iterations were used instead of 20. OTUs withSparCCcorrelations above an absolute value
of 0.6 withp-values below 0.01 were considered significant. Resulting associations that
occurred in at least 50 out of 100 network iterations are provided inTable S5.Cytoscape
(Shannon et al., 2003) was used to display associations inFig. 1.
CARD-FISH microscopy
A triple CARD-FISH hybridization was performed with bacterial probes listed inTable 1,
ANME-1_350 and MSMX-Eel_932. The sample preparation and CARD reaction was
performed as perGreen-Saxena et al. (2014). After the three CARD reactions, samples
were post-stained with DAPI (25 ng/µl). CARD signal within any part of a physically
attached group of cells larger than 10µm was counted as a positive identification. For
example, a large EPS matrix that contained many smaller separate ANME-1 and ANME-2 aggregates would count as one positive identification for each clade. This was done to simulate groups that would have been isolated together in a Magneto-FISH enrichment. Since the MSMX-Eel_932 probe also targets the ANME-1 population, only cells with MSMX-Eel_932 signal and no ANME-1_350 signal were recorded as an ANME-2 positive identification to comprehensively target ANME-1, -2, and a bacterial partner in a triple CARD-FISH hybridization set. ANME-3 were not recovered in the iTag dataset and were not considered as potential contributors to MSMX-Eel_932 signal.
RESULTS
Relative sequence abundance of seep microbiome taxa in 16S rRNA gene iTag and libraries
Relative sequence abundances of the methane seep microbiome characteristic taxa, ANME
archaea,Deltaproteobacteria, Hyd24-12, and Atribacteria (Ruff et al., 2015), were compared
two ways: (1) between iTag and gene library 16S rRNA gene samples to determine how relative sequence abundances differed between sequencing methodologies, and (2) between Magneto-FISH enrichment and bulk sediment to determine taxa-specific relative sequence
abundance for each probe (Table 1).
Mock community analysis showed that ANME-2 were always underrepresented in iTag
data (0.32–0.81 fold of what was expected), whereas theDeltaproteobacteriaand ANME-1b
were more faithfully represented (Table S2). ANME-1a was consistently overamplified. By
normalizing the relative sequence abundance of ANME-2c, -2a/b, and -1a to the abundance
of ANME-1b, the most faithfully amplified archaea in the mock community data (Table
S2), we could compute a ratio between the average relative sequence abundance in fixed
bulk sediment samples between iTag and the archaeal 16S rRNA gene library. ANME-2c (0.04 iTag:clone ratio), ANME-2a/b (0.12), and ANME-1a (0.40) were all less abundant in
iTag sequences as compared to the archaeal gene library (calculated from values inTable 2).
Similarly comparing SEEP-SRB1 toDesulfobulbusbetween the two methods in fixed bulk
sediment returns a ratio of 0.41 iTag:clone. Since the iTag methodology recovers far more
diversity (e.g.,Desulfobacula,Desulfocapsa,Desulfoluna, Atribacteria, and Hyd24-12 were
not recovered in the bacterial 16S rRNA gene bulk sediment library), it is expected that the relative sequence abundances of each individual taxon computed from iTag data would be less than the domain targeted 16S rRNA gene libraries. However the ANME-2c abundance ratio was an order of magnitude less than ANME-1a and SEEP-SRB1 ratios, and appears to be an extreme case of underestimation in iTag data. There was also variation between Magneto-FISH enrichment replicates, as indicated by the high standard deviations of Magneto-FISH samples as compared to bulk sediment samples. The degree of variation (average standard deviation across all taxa listed) correlated with the specificity of the probe; where Delta_495a had the lowest average standard deviation and Seep-1a_1441 had the highest average standard deviation.
The high relative sequence abundance taxa (>1.5 fold relative sequence abundance
increase over fixed bulk sediment;Table 2) in the averaged Seep-1a_1441 iTag
Magneto-FISH enrichments were Desulfoluna (2.20), SEEP-SRB1 (2.36), Hyd24-12 (3.44) and
Atribacteria(1.51) (Table 2). The DSS_658 enrichment had fewer high relative sequence
abundance taxa with only Desulfoluna (4.62), Spirochaeta (4.36), and Atribacteria
(4.80). The Delta_495a enrichment also had three high relative sequence abundance
taxa withDesulfobulbus (2.52),Spirochaetae-uncultured (3.70), andAtribacteria(3.02).
The MSMX-Eel_932 enrichment had six high relative sequence abundance taxa with
Desulfococcus (1.85),Desulfoluna(8.47), SEEP-SRB1 (1.67),Spirochaeta(1.63),
Hyd24-12 (1.73), andAtribacteria (7.18). Gene library results showed high relative sequence
abundance (>1.5) in both ANME and Deltaproteobacteriawith DSS_658 and
MSMX-Eel_932 enrichments (Table 2). Similar to the bulk sediment,Desulfobacula,Desulfocapsa,
Desulfoluna,Atribacteriaand Hyd24-12 were not recovered in the bacterial 16S rRNA gene Magneto-FISH libraries. MSMX-Eel_932 enriched for SEEP-SRB1 (2.73), SEEP-SRB4
(3.28),Desulfococcus(3.82),Spirochaeta(1.64), and ANME-2a/b (2.51) in 16S rRNA gene
libraries. There was also a slight enrichment of ANME-2c (1.28). The DSS_658 enrichment had high relative sequence abundance for SEEP-SRB1 (1.74), SEEP-SRB2 (2.78), ANME-2c (1.54), and ANME-2a/b (2.24) with iTag, but these same taxa did not have high relative
sequence abundance in the gene library. Spirochaetaand SEEP-SRB1 had high relative
sequence abundance in both iTag and gene libraries for MSMX-Eel_932 enrichments. Relative sequence abundances for all non-core methane seep taxa in iTag samples are
included in Table 3, and where Magneto-FISH enrichments of these additional taxa
support network co-occurrences they are discussed in network results.
Statistical evaluation of Magneto-FISH enrichment
To statistically compare enrichment microbial communities, we used a suite of statistical
tests including: non-parametricT-tests (White, Nagarajan & Pop, 2009), LEfSe (Segata
et al., 2011), and UniFrac (Lozupone & Knight, 2005). Using theT-test comparison, ten
OTUs were significantly (p<0.001) different between the bulk sediment and
Magneto-FISH samples (when only including OTUs with sequences present in both groups).
The taxonomic assignments for these ten OTUs were: WCHB1-69, Desulfobulbus,
Thaumarcheota, ANME-1a,Bacteroidetes(VC2.1), ANME-2c,Caldithrix, SEEP-SRB1,
Candidate Division TA06, andGammaproteobacteria(CS-B046). LEfSe was then used to
determine which OTUs were significantly different between Magneto-FISH enrichments
and bulk sediment. We found three OTUs were significantly (p-value < 0.05) higher
in relative sequence abundance in Magneto-FISH samples over bulk sediment with the
taxonomies: SEEP-SRB1,Desulfobulbus, andPlanctomycetes(SHA-43).
Weighted UniFrac analysis was used to compare the community composition between Magneto-FISH iTag enrichments. The UniFrac metric represents the fraction of the branch length that is unique to each sample, or unshared between samples, such that
a higher ratio means less similar samples. The Deltaproteobacteriaprobe enrichment
communities were more similar to each other than any of theDeltaproteobacteriaprobes
compared with the MSMX-Eel_932 probe (Table 4). The most distinct communities were
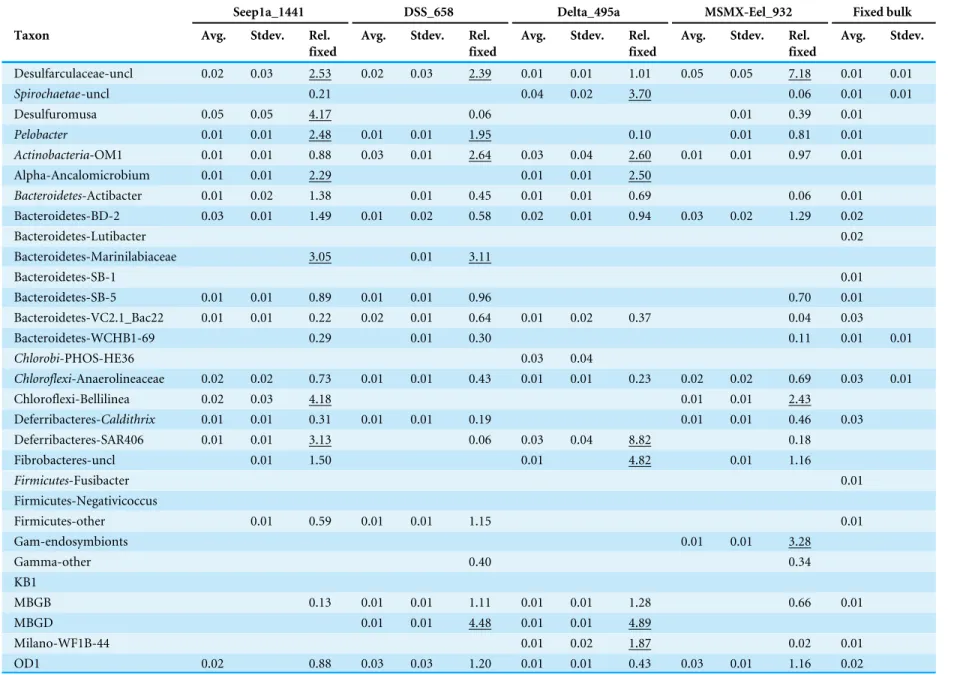
Table 3 iTag relative abundance of remaining ‘non-core’ methane seep microbiome OTUs.Relative sequence abundances were computed for the top 135 OTUs in the iTag dataset that were not included in the core methane seep microbiome. An average and standard deviation for relative sequence abundance among replicates was cal-culated for each sample set. A ratio of the average relative sequence abundance of Magneto-FISH enrichments compared to the fixed bulk sediment value is reported (Rel. fixed). Ratios over 1.5 are underlined. 16S rRNA gene bacteria and archaea clone libraries for two Magneto-FISH enrichments and fixed bulk sediment are also included for comparison to iTag enrichment.
Seep1a_1441 DSS_658 Delta_495a MSMX-Eel_932 Fixed bulk
Taxon Avg. Stdev. Rel.
fixed
Avg. Stdev. Rel. fixed
Avg. Stdev. Rel. fixed
Avg. Stdev. Rel. fixed
Avg. Stdev.
Desulfarculaceae-uncl 0.02 0.03 2.53 0.02 0.03 2.39 0.01 0.01 1.01 0.05 0.05 7.18 0.01 0.01
Spirochaetae-uncl 0.21 0.04 0.02 3.70 0.06 0.01 0.01
Desulfuromusa 0.05 0.05 4.17 0.06 0.01 0.39 0.01
Pelobacter 0.01 0.01 2.48 0.01 0.01 1.95 0.10 0.01 0.81 0.01
Actinobacteria-OM1 0.01 0.01 0.88 0.03 0.01 2.64 0.03 0.04 2.60 0.01 0.01 0.97 0.01
Alpha-Ancalomicrobium 0.01 0.01 2.29 0.01 0.01 2.50
Bacteroidetes-Actibacter 0.01 0.02 1.38 0.01 0.45 0.01 0.01 0.69 0.06 0.01
Bacteroidetes-BD-2 0.03 0.01 1.49 0.01 0.02 0.58 0.02 0.01 0.94 0.03 0.02 1.29 0.02
Bacteroidetes-Lutibacter 0.02
Bacteroidetes-Marinilabiaceae 3.05 0.01 3.11
Bacteroidetes-SB-1 0.01
Bacteroidetes-SB-5 0.01 0.01 0.89 0.01 0.01 0.96 0.70 0.01
Bacteroidetes-VC2.1_Bac22 0.01 0.01 0.22 0.02 0.01 0.64 0.01 0.02 0.37 0.04 0.03
Bacteroidetes-WCHB1-69 0.29 0.01 0.30 0.11 0.01 0.01
Chlorobi-PHOS-HE36 0.03 0.04
Chloroflexi-Anaerolineaceae 0.02 0.02 0.73 0.01 0.01 0.43 0.01 0.01 0.23 0.02 0.02 0.69 0.03 0.01
Chloroflexi-Bellilinea 0.02 0.03 4.18 0.01 0.01 2.43
Deferribacteres-Caldithrix 0.01 0.01 0.31 0.01 0.01 0.19 0.01 0.01 0.46 0.03
Deferribacteres-SAR406 0.01 0.01 3.13 0.06 0.03 0.04 8.82 0.18
Fibrobacteres-uncl 0.01 1.50 0.01 4.82 0.01 1.16
Firmicutes-Fusibacter 0.01
Firmicutes-Negativicoccus
Firmicutes-other 0.01 0.59 0.01 0.01 1.15 0.01
Gam-endosymbionts 0.01 0.01 3.28
Gamma-other 0.40 0.34
KB1
MBGB 0.13 0.01 0.01 1.11 0.01 0.01 1.28 0.66 0.01
MBGD 0.01 0.01 4.48 0.01 0.01 4.89
Milano-WF1B-44 0.01 0.02 1.87 0.02 0.01
OD1 0.02 0.88 0.03 0.03 1.20 0.01 0.01 0.43 0.03 0.01 1.16 0.02
(continued on next page)
T
rembath-Reicher
t
e
t
al.
(2016),
P
eerJ
,
DOI
10.7717/peerj.1913
Table 3(continued)
Seep1a_1441 DSS_658 Delta_495a MSMX-Eel_932 Fixed bulk
Taxon Avg. Stdev. Rel.
fixed
Avg. Stdev. Rel. fixed
Avg. Stdev. Rel. fixed
Avg. Stdev. Rel. fixed
Avg. Stdev. Plactomycetes-OM190
Planctomycetes-Phycisphaerae 0.01 0.01 0.64 0.02 0.02 2.24 0.01 Planctomycetes-Pla4
Planctomycetes-SHA-43 0.01 1.39
Sulfurimonas 0.87 0.01 0.01 1.61
Sulfurovum 0.17 0.16 1.59 0.26 0.11 2.43 0.27 0.18 2.49 0.06 0.03 0.52 0.11 0.01
TA06 0.01 1.12
Thaumarc-uncl 0.12 0.01
Thiohalobacter 0.01 0.01 Thiotrichaceae-uncl
WS3 0.01 0.01 0.47 0.04 0.04 2.21 0.02 0.03 1.20 0.03 0.01 1.74 0.02
T
rembath-Reicher
t
e
t
al.
(2016),
P
eerJ
,
DOI
10.7717/peerj.1913
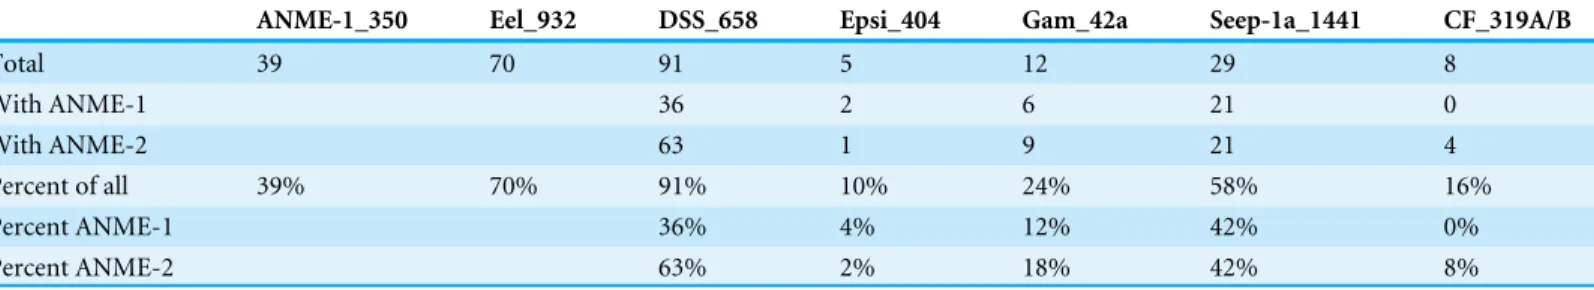
Table 4 CARD-FISH aggregate counts.Aggregate counts from triple CARD-FISH hybridizations with probes targeting ANME-1 (ANME- 1_350), all ANME (Eel_932), DSS typeDeltaproteobacteria(DSS_658),Epsilonproteobacteria(Epsi_404), SEEP-SRB1a (SEEP-1a_1441) andCytophaga, Bac-teroidetes,Flavobacterium, andSphingobacterium(CF_319A/B) associations.
ANME-1_350 Eel_932 DSS_658 Epsi_404 Gam_42a Seep-1a_1441 CF_319A/B
Total 39 70 91 5 12 29 8
With ANME-1 36 2 6 21 0
With ANME-2 63 1 9 21 4
Percent of all 39% 70% 91% 10% 24% 58% 16%
Percent ANME-1 36% 4% 12% 42% 0%
Percent ANME-2 63% 2% 18% 42% 8%
MSMX-Eel_932 enrichment and Delta_495a enrichment, with the highest proportion
of unshared branch length (0.97; p-value < 0.001). MSMX-Eel_932 enrichment and
DSS_658 enrichment had less unshared branch length at 0.88 (<0.001), suggesting MSMX-Eel_932 and DSS_658 probes enrich for a more similar community than MSMX-MSMX-Eel_932 and Delta_495a probes. Comparison of the MSMX-Eel_932 enrichment and SEEP-1a_ 1441 enrichment communities was not significant at the <0.001 cutoff. Within the Deltaproteobacteriaprobes, SEEP-1a_1441 enrichment and DSS_658 enrichment had the lowest proportion of unshared community (0.77, <0.001); the most similar community structures were recovered with these two probes. The next lowest proportion of unshared community is between DSS_658 enrichment and Delta_495a enrichment (0.81). SEEP-1a_1441 enrichment and Delta_495a enrichment are least similar, at 0.85. All of these values are highly significant (<0.001). This is consistent with the expectation that the overlap between the target microbial population of the SEEP-1a_1441 probe would be most similar to the target microbial population of the DSS_658 probe, while
the Delta_495a enrichment would recover more total Deltaproteobacteria diversity.
Assessing community structure with co-occurrence network analysis
After determination of statistically significant differences between iTag Magneto-FISH and bulk sediment samples, we computed co-occurrence networks to observe which of the 135 most abundant OTUs were correlated in the methane seep microbial community. By combining the results from 100 separate microbial association calculations, we were able to assign confidence to each microbial association and determine the most robust associations.
Significant associations are reported in Table S5 and depicted as a network inFig. 1.
Focusing first on the common ANME syntrophicDeltaproteobacteriapartner,
SEEP-SRB1, this taxon had the most associations in the network including nine positive
associations and one negative association (Fig. 1). There are two separate sets of SEEP-SRB1
& Planctomycetes(AKAU3564 sediment group) positive associations that are both well
supported. SEEP-SRB1 is also associated with three other heterotrophic taxa (Candidate
Phylum Atribacteria,Spirochaeta, andBacteroidetes(VC2.1_ Bac22)) and one
sulfur-oxidizing taxa (Sulfurovum). SEEP-SRB1 was also associated with Candidate Division
Hyd24-12, which has a currently unknown ecophysiology, but could be a heterotroph if the topology of heterotrophic taxa being in the center of the network holds true. Hyd24-12
andAtribacteriaare also both associated with the second most associated taxa, Candidate Division OD1, but there was no direct association between SRB1 and OD1.
SEEP-SRB2 has two of the same associations as SEEP-SRB1 (VC2.1_Bac22 andAtribacteria), but
is the onlyDeltaproteobacteriaassociated with MBG-B,Anaerolineaceae, andDesulfoluna
(anotherDeltaproteobacteria). SEEP-SRB4 is associated withDesulfobulbus, and the only
Deltaproteobacteriaassociated with and ANME (2a/b), WS3, andActibacter. WS3 had high
relative sequence abundance in both DSS_658 and MSMX-Eel_932 enrichments (Table 3).
Desulfobulbusis associated withDesulfococcus, the onlyDeltaproteobacteriaassociated with BD2-2, and SAR406. SAR406 had high relative sequence abundance in Seep1a_1441 and
Delta_495a enrichments (Table 3). The heterotroph Spirochaetais also included in the
core methane seep microbiome and was associated withClostridiaand WS3, in addition
to Hyd24-12 and SEEP-SRB1.
In examination of additional OTUs associated with sulfur metabolisms, we found
Sulfurovum and Sulfurimonas (Epsilonproteobacteria) were not associated with each
other, but are both associated withDeltaproteobacteria.Sulfurimonasis associated with
DesulfocapsaandSulfurovumis associated with SEEP-SRB1 andDesulfobulbus.Sulfurovum
had high relative sequence abundance in MSMX-Eel_932 enrichments andSulfurimonas
had high relative sequence abundance in Seep-1a_1441, DSS_658, and Delta_495a
enrichments (Table 3). The Gammaproteobacteria,Thiohalobacter, is only associated
withAnaerolineaceaeand was not elevated in any of the Magneto-FISH enrichments. Heterotrophs are the most dominant metabolic guild in the network, and similar to sulfate-reducers, have some of the most connected taxa. The heterotroph OD1 has seven
positive correlations, in addition toAtribacteriaand Hyd24-12 listed above:Bacteroidetes
(BD2-2),Actinobacteria(OM1),Pelobacter, ANME-1b,Chloroflexi(Anaerolineaceae), and
Desulfocapsa. Anaerolineaceae andBacteroidetes(BD2-2) both had seven associations, but with different connectivity. BD2-2 was interconnected with other heterotrophs, sulfate-reducers, and archaeal methanotrophs in the main portion of the network,
whereasAnaerolineaceae was connected to three taxa that share no other connections
(two heterotrophs and oneGammaproteobacteriasulfur oxidizer). The one other ANME
taxa in the network, ANME-1b, is only positively associated with heterotrophs and no known sulfate reducing groups.
Assessing ANME-bacterial partnerships by CARD-FISH
To assess ANME and DSS relative cell abundance, 100 aggregate clusters from the same sediment incubation (see ‘Materials & Methods’) were analyzed with CARD-FISH and the DSS_658/ANME1-350/MSMX-Eel_932 probe combination. Epsi_404, Gam_42a, SEEP-1a_1441, and CF_319A/B probes were also used with the archaeal probe combination to examine non-DSS bacterial diversity recovered in the network analysis ANME associations.
All probes, target populations, and references are listed inTable 1.
30% of aggregates contained an ANME-2 signal (see ‘Materials & Methods’;Table 5)
and 39% of aggregates had an ANME-1 signal. ANME-1 and ANME-2 identified cells were also consistent with expected morphologies. Multiple clusters of mixed-type ANME/DSS, DSS-only, ANME-only, DSS/non-ANME, and non-DSS/non-ANME aggregates were
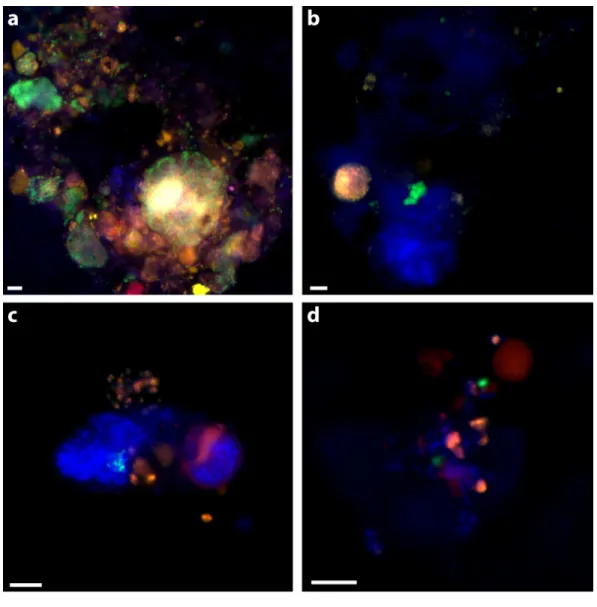
Figure 2 Examples of triple CARD-FISH hybridized aggregates.Triple CARD-FISH hybridization using bacteria and archaea probes targeting DSS_658 (A), Gam42a (B), CF319A/B (C), and Epsi404 (D) in green FITC, with ANME1-350 in red and MSMX-Eel_932 in yellow for all. Scale bar 5µm for all. DAPI stain in blue.
observed with the ANME-1_350, MSMX-Eel_932, and DSS_658 probe combination (Fig.
2A). There were no clear examples of aggregates with ANME/non-DSS hybridized cells,
though we found many instances where both ANME and non-DSS cells were as part of a larger aggregate cluster with other cell types. ANME-1 cells often occurred in the matrix surrounding tightly clustered ANME-2 aggregates. The SEEP-1a_1441 probe, targeting a subgroup of DSS, was observed to hybridize with aggregate clusters that contained ANME-1 and ANME-2 cells, but usually with SEEP-SRB1/ANME-2 in tight association and ANME-1 in more peripheral association. Five of the SEEP-SRB1/ANME-2 aggregate clusters did not have ANME-1 cells (10%) and three of the SEEP-SRB1/ANME-1 aggregate clusters did not have ANME-2 cells.
Table 5 UniFrac analysis of Magneto-FISH samples.Community comparison of iTag Magneto-FISH samples using weighted UniFrac analysis.
Seep1a1441 DSS658 Delta495a Eel932
Seep1a1441 – 0.77∗ 0.85∗ 0.91+
DSS658 – – 0.81∗ 0.88∗
Delta495a – – – 0.97∗
Notes.
Significance of relationship between communities is reported withp-values:∗
, <0.001; ˆ, 0.002;+, 0.030.
Ten percent of aggregates (n=50 counted) hybridized with the Epsi_404 probe, broadly
targeting members of theEpsilonproteobacteria. TheseEpsilonproteobacteriawere mostly
found in association with other bacteria and occasionally, loosely associated with some ANME. Epsi_404 hybridized cells were generally ovoid and scattered throughout an
EPS matrix of cells, as depicted in Fig. 2D. There was no apparent preference for
Epsilonproteobacteriaassociation with ANME-1 or ANME-2 aggregate clusters (Table 4).
A higher percentage of aggregates had Gammaproteobacteria cells (24% of 50) than
Epsilonproteobacteriacells, and there was a slightly higher co-occurrence with
ANME-2 (18%) than ANME-1 (1ANME-2%) hybridized cells. The dominant Gammaproteobacteria
morphology observed was a cluster or chain of large (∼1µm) ovoid cells. Gam_42a
hybridizing cell clusters and chains were found both separately and associated with other
bacteria, as inFig. 2B, where they are predominately an unidentified cluster stained by
DAPI with a sub-aggregate of ANME-2 cells. CF319A and CF319B were used to target
Cytophaga,Bacteroidetes,Flavobacterium, andSphingobacterium. Eight percent (n=50
counted) of aggregates contained cells positively hybridizing with the CFB probe, generally
observed as clustered filaments or rods (Fig. 2C). Half of these aggregates also had ANME-2
hybridized cells. No CFB cells were observed to co-associate with ANME-1.
DISCUSSION
Evaluation of Magneto-FISH with iTag
Challenges accompanying downstream analysis of Magneto-FISH enrichments are primarily associated with low DNA yield and poor DNA quality from aldehyde fixation
(for further discussion of fixation effects seeTrembath-Reichert, Green-Saxena & Orphan,
2013). Low template concentration exacerbates amplification of contaminating sequences
since target and non-target templates can approach parity in a PCR reaction. Low template concentration has also been shown to create random variation in amplification products
in dilution experiments (Chandler, Fredrickson & Brockman, 1997), which could explain
the high variation seen in Magneto-FISH enrichment relative sequence abundances compared to bulk sediment samples. Despite these challenges, the DNA recovered from Magneto-FISH enrichments has been shown to increase the sequence abundance of target organisms relative to the bulk sediment by 16S rRNA gene sequencing and metagenomics on
various Next Generation sequencing platforms (Pernthaler et al., 2008;Trembath-Reichert,
Green-Saxena & Orphan, 2013). In this study, conventional cloning and sequencing of
full-length bacterial and archaeal 16S rRNA genes had fewer contamination issues as compared to iTag sequencing with universal primers. Our Magneto-FISH experiments were designed to mitigate as many sampling and iTag sequencing biases between samples as possible, by concurrently extracting, amplifying, and sequencing all Magneto-FISH samples in parallel, including biological and technical replicates. The relative ratio of contaminant reads to environmental OTU’s were higher in Magneto-FISH enrichments than in bulk sediment samples, but bulk sediment could be used to separate indigenous community members from putative contaminants in the Magneto-FISH samples (see ‘Materials & Methods’). This provided a conservative Magneto-FISH dataset for statistical analyses and demonstrated the importance of parallel processing sequencing of bulk and separated samples.
In addition to issues with contaminating sequences, we also observed bias against some core methane seep microbiome taxa, where these taxa were consistently underrepresented by iTag when compared to gene libraries and CARD-FISH. ANME-2 was the most underrepresented taxon in iTag sequencing of the bulk sediment and mock communities, with much greater relative sequence and relative cell abundance in gene library sequencing and CARD-FISH analysis, respectively. It is most likely that iTag sequencing bias with the EMP primer set is the reason ANME-2c was not enriched in the Magneto-FISH samples and absent from microbial community network analysis. Members of the ANME-2a/b were also, to a lesser extent, underrepresented with iTag. In addition to our gene libraries and CARD-FISH analysis, independent assays using FISH with mono labeled oligonucleotide probes from this sediment incubation further confirmed the abundance of ANME-2 aggregates; 25% of aggregates were ANME-2c and 17% of aggregates were ANME-2b, with about half of ANME-2 aggregates associating with a bacterial partner other than SEEP-SRB1
(SupplementMcGlynn et al., 2015). We conclude that while expected ANME-2 associations
were not recovered, they can be explained by EMP iTag bias and therefore do not reduce the validity of other non-ANME-2 associations recovered in the co-occurrence analysis (see
Tables S2andS3captions for further discussion of ANME-2c bias). Although ANME-1a
was not underrepresented in the iTag data, it still does not appear in the co-occurrence network. In other co-occurrence network studies dominant OTUs were not associated with the majority of the microbial community, which was thought to be due to a high
degree of functional redundancy (Mu & Moreau, 2015). Possible functional redundancy
with other archaeal groups, or simply non-specific, loose spatial association with many taxa, as suggested by CARD-FISH analysis, could explain why ANME-1a was not recovered in our network analysis.
Despite this unanticipated methodological bias, iTag sequencing is a valid and valuable tool when combined with Magneto-FISH enrichment techniques for microbial association hypothesis development and testing. For example, we saw more bacterial OTUs, especially
among Deltaproteobacteria, in the iTag samples compared with conventional gene
libraries and the core methane seep taxon Hyd24-12 was not even observed among gene library sequences.
Magneto-FISH enrichment
This study provides a novel combination of nested Magneto-FISH enrichments and microbial community network analysis methods to develop hypotheses regarding specific lineage associations and, by inference, discusses the potential for additional metabolic interactions relating to sulfur cycling in methane seep sediments. Notwithstanding the low recovery of ANME-2 OTUs, there was statistical support for Magneto-FISH enrichments increasing the relative iTag sequence abundance of target organisms. Statistical
analyses demonstrated SEEP-SRB1 andDesulfobulbusOTUs were significantly different in
Magneto-FISH samples (t-tests), and these OTUs were significantly more enriched in
Magneto-FISH samples using linear discriminant analysis (LDA) effect size (LEfSe). Additionally, weighted UniFrac analysis showed the highest percentage of shared phylogeny was between the clade-specific SEEP-1a_1441 probe and the family-specific
Desulfobacteraceae DSS_658 probe enrichments. Therefore these Magneto-FISH samples contain microbial community overlap consistent with probe target specificity, even when some dominant community members are not represented at expected relative sequence abundance in the iTag analysis (ANME-2).
Magneto-FISH enrichment relative sequence abundance followed expected trends for
Deltaproteobacteria(Table 2). SEEP-SRB1 had the highest relative sequence abundance in Seep-1a_1441 and MSMX-Eel_932 enrichments, which should target this group.
Desulfobulbushad the highest relative sequence abundance in the Delta_495a enrichment, which was the only Magneto-FISH probe that should hybridize to this group (though
Desulfobulbuscould also be retrieved via association with other target organisms). OTUs
affiliated withDesulfoluna(within theDesulfobacteraceae) had the highest relative sequence
abundance of allDeltaproteobacteriain the DSS_658 enrichment and are also targeted by
the DSS_658 probe. Desulfoluna were not specifically targeted by MSMX-Eel_932 or
Seep-1a_1441 probes, but had high relative sequence abundane in these samples and
may have a potential association with ANME/DSS consortia. Also, Atribacteria(JS1)
was recovered in all iTag sequencing of Magneto-FISH enrichments, suggesting they may associate with either DSS/ANME or DSB/ANME consortia. Members of the Hyd24-12 were only recovered in Seep1a_1441 and MSMX-Eel_932 enrichments and may preferentially associate with SEEP-SRB1a/ANME consortia.
Evaluating our iTag relative sequence abundance data with co-occurrence analysis, we developed hypotheses that were not subject to the variation between Magneto-FISH enrichment replicates; associated taxa should always co-vary, even when they are less abundant than expected. Within the core methane seep taxa, high relative sequence
abundances of Atribacteria and Hyd24-12 with SEEP-SRB1 targeting Magneto-FISH
enrichments were upheld by the network. Hyd24-12 is highly associated with SEEP-SRB1,
whereasAtribacteriais highly associated with both SEEP-SRB1 (DSS) and SEEP-SRB2
(DSB). While Atribacteriahave not been cultured, metagenomic sequencing suggests
they are likely heterotrophic anaerobes involved in fermentation (Nobu et al., 2015).
Hyd24-12 was first cloned from Hydrate Ridge (Knittel et al., 2003) and has been cited
as a core methane seep microbial taxon (Ruff et al., 2015), but nothing is known about
its physiology. The Hyd24-12/SEEP-SRB1 association was also one of the four unique
associations that were recovered in all the network computations (n=100). These results
may aid in determining a role for these enigmatic candidate phyla of the methane seep microbiome.
MethanomicrobiaandDeltaproteobacteriaonly had one co-occurrence in our network. The one statistically supported network ANME/SRB association was between ANME-2a/b
and SEEP-SRB4. SEEP-SRB4, belonging to theDesulfobulbaceae(Knittel et al., 2003), and
ANME-2a/b both had high relative sequence abundance in the ANME-targeting MSMX-Eel_932 enrichment bacterial 16S rRNA gene library. There have been FISH-confirmed
physical associations between ANME-2/ANME-3 andDesulfobulbaceae (Green-Saxena
et al., 2014;Löesekann et al., 2007;Pernthaler et al., 2008) in AOM systems. SEEP-SRB4 was also strongly associated with the candidate phyla WS3 in the network, and WS3 was enriched in both DSS_658 and MSMX-Eel_932 enrichments. Both SEEP-SRB4 associations with ANME-2a/b and WS3 warrant future study.
While expected ANME-2/Deltaproteobacteria associations were not recovered
(see Evaluation of Magneto-FISH with iTag), network analysis did recover many
Deltaprotobacteria co-occurring with bacterial groups. Almost half of all positive
associations contained aDeltaproteobacteriaOTU (30/61), suggesting a dominant role for
the sulfur cycle metabolisms. Of those, 21 associations were with a non-ProteobacteriaOTU
including a number of candidate organisms as described above. The association between
SEEP-SRB1 and ‘AKAU3564,’ aPlanctomycetes-affiliated heterotrophic sediment group,
was observed twice with two separate OTU associations in this clade that were both strongly supported (occurring 100/100 and 93/100 times, respectively, that the network analysis was
run,Table S5). This Planctomycete group was first described in methane hydrate bearing
deep marine sediments of the Peru Margin (Inagaki et al., 2006).Planctomycetes-associated
sequences were previously recovered in association with ANME-2c Magneto-FISH samples from the Eel River Basin, where the preferred partner was observed to be the
SEEP-SRB1 group (Pernthaler et al., 2008). It follows that SEEP-SRB1 may also co-occur with
Planctomycetes, if these organisms are affiliated (either directly or indirectly) with ANME-2 consortia. By similar logic, although it did not have high relative sequence abundance in the Seep1a_1441 enrichment, this could explain the high relative sequence abundance of this
group in the MSMX-Eel_932 enrichment (Table 3).Planctomycetestargeted CARD-FISH
hybridization using the generalPlanctomycetesprobe Pla_886 was attempted; however,
many cells with a morphology similar to ANME-1 were hybridized and the results were deemed inconclusive. This ambiguity could be due to the probe’s single base pair mismatch to 97% of ANME-1a, 94% of ANME-1b, and 25% of ANME-2b, even if this mismatch
was centrally located (SILVA TestProbe online tool,Greuter et al., 2016).Spirochaetawas
also associated with SEEP-SRB1, in addition to Hyd24-12 and WS3, and had high relative
sequence abundance in both the DSS_658 and MSMX-Eel_932 enrichments (Table 2). In
addition to being core methane seep microbial taxa, some members of theSpirochaeteshave
sulfide-oxidizing capabilities in mats with sulfidogenic bacteria (Dubinina, Grabovich &
Chernyshova, 2004) and its possible that these organisms may be utilizing sulfide produced in seep systems as well.
Epsilonproteobacteria and Deltaproteobacteria were the most common
intra-Proteobacteriaassociation in the network and have been shown to co-occur in many sulfidic
habitats (Campbell et al., 2006;Omoregie et al., 2008), whereEpsilonproteobacteriaoxidize
sulfur and Deltaproteobacteriadisproportionate or reduce sulfur species (Pjevac et al.,
2014). In the network,Sulfurovumwas associated with both SEEP-SRB1 andDesulfobulbus,
and this was also seen in the relative sequence abundance data whereSulfurovumhad high
relative sequence abundance in all of theDeltaproteobacteriaMagneto-FISH enrichments.
Epsilonproteobacteria have been shown to oxidize sulfide to S◦
or HS−
to sulfate in
microbial mats (Pjevac et al., 2014), allowing some sulfur substrate differentiation between
theseEpsilonproteobacteriagroups in this system.Sulfurimonaswas not strongly associated
with anyDeltaproteobacteriain the network analysis and only had high relative sequence
abundance in the MSMX-Eel_932 enrichment (16S rRNA gene iTag, 16S rRNA gene
bacterial, and soxB gene libraries; seeFig. S2 for further discussion of metabolic genes).
CARD-FISH analysis using probe Epsi_404 confirmed the presence ofEpsilonproteobacteria
cells within some ANME and other non-hybridized cell-containing loose aggregates, but did not appear to be in the tight physical association characteristic of ANME/SRB consortia.
While cultured representatives of theseEpsilonproteobacteriahave optimum growth with
some oxygen present (Inagaki et al., 2003;Inagaki et al., 2004), it is possible that these
uncultured methane seepEpsilonproteobacteriamay be able to use other oxidants such as
nitrate or intermediate sulfur species while in anaerobic incubation conditions.
In comparison to Delta- andEpsilonproteobacteria, there was only one
Gammapro-teobacteriaOTU in the network (Thiohalobacter, with oneAnaerolineaceae association).
Cultured representatives of Thiohalobacter have diverse sulfur capabilities, including
thiocyanate metabolism, but are not known to form associations with other sulfur
cycling organisms (Sorokin et al., 2010). This differentiation betweenGamma- andEpsilon
-/Deltaproteobacteriahas been seen in other systems such as sulfidic cave biofilms (Macalady et al., 2008) or in microbial mats on marine sediments (Pjevac et al., 2014). Gam_42a
hybridizing cells (Gammaproteobacteria) were observed to form aggregates with
non-ANME and non-Desulfobulbaceae(DSS) cells in our CARD-FISH analysis, but the identity
of these organisms was not determined. While not recovered in the network, the majority
of theGammaproteobacteriaOTUs observed by iTag from the both the bulk sediment and
MSMX-Eel_932 Magneto-FISH 16S rRNA gene (Table 1) and aprA gene libraries (see Fig.
S2 for further discussion of metabolic genes) were from the SILVA taxonomy endosymbiont clade. This endosymbiont clade houses organisms with a carbon-fixation/sulfur-oxidation
metabolism (Duperron et al., 2012;Goffredi, 2010) and is predicted to be an important
member of the sulfur and carbon cycles in marine sediments outside of an endosymbiotic lifestyle (Lenk et al., 2011).
There were also three unique, positive Deltaproteobacteria-Deltaproteobacteria
associations observed in the network (Desulfobulbus/Desulfococcus,Desulfobulbus
/SEEP-SRB4, Desulfoluna/SEEP-SRB2). These multiple intra-Deltaproteobacteriaassociations
suggests there may be further nuances to be explored in theDeltaproteobacteriacommunity
structure, perhaps akin to the nitrate based partitioning observed between DSB and DSS
in seep sediments (Green-Saxena et al., 2014). Desulfobulbuswas also associated with
SAR406, and SAR406 had high relative sequence abundance in the Delta495a enrichments. SAR406 (Marine Group A) fosmids contained polysulfide reductase genes that may be
used for dissimilatory polysulfide reduction (Wright et al., 2014)Desulfobulbuscan also
use polysulfide, in addition to a range of other sulfur sources (Fuseler & Cypionka, 1995),
potentially linking these two taxa.
CONCLUSIONS
Our findings support the utilization of paired Magneto-FISH and iTag sequencing in developing and testing hypotheses to interrogate complex interactions in microbial communities. Contaminants and amplification bias can be identified and mitigated with diversity assessment by multiple means (i.e., multiple iTag primer sets, FISH surveys, or non-16S rRNA gene surveys) and parallel processing of control samples (bulk sediment and no-template) along with Magneto-FISH enrichments. Since it may not always be
knowna prioriwhich taxa are in an environmental sample, sequencing of a defined mock
community may not be an option for assessing bias. However in our case, prior knowledge of major seep taxa enabled assessment of amplification bias by iTag. It should also be noted that the degree of bias was more pronounced in the environmental samples than our mock samples, therefore mock community samples may not fully capture the degree of bias, but can be useful in identifying which taxa may be the most biased. We found the bulk sediment 16S rRNA gene libraries to be the most useful for determining which of the most abundant taxa were affected by amplification bias. Future studies may benefit more from bulk sediment analysis by a range of iTag primer sets or gene libraries to assess potential sequencing biases in a new microbial community.
Multiple statistical methods supported differences between Magneto-FISH enrichments and the bulk sediment. We also found variation between SparCC network computations. Therefore, we added confidence to network associations by reporting the number of times an association was recovered out of 100 co-occurrence iterations along with correlation
andp-value.
Our resultant microbial community network had many statistically significant methane seep taxa correlations beyond the common ANME/SRB association. The downplay of anaerobic methanotrophs in our iTag sequencing may have had the beneficial effect of bringing fermenters to the forefront, highlighting their complex role in methane seep microbial communities. Within the core methane seep microbiome taxa, there were strong
associations between Atribacteriaand Hyd24-12 andDeltaproteobacteria, but no direct
association betweenAtribacteriaand Hyd24-12. This may indicate a different niche for these
two currently uncultured groups in methane seep systems.SulfurovumandSulfurimonas
were differentiated as either Deltaproteobacteria-associated or archaea-associated,
respectively. There were statistically significant associations betweenDeltaproteobacteria
and non-Proteobacteria, such as thePlanctomycetes sediment group ‘AKAU3564,’ and
groups that contained neither SRB nor ANME but had high statistical significance, such as MBG-B and OM1. Future development and application of more specific FISH probes will assist in further hypotheses development and testing of these associations in Hydrate Ridge methane seeps.